
EB Daily Market Report - Thursday, July 13, 2023
Executive Market Summary
- Futures were strong overnight and that strength has carried over into the trading day
- For a second consecutive day, we've received economic news that suggests inflation continues to moderate
- The June PPI and Core PPI both came in below expectations, just as the June CPI did yesterday
- The NASDAQ is showing relative strength today as it currently trades at its daily high
- Cryptos are moving higher with litecoin ($LTCUSD) up nearly 8% and etherium ($ETHUSD) up more than 6%
- Gold is relatively flat, but most other commodities are having very strong days, led by silver ($SILVER, +2.86%) and copper ($COPPER, +2.41%)
- The 10-year treasury yield ($TNX) is rapidly descending, falling another 9 basis points today to 3.76%
- Aggressive sectors are leading today's advance as communication services (XLC, +1.36%) is the leading sector
- Internet stocks ($DJUSNS, +3.36%) are jumping again as Alphabet (GOOGL, +4.52%) surges
Market Outlook
We've almost reached the most bearish historical period of the year on the S&P 500, which runs from the July 17th close (Monday) through the September 26th. Please don't overreact. Yes, it's the most bearish period, but rarely do we see HUGE drops. The annualized return for this period is -2.00%, well below the S&P 500's average annual return of 9%. Clearly, the tendency during the summer months is to struggle. But it does NOT mean that we'll see a major selloff. In fact, given the bullish signals that I'm seeing in the market, I believe we'll be higher on September 26th than we are now. I just wouldn't bank on a massive move higher. My suggestion? Lower your expectations, but maintain a bullish bias.
Beginning with Monday's close, the S&P 500 enters its second most bearish week of the year. Only October 21st through 27th is worse. Here are the historical bearish details (annualized returns) for next week (July 17th close through July 23rd close) across our key major indices:
- S&P 500: -16.82%
- NASDAQ: -31.48%
- Russell 2000: -31.76%
Keep in mind these are tendencies, NOT GUARANTEES.
Sector/Industry Focus
I want to give you a quick update on sentiment, because the 5-day moving average of the equity only put call ratio ($CPCE) continues to fall further and further. When this moving average finds a bottom, it's quite likely the stock market will find a short-term top. Check out the current chart:
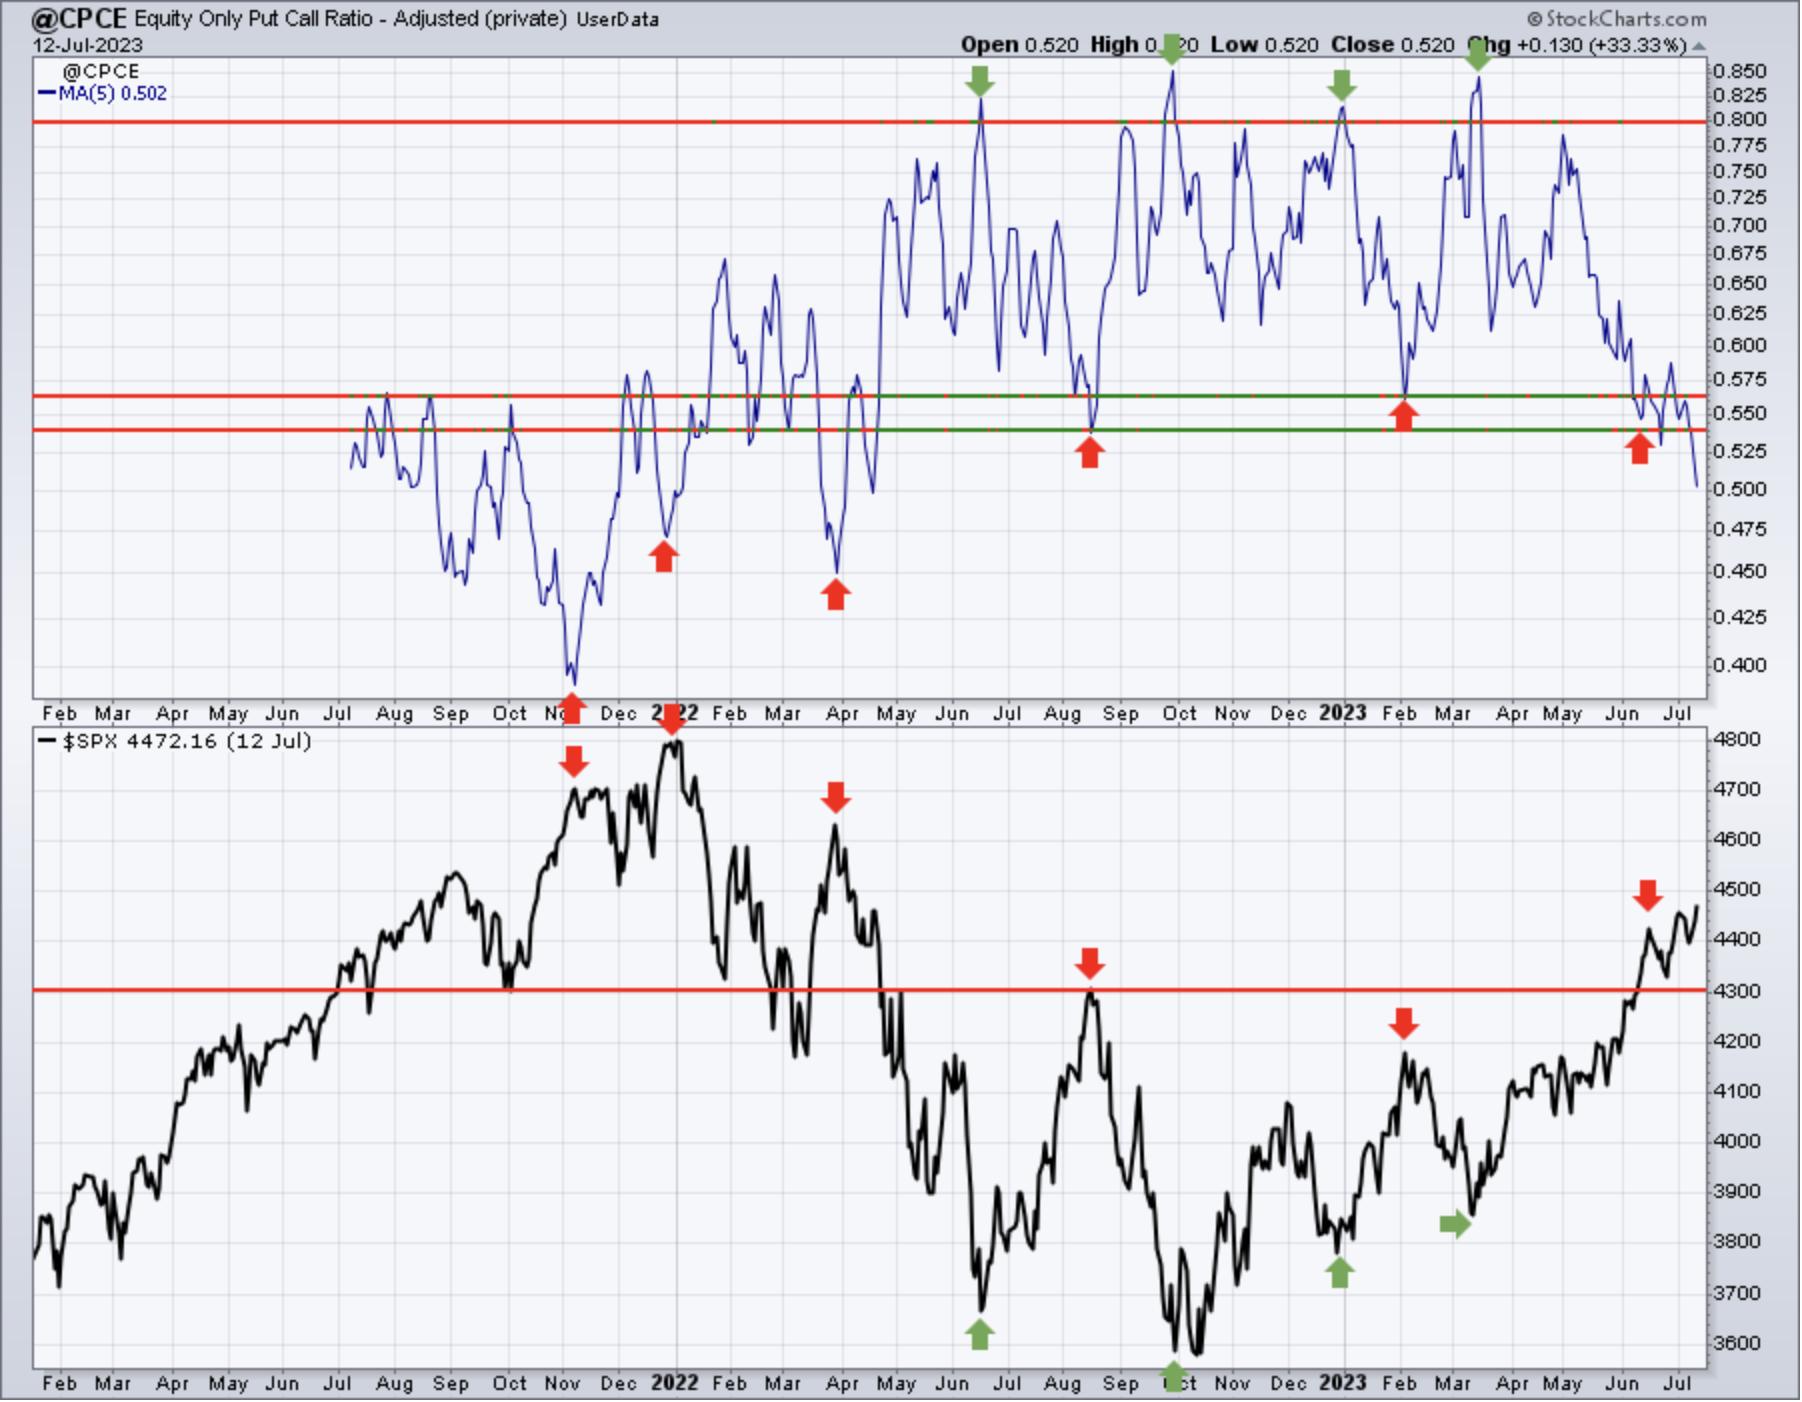
We've been moving into a much more bullish period in 2023, so it's understandable that these 5-day moving averages of the CPCE will move lower and lower. However, I'd be VERY surprised if we see this moving average get down to the .45 level that we saw in April 2022. My guess is that we're getting very close to a significant bottom in this sentiment reading, which could easily coincide with the bearish historical period that we'll be facing next week.
I say this just to spread a bit of short-term caution. This is NOT a long-term signal. But it could lead to some weakness next week. I am not a believer in leveraged ETFs right now, given the heightened risk.
ChartLists/Strategies
Here is an update on the 2 "trades" from our Live Trading Room yesterday - for those that attended and are interested in an update:
PANW:
PANW was initially considered, because it was a poor performer early in the trading day yesterday and it was included in our Strong AD ChartList (SADCL). SADCL stocks tend to perform strongly in the afternoon and close in the upper half of their daily trading range. PANW had been trending higher, printed an early intraday low below its 20-day EMA, so my expectation was for a nice afternoon finish and a successful test of the 20-day EMA. I mentioned at the time of the trade that any intraday move beneath yesterday morning's initial low could be a reason to exit with a minor loss. That would have represented a loss of less than 1%. Unfortunately, I didn't place a stop order and ended up losing nearly 2% or so before I exited. Here was the 5-day 10-minute chart:
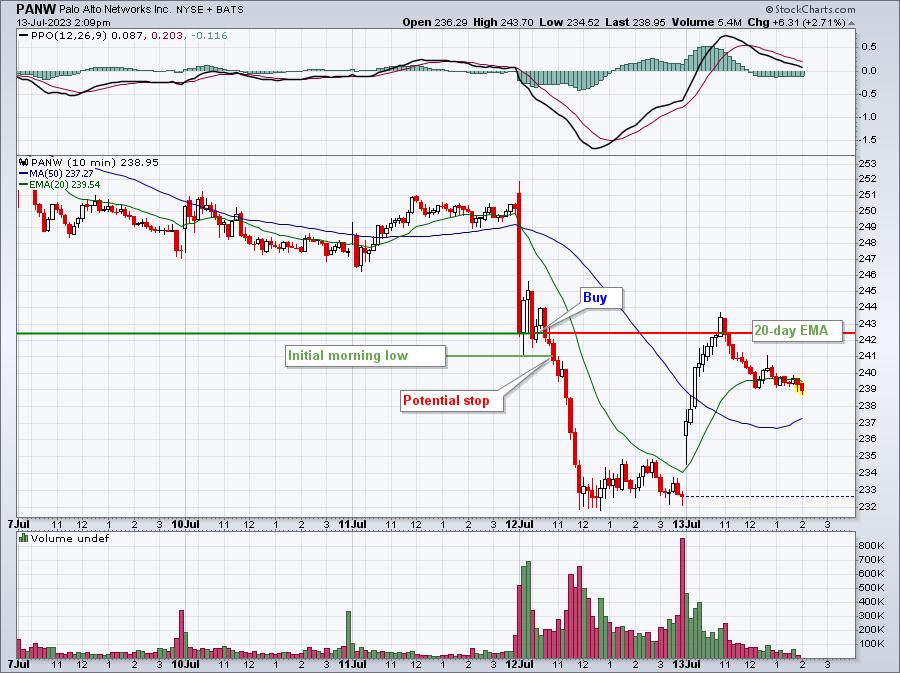
Again, the purpose of this trade and the expectation was that the Strong AD would result in morning weakness and an afternoon recovery. That's what I was banking on. The failure to do recover was reason for me to exit this trade, which occurred, unfortunately, below 238.00.
CNK:
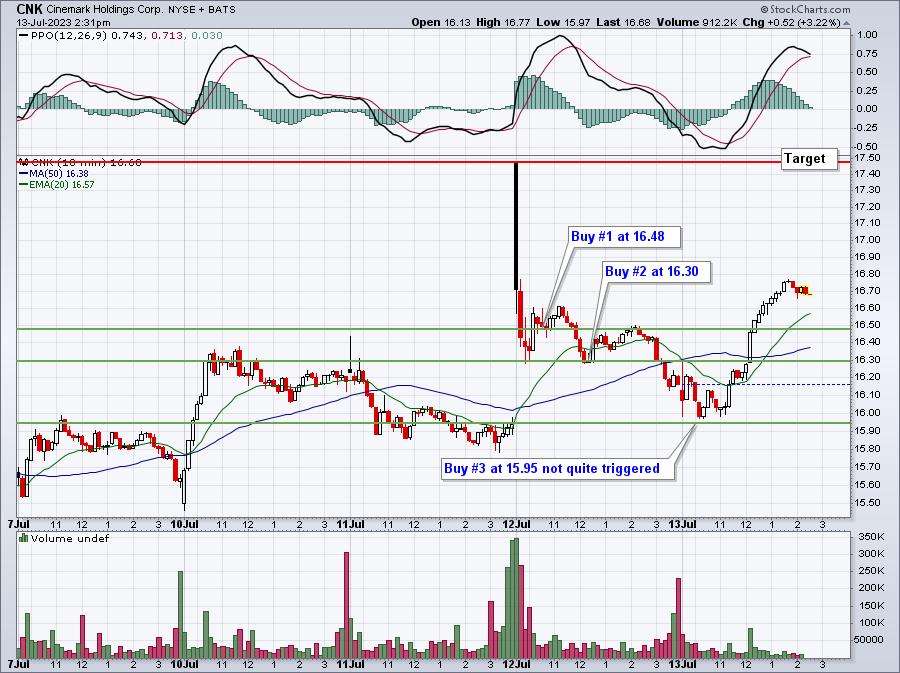
This was our second "trade" and this one came from our 20-day EMA scan that is part of our Scanning Strategies on our website. I love trading 20-day EMA tests during market uptrends, realizing that, sometimes, stocks will trade temporarily just below this key moving average. Our trade strategy here was to buy 1/3 at the current price during the trading room (16.48), buy 1/3 at 16.30 (near the initial morning low), and 1/3 at 15.95 (just above key gap support). Those buys would average us in at roughly at 16.25, with a closing stop beneath 15.75. Our short-term target would be 17.47, the opening gap on Tuesday. Here's the 5-day 10-minute chart on CNK:
Earnings Reports
Here are the key earnings reports for the next two days, featuring stocks with market caps of more than $10 billion. I also include notable companies with market caps below $10 billion. Finally, any portfolio stocks that will be reporting results are highlighted in BOLD. If you decide to hold a stock into earnings, please understand the significant short-term risk that you are taking. Please be sure to check for earnings dates for any companies that you own or are considering owning.
Thursday, July 11:
PEP, PGR, CTAS, DAL, WIT, CAG, AEHR
Friday, July 12:
UNH, JPM, WFC, BLK, C, STT, ERIC, VIST
Economic Reports
Initial jobless claims: 237,000 (actual) vs. 249,000 (estimate)
June PPI: +0.1% (actual) vs. +0.2% (estimate)
June Core PPI: +0.1% (actual) vs. +0.2% (estimate)
Happy trading!
Tom