
EB Daily Market Report - Thursday, July 20, 2023
Model ETF Portfolio Update
We will be implementing a couple changes to our Model ETF Portfolio draft and webinar. We already know that the 19th to the 25th of each calendar month historically has been more bearish than any other period of the month. Our portfolios in the past have also gotten off to rough starts, probably due to this historical factor. So beginning this month, we're going to modify our schedule a bit.
First, our current Model ETF Portfolio was "sold" as of yesterday's close (July 19th) as we normally do. However, we will not begin our next Model ETF Portfolio until next Tuesday's close (July 25th). We will treat the portfolio as though it is in CASH, until purchases are made as of the close next Tuesday. As a result, we have moved our Model ETF Draft event to next Tuesday's close, July 25th, at 5:30pm ET.
Executive Market Summary
- Futures were mostly lower overnight with more weakness on the NASDAQ
- Our major indices opened lower (except for the Dow Jones), and we've seen bifurcated action throughout the day with the Dow Jones the only index to trade higher
- Aggressive sectors are being hit hard (see Sector/Industry Focus below) as Tesla (TSLA, -7.08%) and Netflix (NFLX, -9.48%) both sell off hard after their earnings reports were released on Wednesday afternoon
- It's not helping to see the 10-year treasury yield ($TNX) up 12 basis points to 3.86%, with a FOMC meeting on deck for next week
- Automobiles ($DJUSAU, -6.20%) are struggling after the TSLA report
- The widely-diversified retail ETF (XRT, -1.36%) is showing considerable weakness, adding to the poor relative strength in consumer discretionary (XLY, -2.58%), today's weakest sector
- Much of the strength in the Dow Jones is earnings related; Johnson & Johnson (JNJ, +6.51%) and International Business Machines (IBM, +3.19%) are both enjoying very solid days
Market Outlook
Goal number 1 has been achieved. The 60-minute negative divergence on the NASDAQ has resulted in a PPO centerline "reset". It's VERY difficult to say how much selling we'll see the balance of this week and into next, but there remain significant risks. Usually, one day of selling doesn't do the trick. I believe that the recent high is now a key watermark that, until cleared, represents key price resistance. First, I'll highlight the NASDAQ 100 ($NDX) and how it's 60-minute negative divergence has played out:
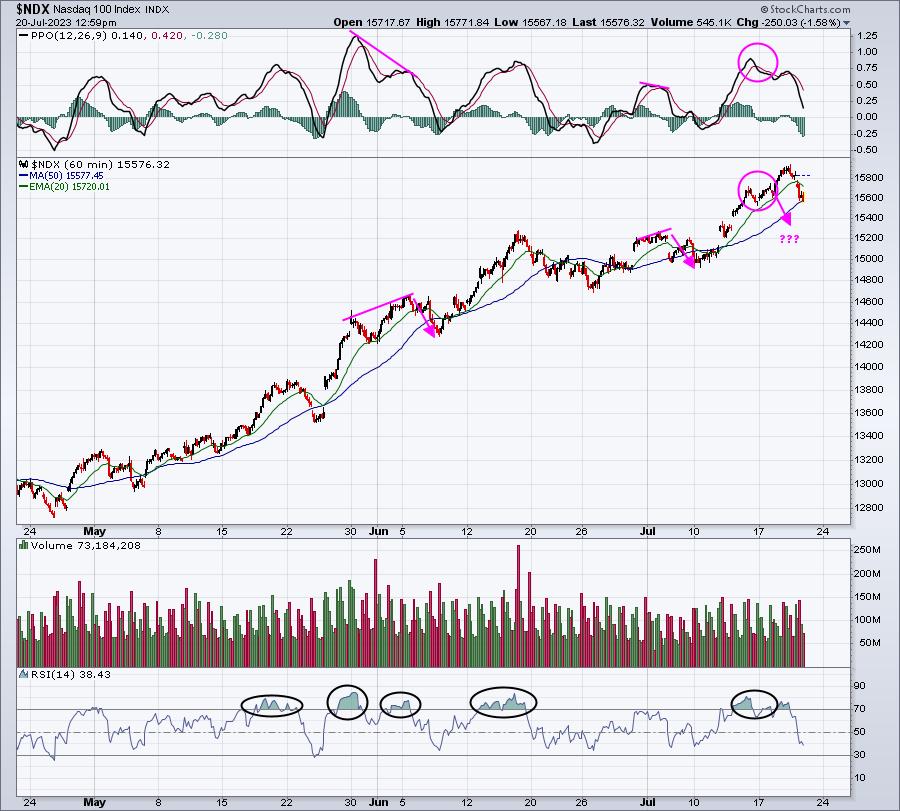
This was a chart that I provided in Monday's DMR. I left the annotations untouched, so that you can see how the NDX went on to print one more high, but with that negative divergence perfectly intact. Also, the recent selling is almost identical to what I suggested could happen based on this chart. The warning was there, but it's the timing that isn't always perfect. The NDX has hit its 50-day SMA and its hourly PPO is very close to a centerline reset.
The hourly chart is now no longer a problem and the NDX is free to move wherever, without momentum constraints on an hourly basis.
Buttttt..............
We also have that nasty negative divergence on the daily NDX chart and this is where things could get interesting. A 50-DAY EMA test is still nearly 1000 points away. I don't know if we get there, but you have to understand that's a significant risk of short-term trading this group of stocks right now on the long side. Check out where we are on this daily chart:
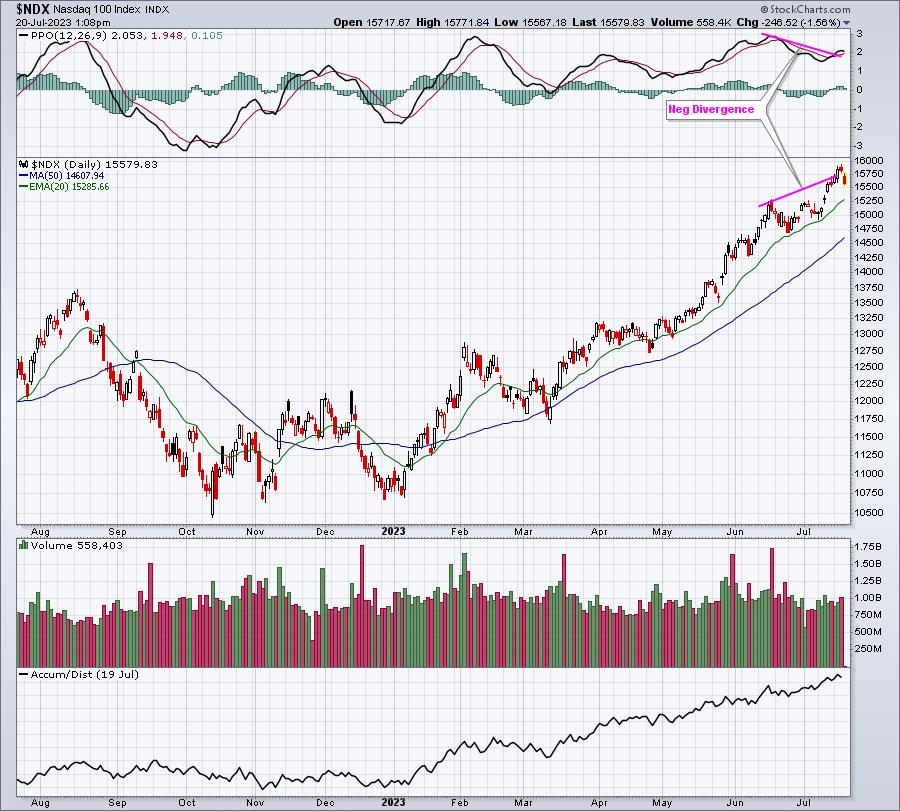
Again, this was the exact chart provided in Monday's DMR, with annotations untouched. Price did move slightly higher, but the negative divergence remained. In order for this daily chart to see its momentum issue resolved, we'd need to see a PPO centerline test and/or a 50-day SMA test. It could take 2-3 weeks, or longer, to reset that PPO. I don't know if we get there, but trading on the long side during the bearish 19th to 25th period with options expiring, and this negative divergence present adds BIG risk to the equation. I prefer sitting it out.
Sector/Industry Focus
Today is a perfect illustration of how the max pain effect can morph into "Opposite George" week. Everything that's been working in the market is subject to sudden downside action as tons of net in-the-money call premium potentially gets wiped out. And things that haven't been working suddenly get hot. Look at today's sector summary:
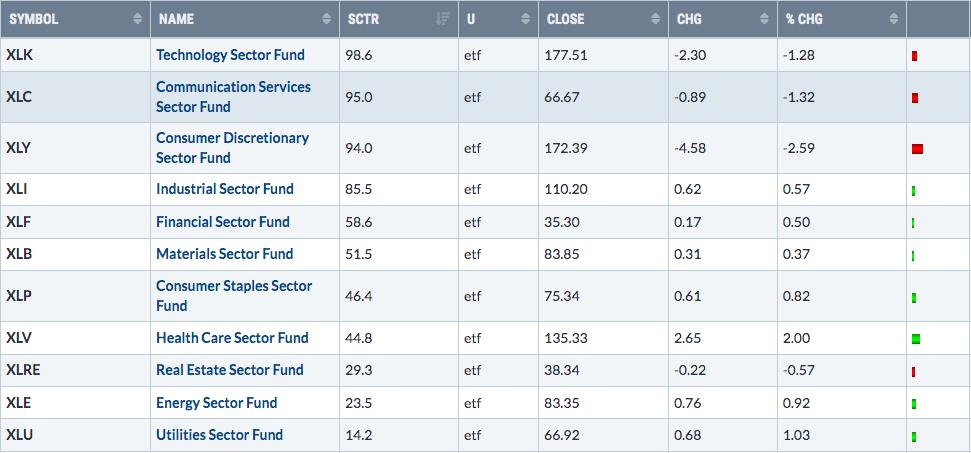
I sorted these sectors in SCTR order, top to bottom. The best sectors can't catch a bid, while the worst sectors are "feeling the love" - for now. It's how Wall Street manipulates the masses to the benefit of those big Wall Street firms. This type of monthly manipulation is never discussed in the media. I wonder why.
ChartLists/Strategies
As I've said, I see no reason to push the envelope here on the long side with so many short-term warning signs in play. And if you're questioning why we're not discussing shorts, it's because I do not short a secular bull market advance, no matter how overbought, no matter how many momentum issues we face. Cash works good enough for me. If prices continue to decline, my purchasing power increases and opportunities will abound.
Earnings Reports
Here are the key earnings reports for the next two days, featuring stocks with market caps of more than $10 billion. I also include notable companies with market caps below $10 billion. Finally, any portfolio stocks that will be reporting results are highlighted in BOLD. If you decide to hold a stock into earnings, please understand the significant short-term risk that you are taking. Please be sure to check for earnings dates for any companies that you own or are considering owning.
Thursday, July 20:
TSM, JNJ, ABT, SAP, PM, ISRG, MMC, BX, INFY, CSX, FCX, TFC, COF, DHI, TRV, NEM, PPG, GPC, NOK, FITB, WRB, SNA, POOL, ALL, KEY, MKTX, KNX, EWBC, WBS, OZK, HOMB, MAN, TCBI, HTH
Friday, July 21:
AXP, SLB, ROP, RF, HBAN, IPG, AN, ALV, CMA
Economic Reports
Initial jobless claims: 228,000 (actual) vs. 241,000 (estimate)
July Philadelphia Fed manufacturing index: -13.5 (actual) vs. -10.2 (estimate)
June existing home sales: 4,160,000 (actual) vs. 4,230,000 (estimate)
June leading indicators: -0.7% (actual) vs. -0.6% (estimate)
Happy trading!
Tom