
EB Daily Market Report - Friday, July 28, 2023
ChartLists Updated
I've updated the Model ETF Portfolio ChartList and will be updating others this weekend. Also, the ETF Analyzer spreadsheet has been posted to our website and available for download.
Executive Market Summary
- Futures were strong overnight after Intel, Inc. (INTC, +5.82%) and Roku, Inc. (ROKU, +26.37%) reported much-better-than-expected Q2 earnings results
- The 10-year treasury yield ($TNX) retreated 4 basis points to 3.97%, helping to fuel today's stock rally as well
- Our major indices have been higher throughout the day, with the NASDAQ leading on a relative basis, up nearly 2%
- Communication services (XLC, +2.05%), consumer discretionary (XLY, +1.74%), and technology (XLK, +1.37%) are easily the three best performing sectors
- Automobiles ($DJUSAU, +3.17%) are aiding consumer discretionary as Tesla (TSLA, +4.04%) tests its 20-day EMA
- Crude oil prices ($WTIC, +0.54%) have broken back above $80 per barrel for the first time since April; we haven't seen a close above $83.50 since November 2022, but we're getting closer
- Gold ($GOLD, +0.72%) is rallying a bit as the dollar (UUP, -0.19%) falls back
- While many earnings reports are coming in stronger than expected, Enphase Energy (ENPH, -7.75%) is not one of them, missing on revenues, though beating EPS (1.47 vs. 1.27)
Market Outlook
Yesterday, the Dow Jones broke a 13-day winning streak, falling just shy of the record of 14 consecutive winning days, set in 1897 (that's not a transposition). To me, however, it isn't how many days in a row you move higher. It's how MUCH higher you've gone. The chart below shows the Dow Jones daily performance this century and, in the bottom panel, reflects the 14-day rate of change (ROC). Currently, we're at 4.47% and that number has been seen often during bull market advances:
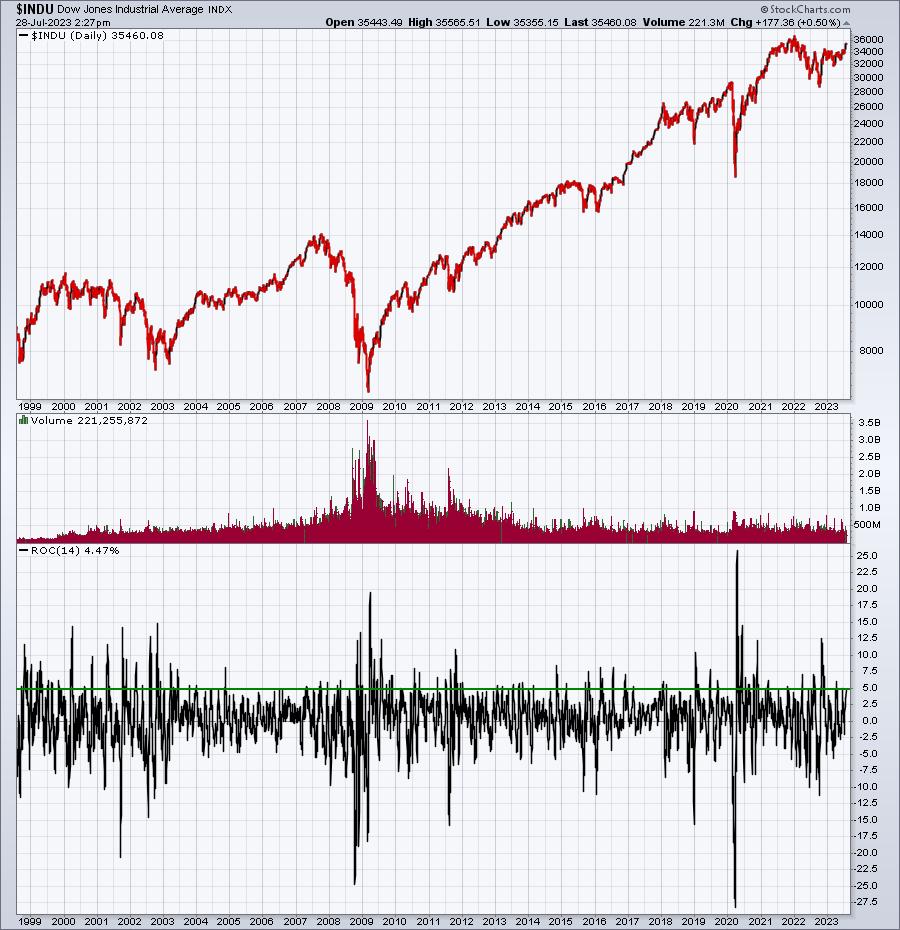
I've drawn a horizontal line at 5%, so you can easily see how many times this century that the Dow Jones has done over 14 consecutive days what it's doing right now. Honestly, I don't see the significance, but I suppose it provides CNBC the opportunity to chew up hours and hours with "expert" guests (sarcasm).
Sector/Industry Focus
Railroads ($DJUSRR) broke out above key price resistance near 3200 and that'll likely lead to much stronger action from this group:
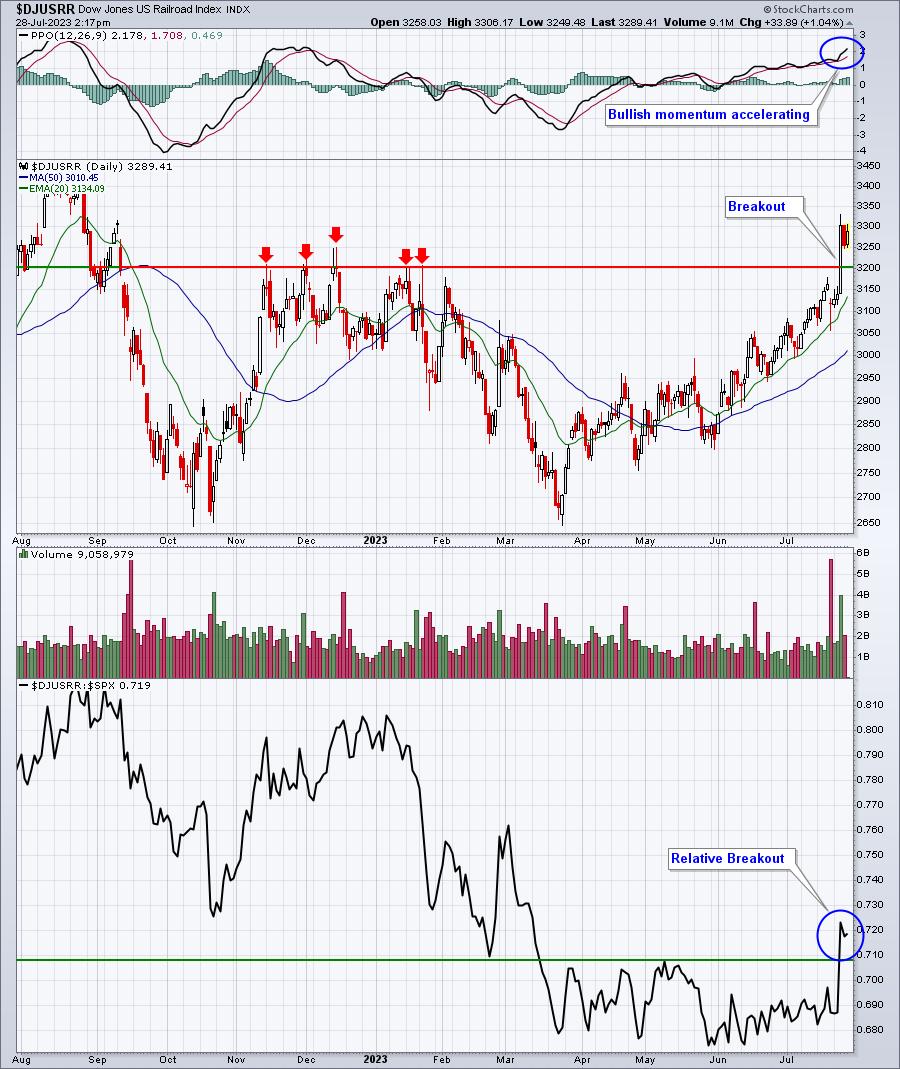
Any trip back to test the breakout level near 3200 would be a great opportunity to find a railroad stock that shows improving relative strength. I see this group much higher in time.
ChartLists/Strategies
Here are two stocks that look attractive on their 50-day SMA tests:
NFLX:
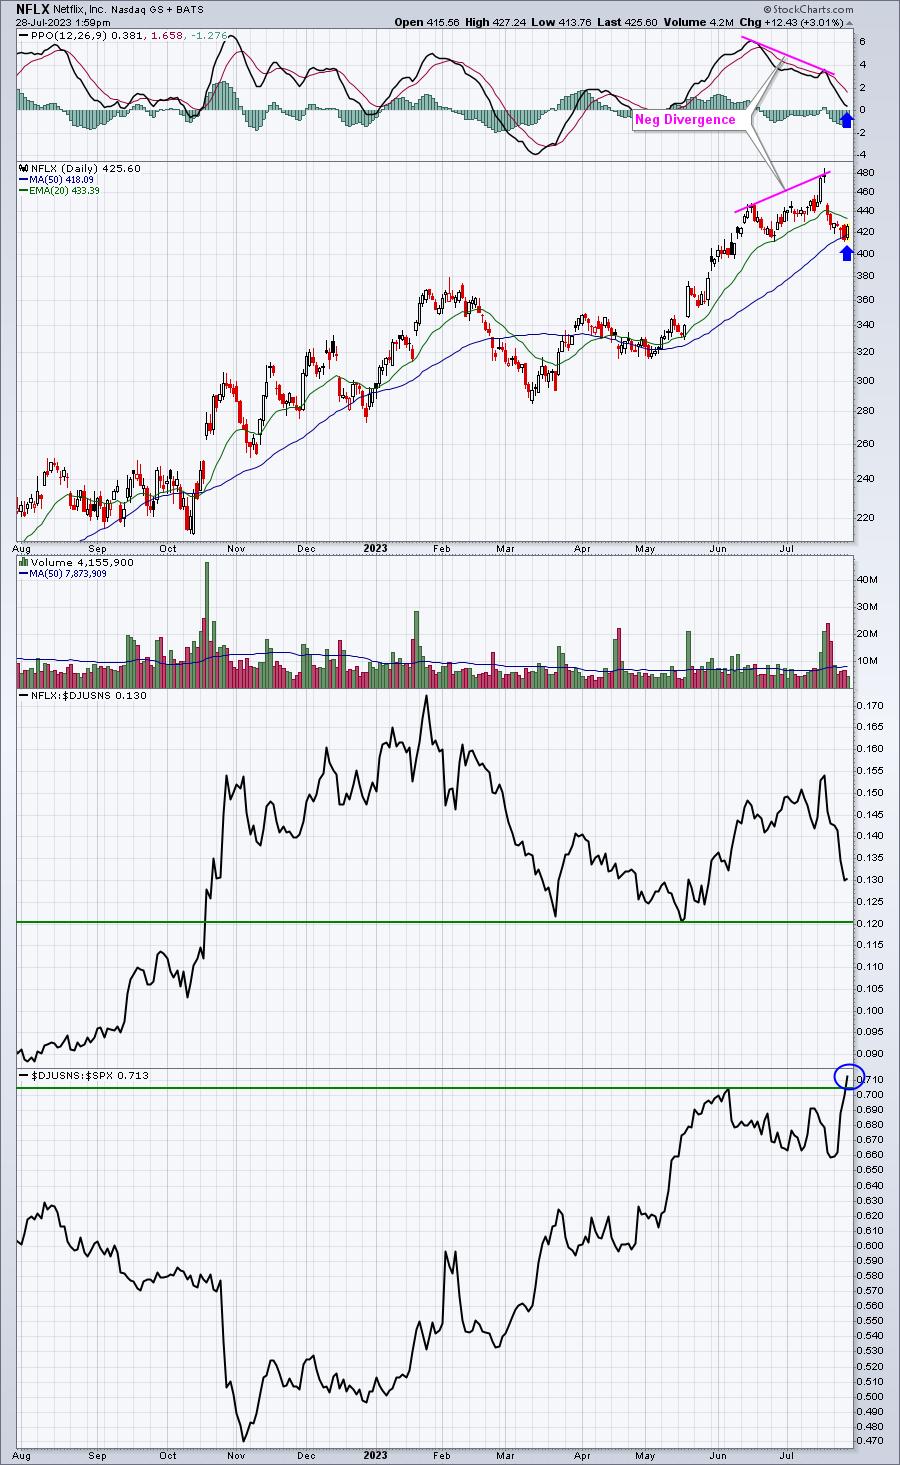
The negative divergence has played out to a PPO centerline reset and a 50-day SMA test. I'd expect to see NFLX rise from here.
MSFT:
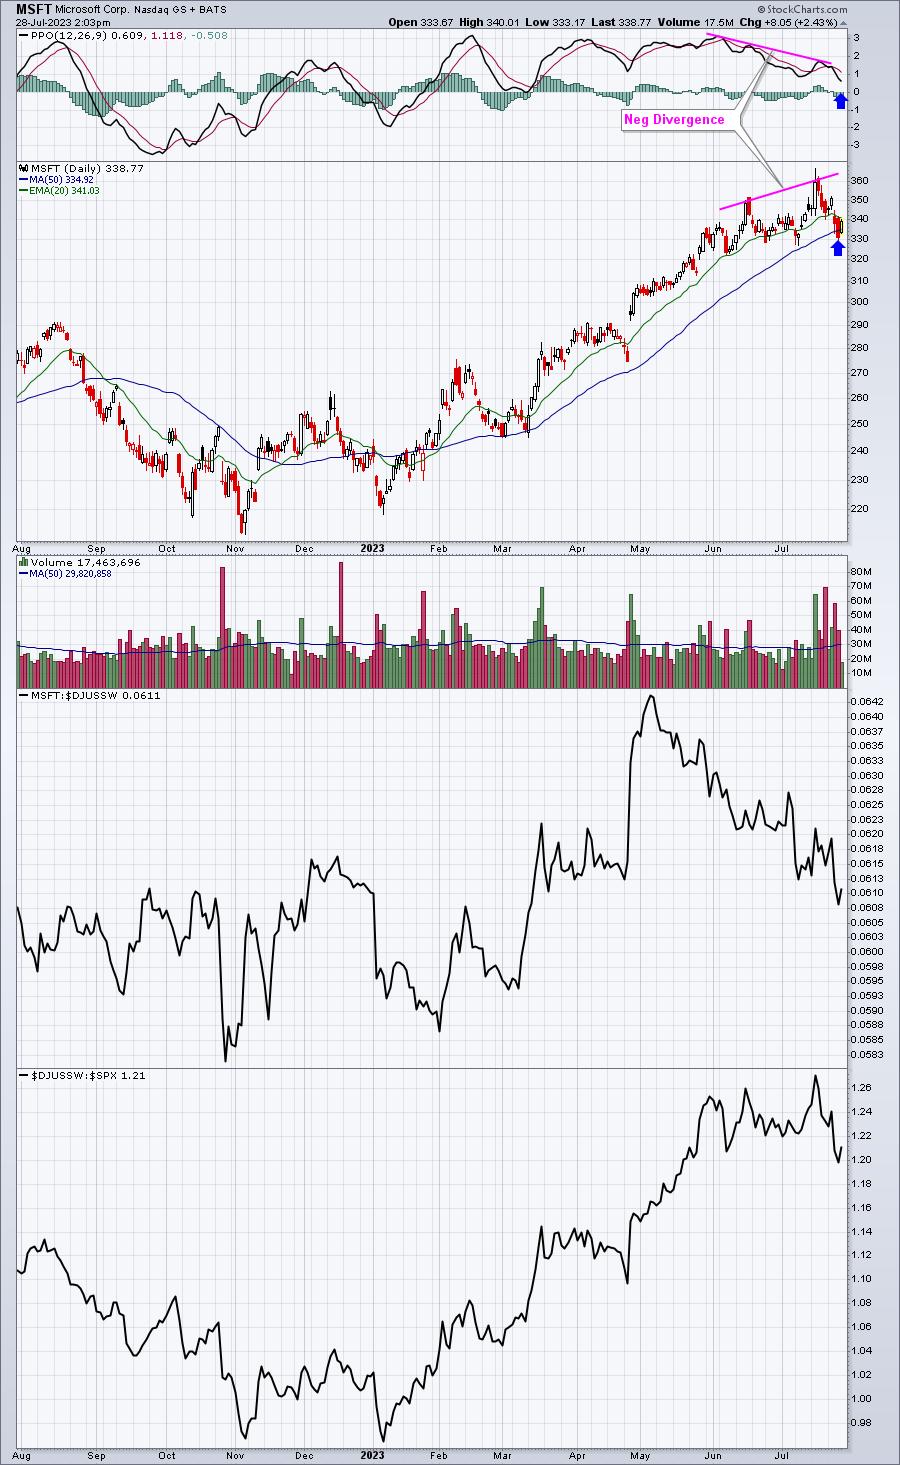
Looks similar to the NFLX chart. MSFT's 50-day SMA test is the first one since mid-March.
Earnings Reports
Here are the key earnings reports for the next two days, featuring stocks with market caps of more than $10 billion. I also include notable companies with market caps below $10 billion. Finally, any portfolio stocks that will be reporting results are highlighted in BOLD. If you decide to hold a stock into earnings, please understand the significant short-term risk that you are taking. Please be sure to check for earnings dates for any companies that you own or are considering owning.
Friday, July 28:
XOM, PG, CVX, AZN, SNY, AON, CL, CHTR, CNC, TRP, IMO, TROW, CHD, CNHI, WPC, AVTR, BAH, BEN, SAIA, STVN, NVT, GNTX, GTLS, POR, NWL, CRI, DAN, ARCB
Monday, July 31:
ANET, RSG, ON, WELL, AVB, FANG, ES, MPWR, YUMC, SBAC, SYM, HOLX, BMRN, AER, L, WDC, LSCC, TFII, CNA, ZI, BSAC, RRX, SOFI, CAR, THC, TREX, WWD, AMKR, RIG, RMBS, SON, HUN, PCH, VNO, IMGN, SANM, CRK, VRNS, CNO, HLIT
Economic Reports
June personal income: +0.3% (actual) vs. +0.4% (estimate)
June personal spending: +0.5% (actual) vs. +0.4% (estimate)
June PCE price index: +0.2% (actual) vs. +0.2% (estimate)
June Core PCE price index: +0.2% (actual) vs. +0.2% (estimate)
Q2 employment cost index: +1.0% (actual) vs. +1.1% (estimate)
July consumer sentiment: 71.6 (actual) vs. 72.6 (estimate)
Happy trading!
Tom