
EB Daily Market Report - Monday, July 31, 2023
ChartLists Updated
I updated several ChartLists over the weekend:
- Strong Earnings ChartList (SECL)
- Strong Future Earnings ChartList (SFECL)
- Short Squeeze ChartList (SSCL)
- Upcoming Earnings ChartLists for this week
- Upcoming Earnings Relative Strength ChartList for this week
These updated ChartLists are now available on our website for download/viewing.
I plan to update the following ChartLists over the next couple days:
- Strong AD ChartList (SADCL)
- Raised Guidance ChartList (RGCL)
- Bullish Trifecta ChartList (BTCL)
- Earnings AD ChartList (EADCL)
Finally, I'll be working on August Seasonality and hope to have that report out to everyone between today and Wednesday.
Executive Market Summary
- Futures were higher this morning as we opened the week with small gains
- We've seen outperformance by the small caps ($SML, +0.61%) and mid caps ($MID, +0.16%)
- The 10-year treasury yield ($TNX) is down a basis point to 3.96%
- Commodities are mostly higher as crude oil ($WTIC, +1.72%) jumps to nearly $82 per barrel
- Energy (XLE, +1.84%) is easily today's top-performing sector with crude oil climbing
- Meanwhile, our aggressive sectors are mostly flat as internet stocks ($DJUSNS, -0.62%) cool off
- It's been mostly a flat and boring day with little volatility intraday
Market Outlook
As a reminder, small caps (IWM) are looking to break a VERY significant resistance level. The IWM has not closed above 198.00 since April 2022 - 15 months ago. Here's a longer-term weekly chart of the IWM to give you some perspective:
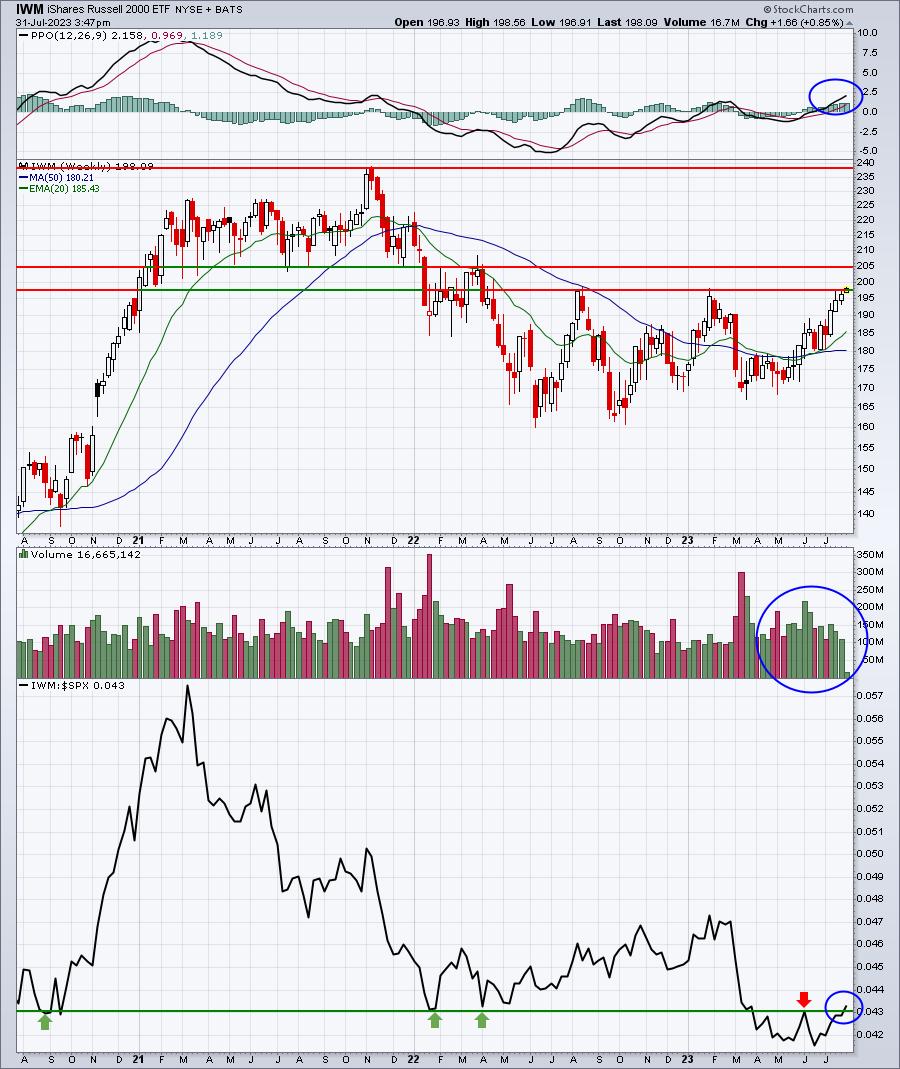
I continue to grow more and more bullish on small caps every day. The latest rally has been accompanied by excellent volume trends and you can see that the IWM:SPY ratio is pushing to a 4-month high. If we break through 198, I see the potential for some consolidation between 198-205. A breakout above 205 and I don't really see any significant headwinds until the IWM reaches 238, which is why I favor the TNA on further IWM strength.
Sector/Industry Focus
Financial administration stocks ($DJUSFA) have been absolutely abysmal since mid-July 2021 and we've seen little reason to get excited about the group in 2023 quite honestly. However, the group MIGHT be turning the corner finally here in July 2023, two years later. Check this out:
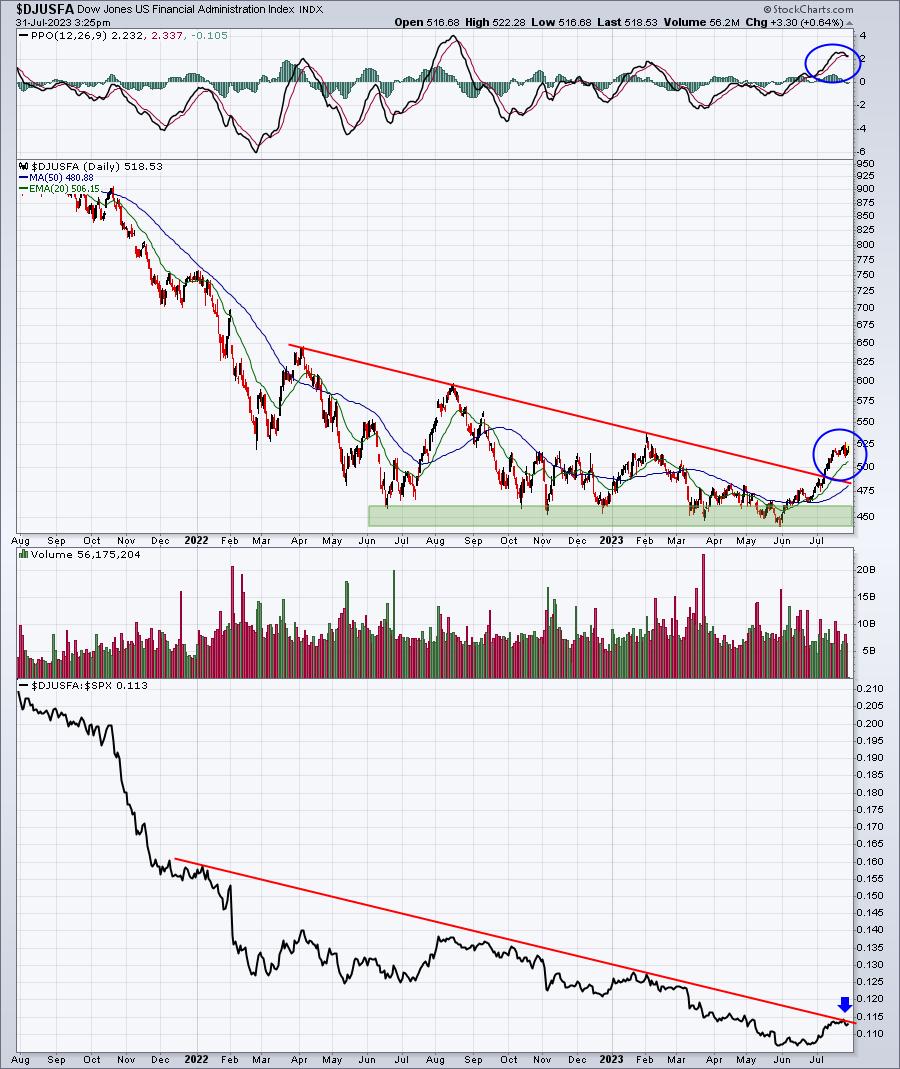
The DJUSFA is the 16th-ranked industry group over the past month (out of 104) and only trails banks ($DJUSBK) within the financial sector. I don't know that I quite trust the group yet, but the improvement has been obvious. I want to see that relative strength improvement continue and possibly even accelerate.
ChartLists/Strategies
I ran a scan of the most recent Raised Guidance ChartList (from July 14th, should be updated within next day or two) and the Upcoming Earnings ChartList for today after the market closes (AMC) and tomorrow before the market opens (BMO). 29 stocks were returned, but here are the 10 with SCTRs above 75 (solid relative strength):
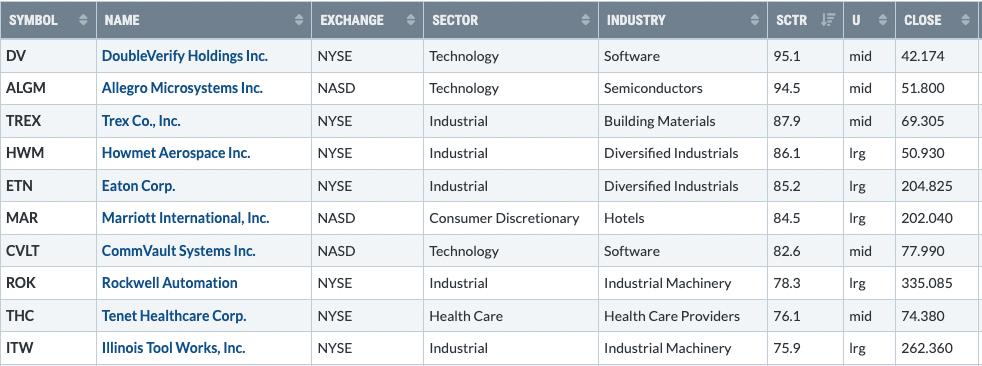
DV looks really solid, leading the red-hot software space ($DJUSSW) the past few months, but it's overbought with a negative divergence. We could see a "sell on the news" scenario evolve. If we do, DV could look very interesting on a 50-day SMA test, possibly even slightly beneath it:
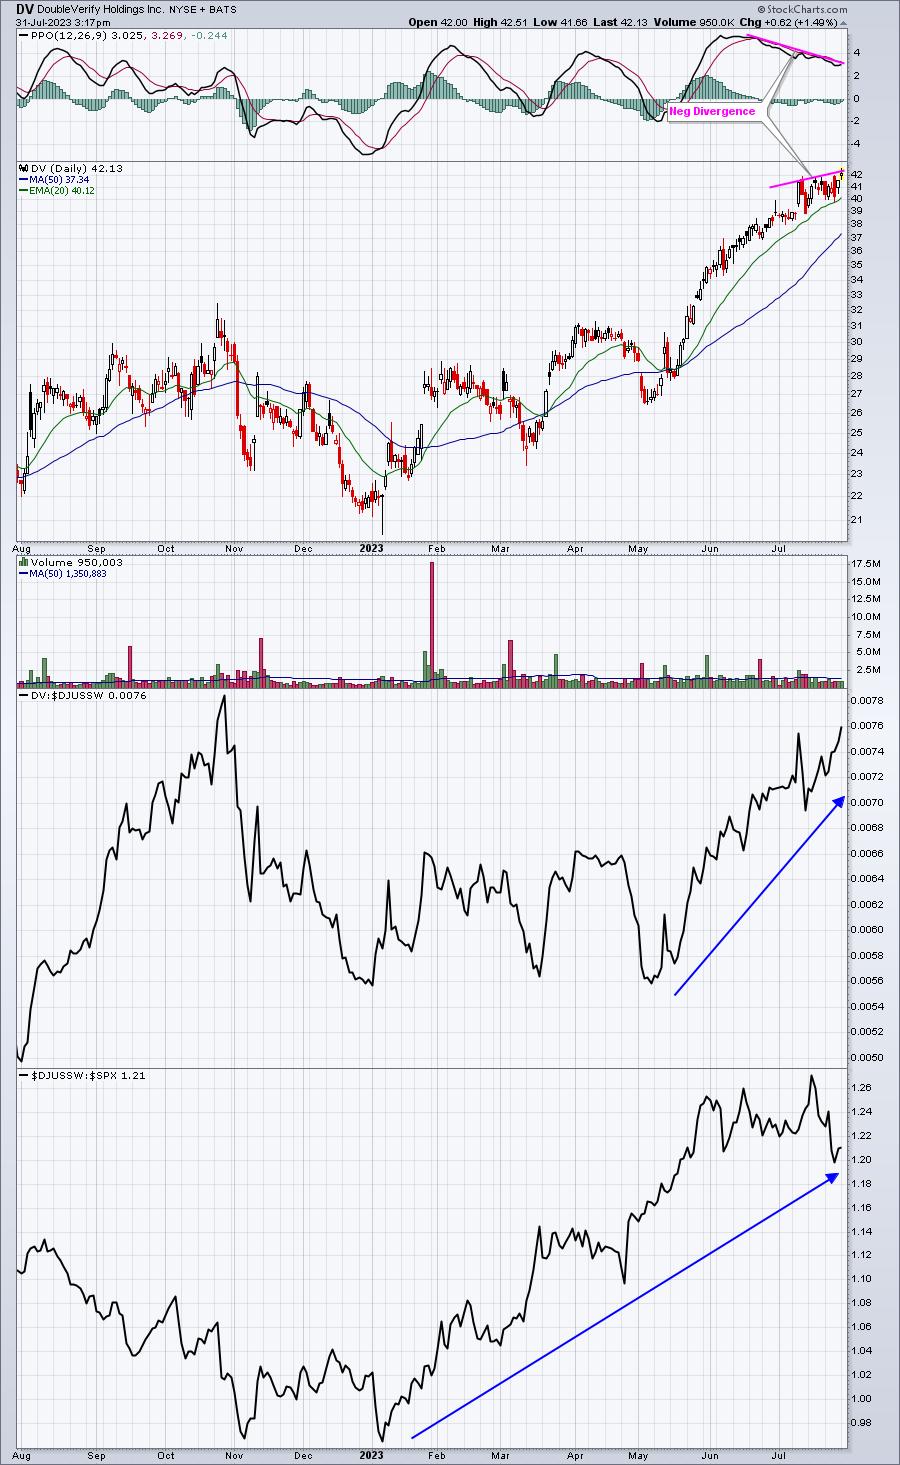
I think we either see a selloff at the opening bell tomorrow or a gap higher, followed by selling. This rally looks long in the tooth and DV would benefit from some selling and consolidation. I'd be shocked, however, if DV missed its revenue or EPS guidance. I see a very solid report being released later today.
For those interested, I bought small positions in both Autonation (AN) and Manhattan Associates (MANH) last Wednesday during our Live Trading Room session. I continue to hold both. Taking profits in AN as it approaches its 20-day EMA would not be a bad strategy to lock in profits. I like the possible bullish engulfing candle in MANH today. If that completes the pattern, we may have reached bottom on this one.
If we break out on the IWM today (197.85 is the highest candle body - open or close - over the past 52 weeks), I'll likely rotate a portion of my trading portfolio into the TNA (ETF that tracks the IWM at a 3 to 1 clip). The TNA is LEVERAGED and adds risk to your portfolio. It's not for everyone, so please be sure you understand and are willing to assume this risk if you move into it.
Earnings Reports
Here are the key earnings reports for the next two days, featuring stocks with market caps of more than $10 billion. I also include notable companies with market caps below $10 billion. Finally, any portfolio stocks that will be reporting results are highlighted in BOLD. If you decide to hold a stock into earnings, please understand the significant short-term risk that you are taking. Please be sure to check for earnings dates for any companies that you own or are considering owning.
Monday, July 31:
ANET, RSG, ON, WELL, AVB, FANG, ES, MPWR, YUMC, SBAC, SYM, HOLX, BMRN, AER, L, WDC, LSCC, TFII, CNA, ZI, BSAC, RRX, SOFI, CAR, THC, TREX, WWD, AMKR, RIG, RMBS, SON, HUN, PCH, VNO, IMGN, SANM, CRK, VRNS, CNO, HLIT
Tuesday, August 1:
MRK, PFE, AMD, CAT, SBUX, BP, UBER, VRTX, MO, ETN, ITW, MAR, MPC, ECL, PXD, IDXX, AIG, AFL, IQV, SYY, ROK, EA, AME, MPLX, PRU, DVN, PEG, ARES, ALL, ZBH, WEC, GPN, IT, STE, FE, PAYC, HWM, SIRI, PINS, EXAS, OWL, RVTY, ZBRA, SWK, TAP, WSO, INCY, SEDG, MOS, LDOS, CZR, MTCH, PEN, AZPN, CHK, BXP, SCI, NBIX, UNM, ALGM, NCLH, LEA, TX, INSP, IGT, ELF, MSTR, FRSH, SFM, TEX, OI, CVLT, JBLU, BLMN, KMT, SSTK, TGH, SPWR, NUS, SPCE
Economic Reports
July Chicago PMI: 42.8 (actual) vs. 43.5 (estimate)
Happy trading!
Tom