
EB Daily Market Report - Tuesday, August 1, 2023
ChartLists Updated
I should have a few more ChartLists updated by this evening and you should be able to view/download them by early tomorrow morning:
- Strong AD ChartList (SADCL)
- Raised Guidance ChartList (RGCL)
- Bullish Trifecta ChartList (BTCL)
Next up will be the August Seasonality and I hope to have that report out to everyone by Wednesday evening.
Executive Market Summary
- Futures were down overnight and we saw our major indices open the month of August on a down note
- Trading has improved throughout much of the day, however, with leadership from the Dow Jones, rising 0.10% on the session
- Gold ($GOLD) jumped back above $2000 per ounce yesterday, but a stronger dollar (UUP, +0.42%) has triggered a 1.3% decline in gold today
- Crude oil ($WTIC, -0.42%) remains just below the $82 per barrel level
- Industrials (XLI, +0.25%) and technology (XLK, +0.19%) are the only two sectors gaining ground today
- Commercial trucks & vehicles ($DJUSHR, +3.54%) are getting a lift from Caterpillar's (CAT, +8.49%) quarterly results, significantly aiding the Dow Jones
- Tomorrow morning we'll get the July ADP employment report, and on Thursday afternoon, it'll be the combination of Apple's (AAPL) and Amazon's (AMZN) earnings that'll grab the headlines
Market Outlook
After a recent pullback in my favorite sustainability ratio, consumer discretionary vs. consumer staples (XLY:XLP), we appear to be starting another uptrend. Should this ratio keep climbing, I would expect the S&P 500 to move higher as well:
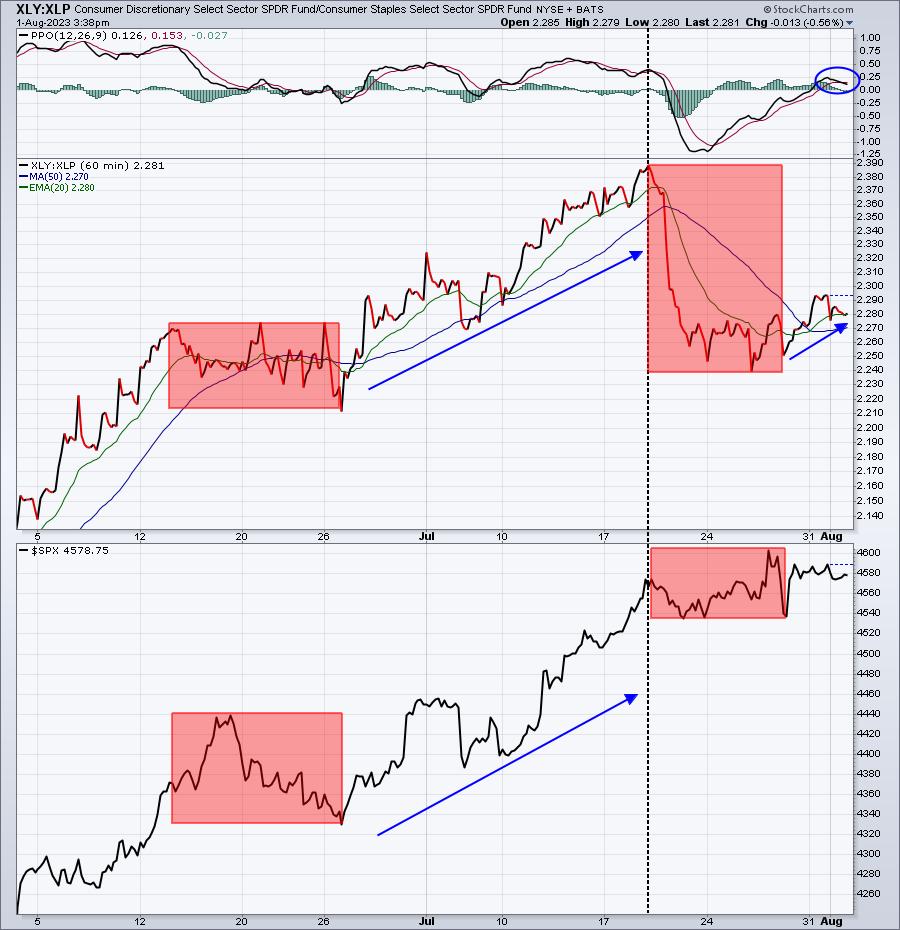
The S&P 500 tends to struggle when it's not being led by consumer discretionary. That's why seeing this XLY:XLP ratio begin to turn higher again, rising to roughly a 10-day high, is excellent news for the bulls. I'll be watching to see if it continues.
Sector/Industry Focus
Materials (XLB) have consolidated the past few days on the hourly chart and the good news is that it's been a bullish ascending triangle pattern:
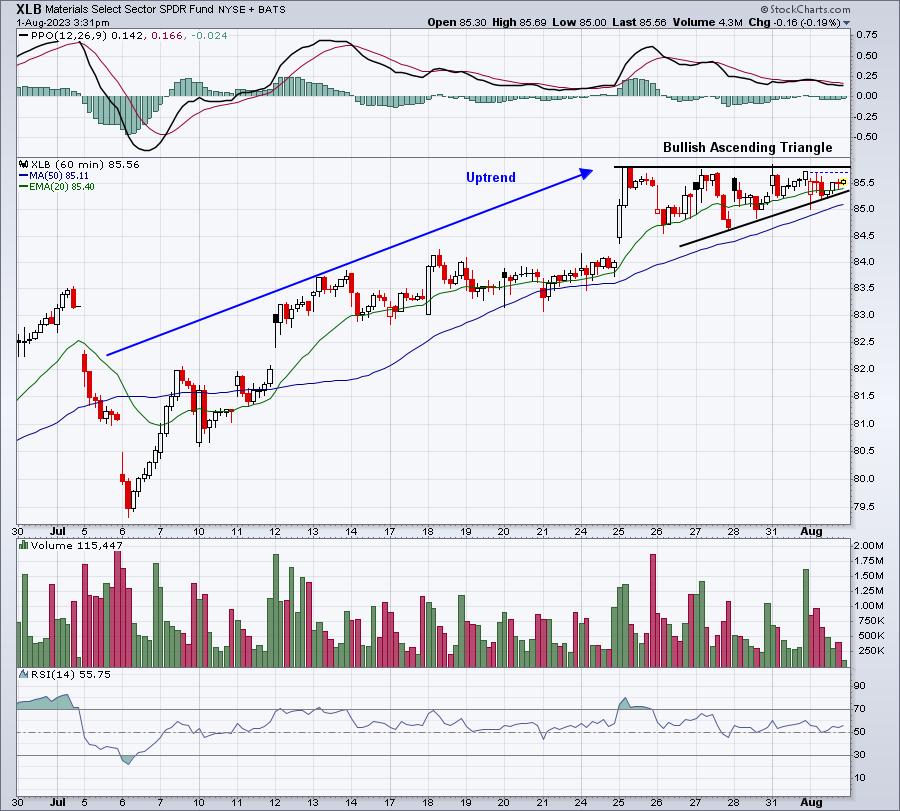
If we execute the pattern with a breakout, the initial measurement would take the XLB up to around 87.25-87.50, another 2-3% or so from the current price level.
ChartLists/Strategies
I don't have the updated Raised Guidance ChartList (RGCL) available for everyone, but should have it done later today. In looking at the stocks that have been added, however, here is one that looked very interesting to me:
SEM:
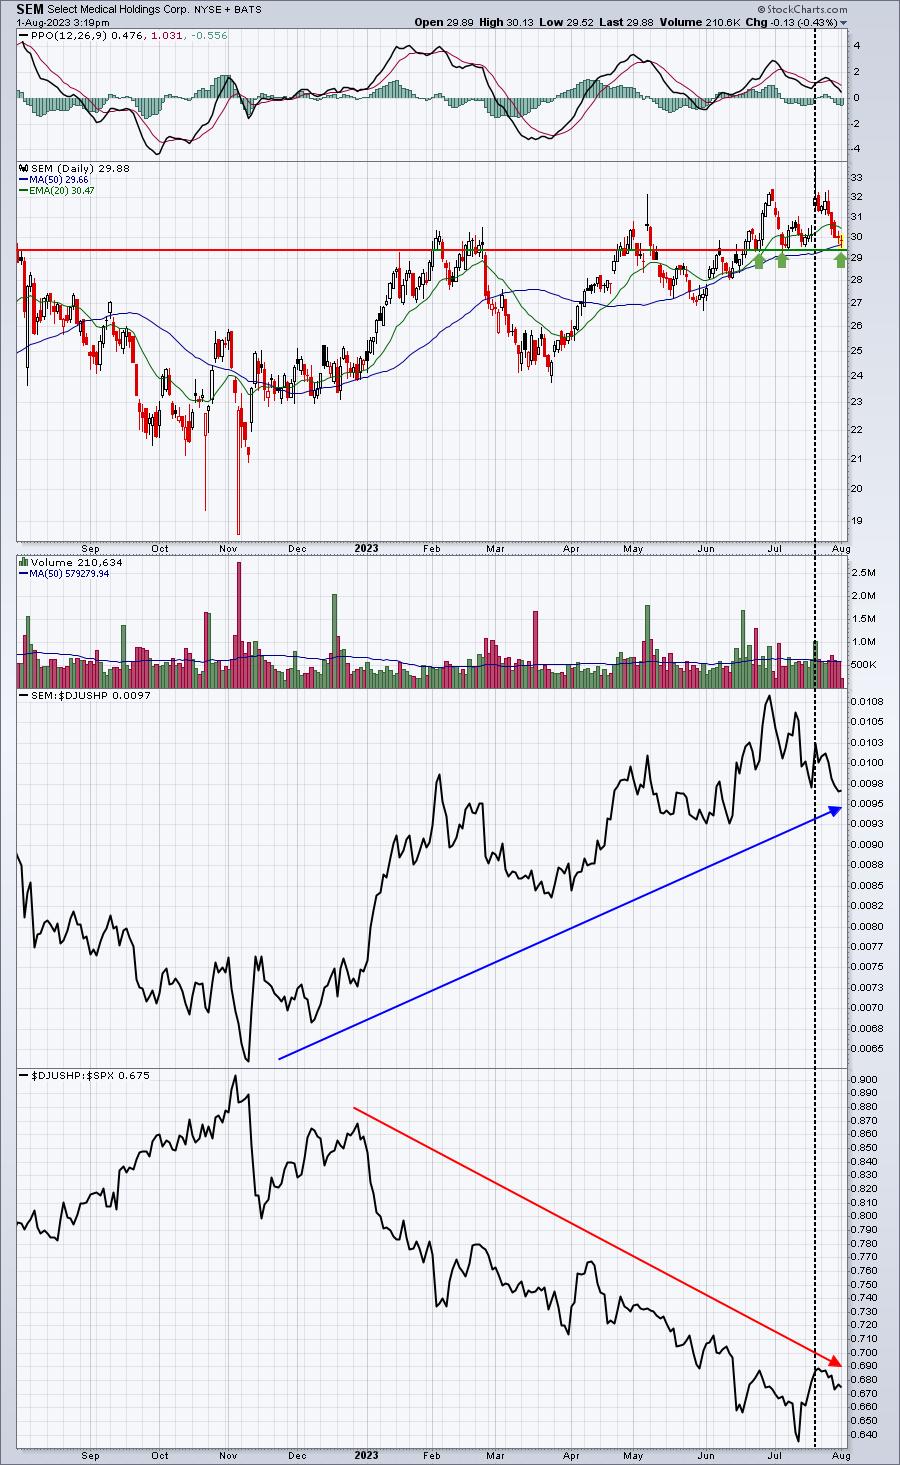
Is the glass half-full (excellent relative strength vs. its health care provider peers) or is it half-empty (poor relative industry strength vs. the benchmark S&P 500)? Here's what I like: SEM raised its guidance two weeks ago, gapped higher, and ripped to a 52-week high.....INTRADAY. But the rally didn't stick and we ended up with a false breakout. Now, SEM is back to the price support BEFORE the raised guidance announcement was made. I bought it today and will likely sell it if it closes below 29.00. I believe we'll see a rally back to 32.00-32.50 after its earnings are released on Thursday, 8/3, after the market close. This one is absolutely more of a gamble, because I've bought it AHEAD of its earnings report. We'll see if it works out.
Earnings Reports
Here are the key earnings reports for the next two days, featuring stocks with market caps of more than $10 billion. I also include notable companies with market caps below $10 billion. Finally, any portfolio stocks that will be reporting results are highlighted in BOLD. If you decide to hold a stock into earnings, please understand the significant short-term risk that you are taking. Please be sure to check for earnings dates for any companies that you own or are considering owning.
Tuesday, August 1:
MRK, PFE, AMD, CAT, SBUX, BP, UBER, VRTX, MO, ETN, ITW, MAR, MPC, ECL, PXD, IDXX, AIG, AFL, IQV, SYY, ROK, EA, AME, MPLX, PRU, DVN, PEG, ARES, ALL, ZBH, WEC, GPN, IT, STE, FE, PAYC, HWM, SIRI, PINS, EXAS, OWL, RVTY, ZBRA, SWK, TAP, WSO, INCY, SEDG, MOS, LDOS, CZR, MTCH, PEN, AZPN, CHK, BXP, SCI, NBIX, UNM, ALGM, NCLH, LEA, TX, INSP, IGT, ELF, MSTR, FRSH, SFM, TEX, OI, CVLT, JBLU, BLMN, KMT, SSTK, TGH, SPWR, NUS, SPCE
Wednesday, August 2:
QCOM, CVS, SHOP, PYPL, EQIX, MELI, TRI, HUM, OXY, MCK, EMR, PSX, PSA, MET, JCI, TT, KHC, ET, WMB, EXC, O, SPG, YUM, ABC, WCN, SGEN, DD, FIS, DASH, VRSK, NTR, CTSH, ANSS, HUBS, IR, CDW, ALB, AEE, ETR, FICO, FTS, XYL, GRMN, MKL, CLX, MGM, BLDR, ATO, U, WAT, BG, MRO, DT, CF, CCJ, HST, CG, APA, ZG, ETSY, FMC, GXO, CHRW, TPL, HOOD, UTHR, NI, DOX, CDAY, BWA, QRVO, AFG, PCOR, EQH, CFLT, SRPT, RGEN, TEVA, GNRC, CLH, RGLD, MKSI, MUSA, ACLS, ATI, KGC, LPX, WING, LNC, SUN, GT, DRVN, ADNT, SMG, RUN, EXTR, NOG, RELY, SPR, FROG, FORM, BOOT, FTDR, SITM, STAA, SHOOO, TRIP, ALGT, FSLY, NUVA, QTWO, SAVE, CAKE, MOD, CRTO, VCEL, HLF, PERI, CSGS, KN, LMND, PLMR, RVLV, XHR, CNXN, DNOW, ADPT, EVGO
Economic Reports
July PMI manufacturing index: 49.0 (actual) vs. 49.0 (estimate)
July ISM manufacturing index: 46.4 (actual) vs. 46.5 (estimate)
June construction spending: +0.5% (actual) vs. +0.6% (estimate)
Happy trading!
Tom