
EB Daily Market Report - Friday, August 4, 2023
Executive Market Summary
- Futures were mostly higher overnight as traders awaited the July jobs report
- Nonfarm payrolls were slightly below expectations, while the unemployment rate dipped; average hourly earnings were slightly above expectations
- We've seen a roller coaster ride type of day, but we are finishing on the weaker side, not a great sign for the start of next week
- Intraday market behavior continues to favor defensive areas over aggressive areas and small caps over large caps (IWM:QQQ)
- Crude oil prices ($WTIC, +1.40%) are back up to and challenging $83 per barrel; that has energy (XLE, +0.31%) as the only positive sector other than the Amazon.com (AMZN, +8.61%) led consumer discretionary (XLY, +1.48%)
- The action in the 10-year treasury yield ($TNX) represents a bearish engulfing candle and it's dropped 13 basis points back to 4.06%; this looks like a short-term top, possibly even intermediate-term top
- Booking Holdings (BKNG, +7.28%) is trailing AMZN today, but also has seen a very positive response to its earnings report
- Apple, Inc. (AAPL, -4.56%), on the other hand, has fallen beneath its 50-day SMA for the first time since January 2023 after disappointing Wall Street with its quarterly results and outlook
Market Outlook
It's been a wild day in the market. It opened higher, quickly sold off into negative territory, then rallied nonstop for 3 hours, clearing yesterday's high, and then gave back all of those gains between 1-3pm ET. Now we head into the final hour and I'm not quite sure where we'll end. However, I prefer buying into weakness rather than chasing strength. Today is the perfect illustration of why. Let's take a close look at the S&P 500 over the past few weeks (since options expiration week) and include several key ratios, but first look at it from a longer-term daily perspective:
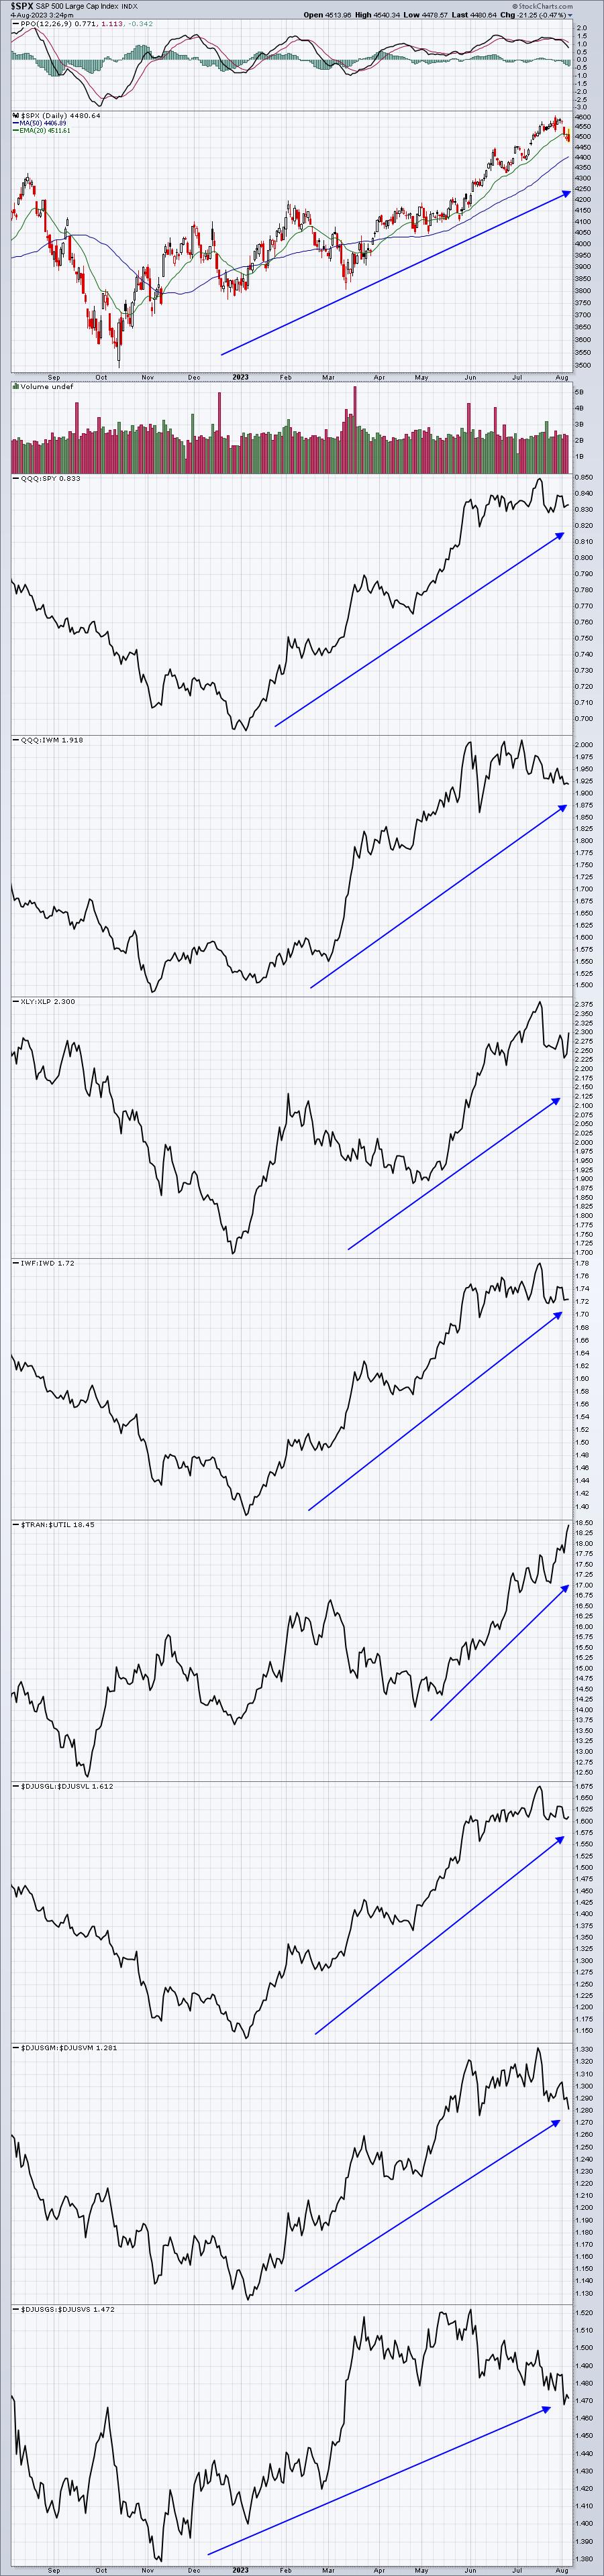
Not every ratio goes up to the same degree or at the same time, but it's fairly clear to see that they all do move up during a bullish trend higher. Keeping this in mind, let's look at what's transpired more recently on an hourly chart:
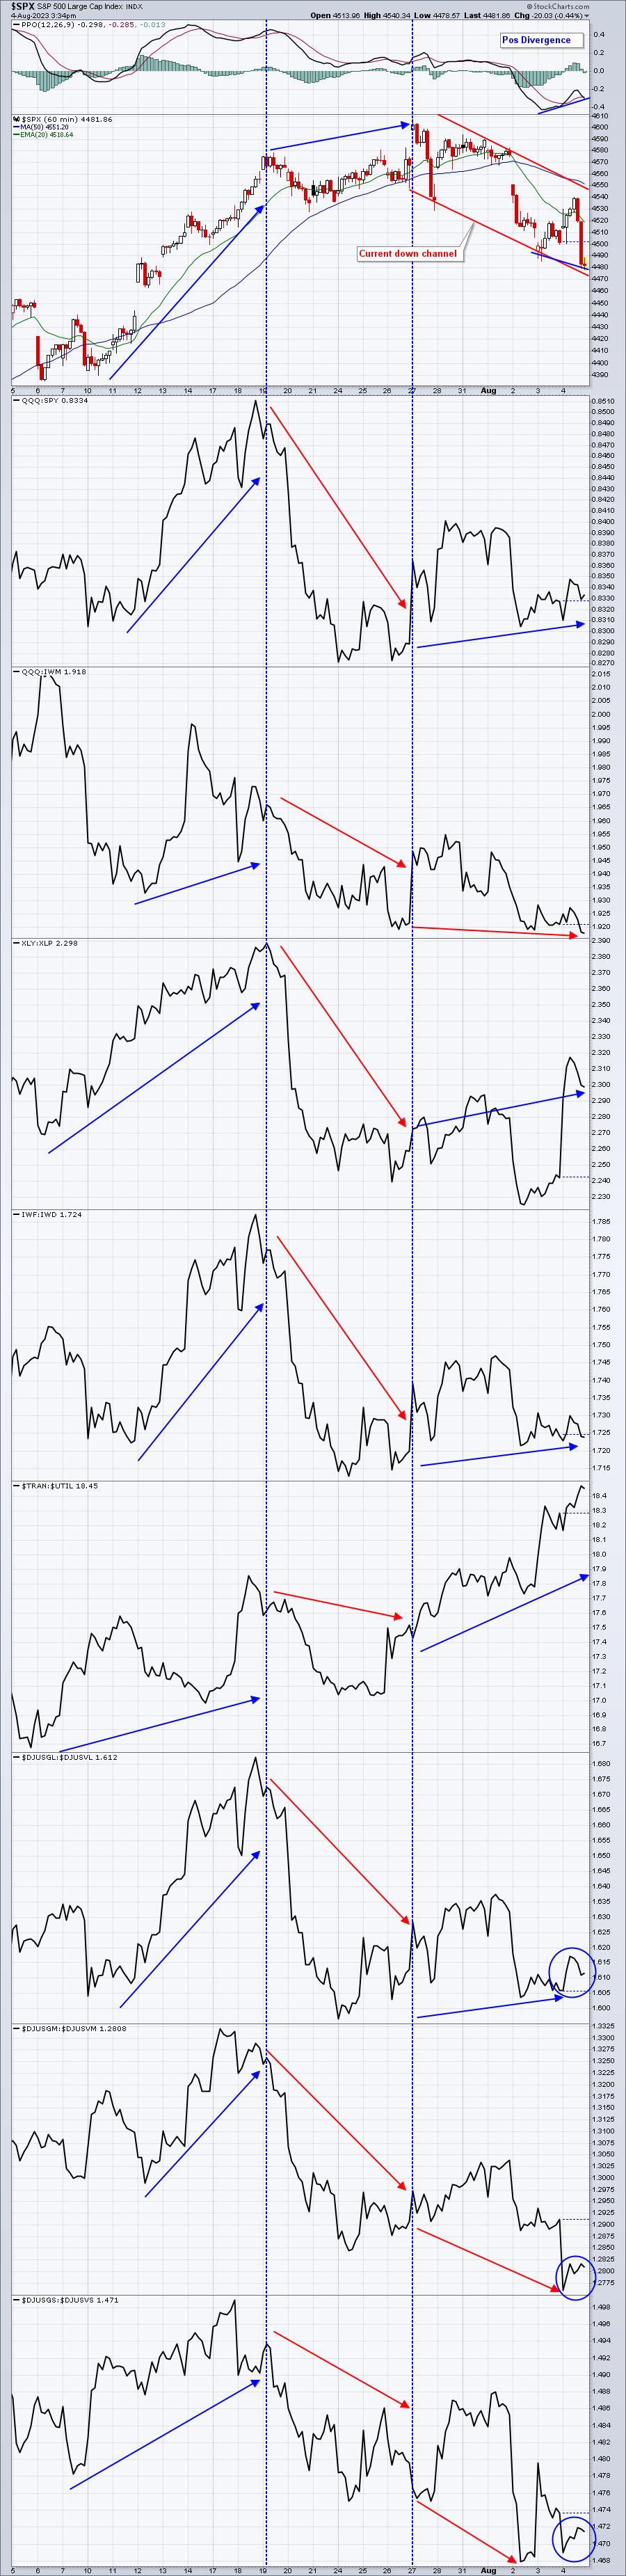
Couple things here. First, there's now a positive divergence as price has moved lower on the hourly chart, while the PPO is printing a higher low. But the purpose of this chart is to show you the 3 stages of market strength. The first shows the first three weeks of July. The S&P 500 is storming higher and most of these ratios are supporting the rally. But notice when the next high hits a week later? The ratios are all turning lower, suggesting the rally is not as likely to be sustained. And, in fact, we've seen the most weakness and selling of any recent period. Right now, we appear to be in a market where signals are getting mixed - some say we could go lower, while others say we're bottoming. The daily chart still shows a possible trip to the rising 50-day SMA on the S&P 500 and the NASDAQ.
I believe the best course of action is buy this weakness. I think the odds are greater that we'll see a rebound fairly soon. We might have another 3-4% downside, but I doubt we'll see much more than that. And there's a case building that we won't get there. I like the DIA, SPY, QQQ, and IWM moving forward on the long side. The obvious question is how much further might we drop short-term and, unfortunately, I don't have that answer. I can say that I have been buying the IWM via the leveraged 3x ETF, TNA. I have one final entry into the TNA close to 38.25. I'm banking on the IWM holding above its 20-day EMA on a closing basis. If it doesn't, I'll sell my TNA and try to figure out the best place to re-enter. But I am NOT assuming the IWM breaks below its 20-day EMA. Current technical conditions do not support that.
Sector/Industry Focus
The widely-diversified XBI (biotech ETF) is back at key price support, which means trading LABU, the leveraged 3x ETF that generally tracks the XBI could make some sense here. Personally, I prefer to trade areas of the market performing well and biotechs are essentially the opposite of that. But there also is the potential trade off price support, keeping a very tight stop in place. That's where I am with the XBI and LABU:
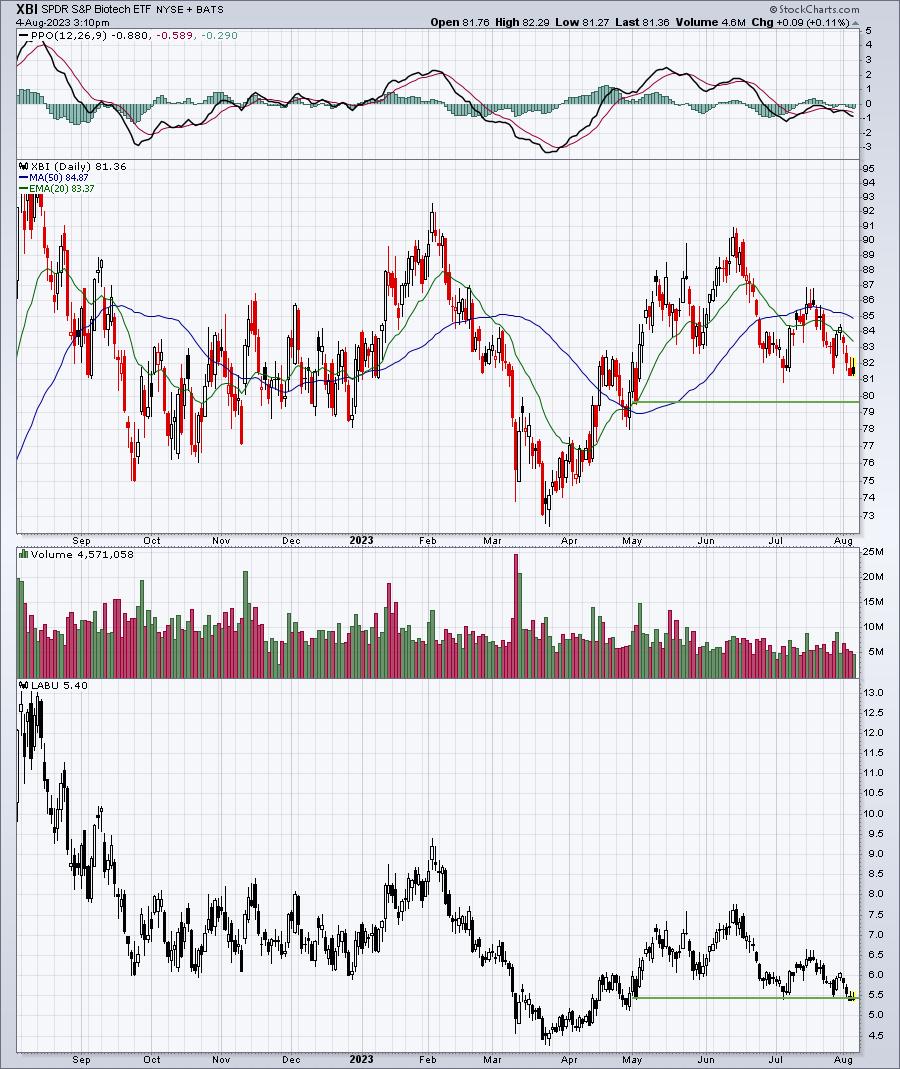
The XBI is touching its low from early July. If this support holds and the XBI bounces, LABU will follow suit. Look at the two green horizontal support lines I've drawn from the early-Map gap support level. The XBI is still well above gap support, but LABU is dipping below it. Erosion is a real thing with leveraged ETFs and it's exactly why I NEVER hold leveraged ETFs long-term. Personally, I think it's taking on much more risk and I try to manage risk effectively. Again, holding leveraged ETFs long-term is the OPPOSITE of that.
I opened a position in LABU today at roughly 5.43, but I'll take a 2-3% loss if it doesn't turn around quickly. I also have a much smaller position in LABU than I do in TNA (ETF that tracks IWM at a 3 to 1 clip).
ChartLists/Strategies
First, let me show you how I tried to trade Select Medical (SEM) today and why I RARELY like to use limit orders. I had looked at the chart and saw that price resistance was at 32.44, the opening price from June 30th. That was the high candle body and I use opens and closes for support/resistance, not intraday highs - just my personal preference. I decided to set my intraday sell at 31.99, just below the psychological 32 level and well below the 32.44 price resistance. Check this out:
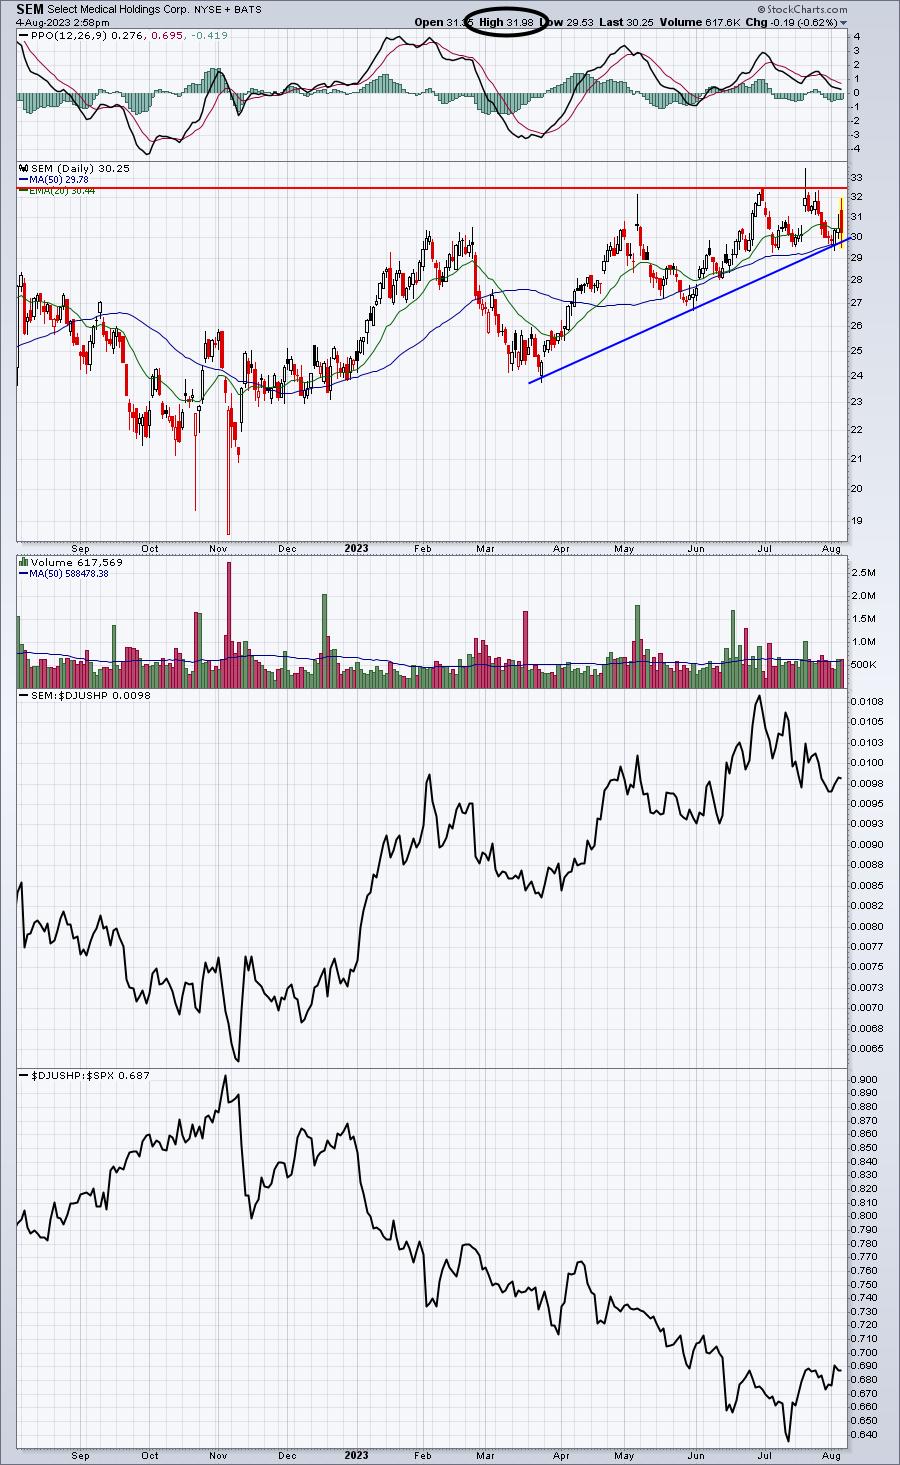
I circled the high of the day at 31.98, one penny (!!!) below my limit order. It always makes me wonder what would've happened if I had set my limit order at 31.97? Would it have filled or would the high of the day been at 31.96? It wasn't a lot of shares and volume was fairly light in the first 15-20 minutes of SEM trading this morning, so I'm sure market manipulation played a role. This isn't the first time it's happened to me. In fact, it's happened much more often than I'd care to remember. After hitting 31.98, SEM promptly fell to 29.53 over the next 10-15 minutes. Talk about frustrating! Anyhow, I'm still in SEM and I've removed my limit order. Now I'll wait to sell over 32, if it gets back there. :-)
Earnings Reports
Here are the key earnings reports for the next two days, featuring stocks with market caps of more than $10 billion. I also include notable companies with market caps below $10 billion. Finally, any portfolio stocks that will be reporting results are highlighted in BOLD. If you decide to hold a stock into earnings, please understand the significant short-term risk that you are taking. Please be sure to check for earnings dates for any companies that you own or are considering owning.
Friday, August 4:
ENB D, LYB, TU, PPL, MGA, CBOE, EVRG, IEP, CRBG, PAA, XPO, BEPC, ESNT, FLR, GTES, FSR, VGR, CNK, OMI, TWST, FLGT, AXL
Monday, August 7:
KKR, PLTR, OKE, BNTX, IFF, CTRA, TSN, SWKS, CE, LCID, VTRS, ACM, WTRG, HSIC, PARA, SWAV, PRI, FIVN, ELAN, FSK, TDC, RNG, FRPT, AYX, GOGO, CHGG, BYND
Economic Reports
July nonfarm payrolls: 187,000 (actual) vs. 200,000 (estimate)
July private payrolls: 172,000 (actual) vs. 175,000 (estimate)
July unemployment rate: 3.5% (actual) vs. +3.6% (estimate)
July average hourly earnings: +0.4% (actual) vs. +0.3% (estimate)
Happy trading!
Tom