
EB Daily Market Report - Friday, August 11, 2023
ChartLists Updated
I've updated two ChartLists today as follows:
- Strong Earnings ChartList (SECL)
- Strong Future Earnings ChartList (SFECL)
Both should be available on our website later today.
I'm continuing to update the Raised Guidance ChartList (RGCL) and should have this one complete, along with the Bullish Trifecta ChartList (BTCL), over the weekend sometime. I'm waiting on data to update the Short Squeeze ChartList (SSCL).
Have a great weekend!
Executive Market Summary
- Futures were higher overnight, but turned mixed after Friday's July PPI report showed that inflation came in a tad higher than expected
- July PPI, both headline and core, rose +0.3%, slightly above +0.2% expectations
- The 10-year treasury yield ($TNX) is up 8 basis points to 4.16%, perhaps because of the higher-than-expected inflation data this morning
- Energy (XLE, +1.31%) is easily today's top-performing sector as crude oil prices ($WTIC, +0.95%) jump again
- The three aggressive sectors - technology (XLK, -0.84%), communication services (XLC, -0.63%), and consumer discretionary (XLY, -0.50%) - lag all other sectors once again
- Semiconductors ($DJUSSC, -2.70%) remain a drag on technology
- Copper ($COPPER, -1.47%) is in a very interesting triangle that's likely to resolve soon - see more information in Sector/Industry Focus below
Market Outlook
I want to show you another visual of how the small cap IWM is outperforming the large cap QQQ, just over the past 5 trading days. Below is a 5-day, 10-minute chart that plots both the IWM and QQQ. The QQQ continues to drift lower and lower, while the IWM is attempting to hold its ground:
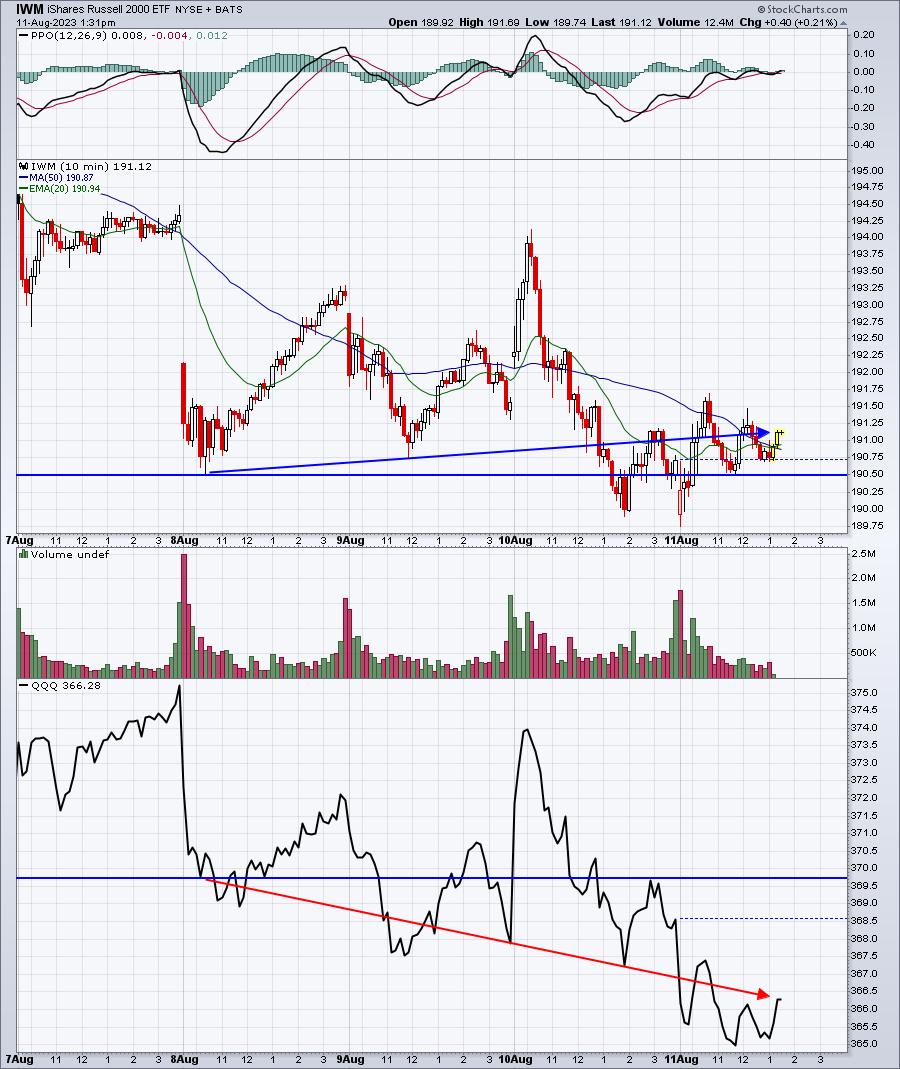
Listen, I can't guarantee any sort of outcome from all I've been discussing in recent weeks, particularly with regard to the small cap IWM. But I do a lot of research and I find this type of behavior meaningful. It's nothing we hear about in the media, but it certainly paints a different picture than all the bearish talk we constantly have to listen to.
Recently, I sent out the historical data on the S&P 500. The August Seasonality Report highlighted the historical weakness generally found from August 4th through August 10th (yesterday). In 2023, the weakness has actually been since the start of the month. But if history is any guide, we should see some relief over the next week. Here are the S&P 500 annualized return, by day, from August 11th through August 18th:
- August 11: +45.25%
- August 12: -0.44%
- August 13: +0.57%
- August 14: -3.58%
- August 15: +7.22%
- August 16: +23.72%
- August 17: +53.07%
The average of all the above days is 18.11%, which is roughly double what the S&P 500 averages annually over the past 70 years. Whether we see historical strength this year remains to be seen, but at least the historical tides usually turn this time of the month.
Sector/Industry Focus
Copper ($COPPER) is usually the first commodity that I look at as its long-term positive correlation with S&P 500 performance is fairly evident. Copper typically provides a much better gauge of global economic activity than either silver ($SILVER) or gold ($GOLD). Right now, however, COPPER is squeezing inside a symmetrical triangle. Which way will it break?
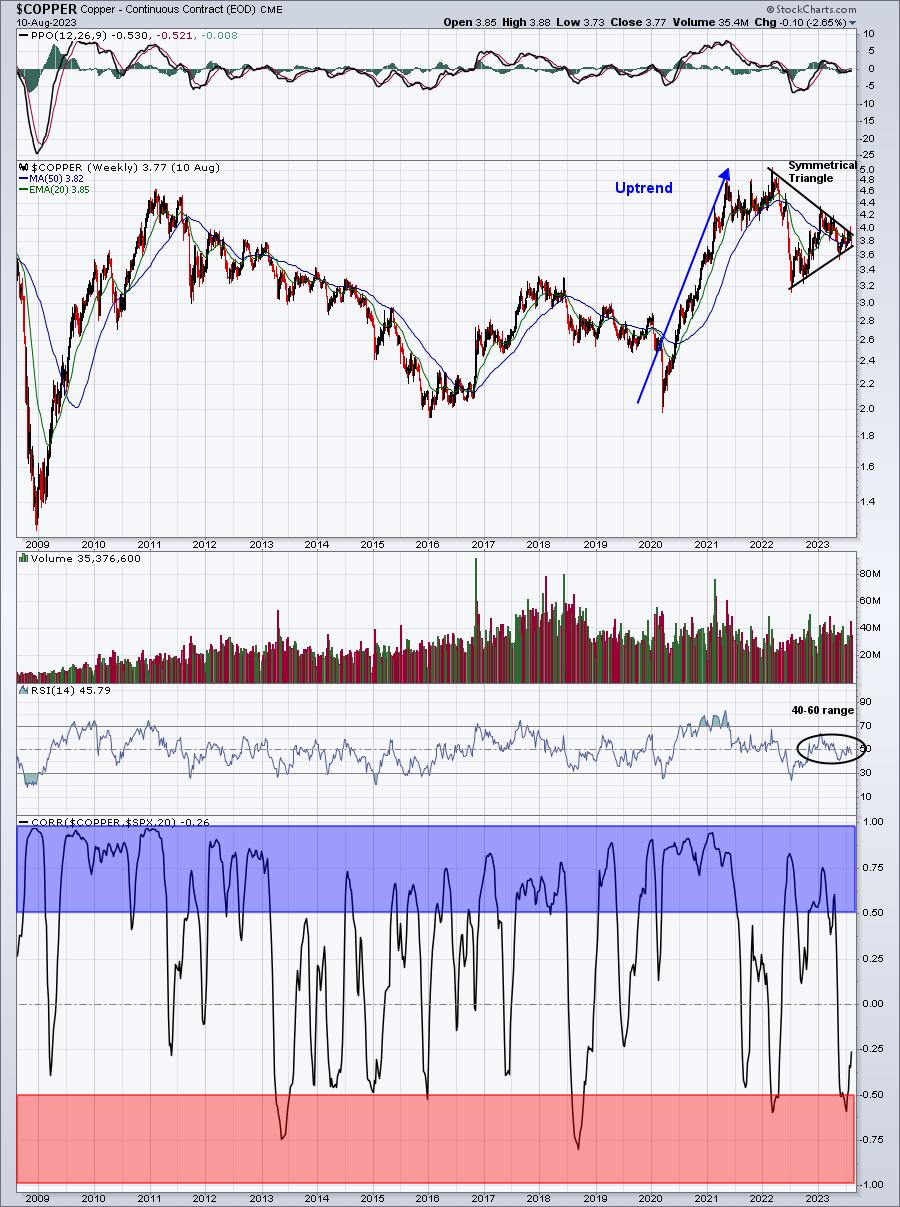
The blue-shaded area shows the positive correlation when it's above 0.50. The red-shaded area shows the negative, or inverse, correlation when it's below -0.50. From this chart, it's obvious to me that copper and the S&P 500 have a much stronger POSITIVE correlation. So a breakout of the symmetrical triangle to the upside, which is what's expected following an uptrend, would be a positive for the S&P 500. I'd keep an eye on this chart.
ChartLists/Strategies
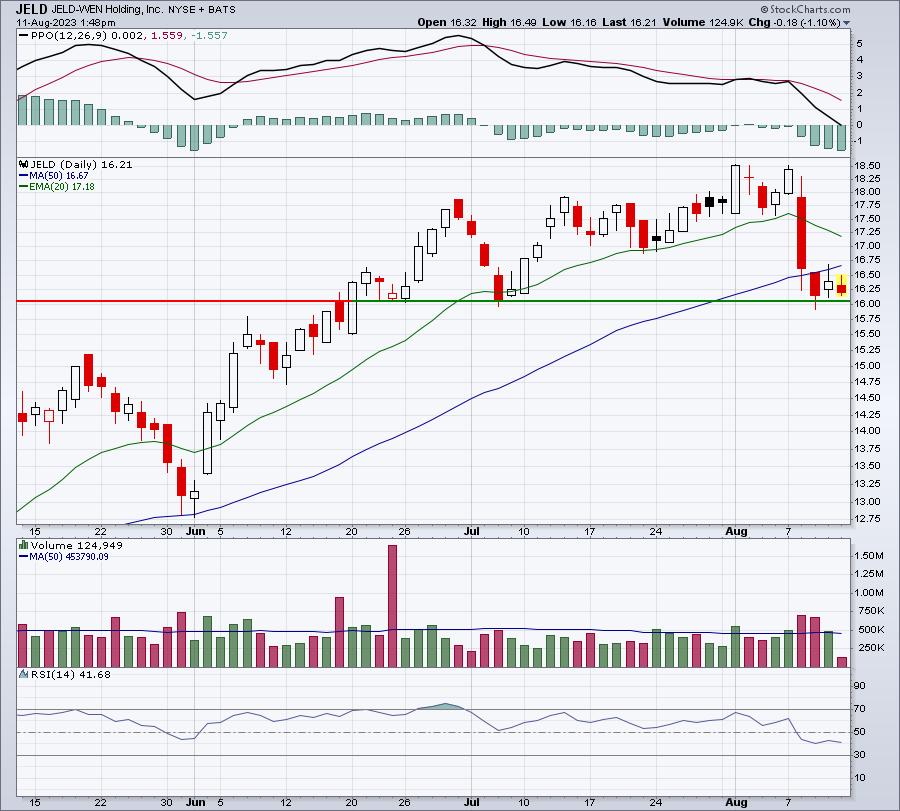
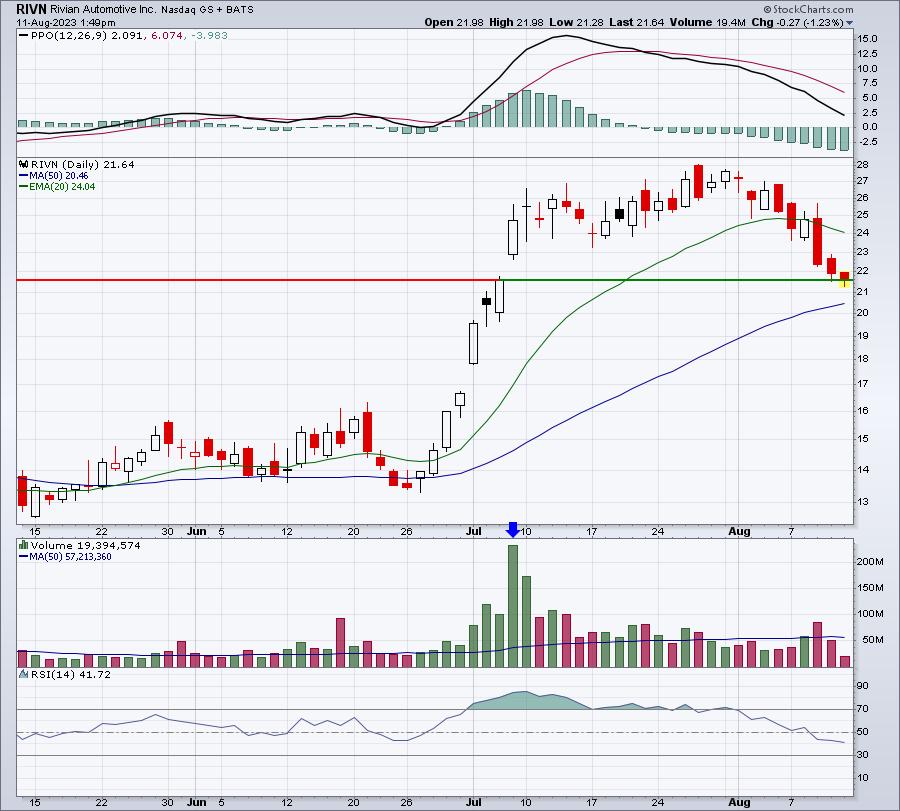
Here are a few stocks trading at or very close to key price/gap support:
JELD:
RIVN:
CRM:
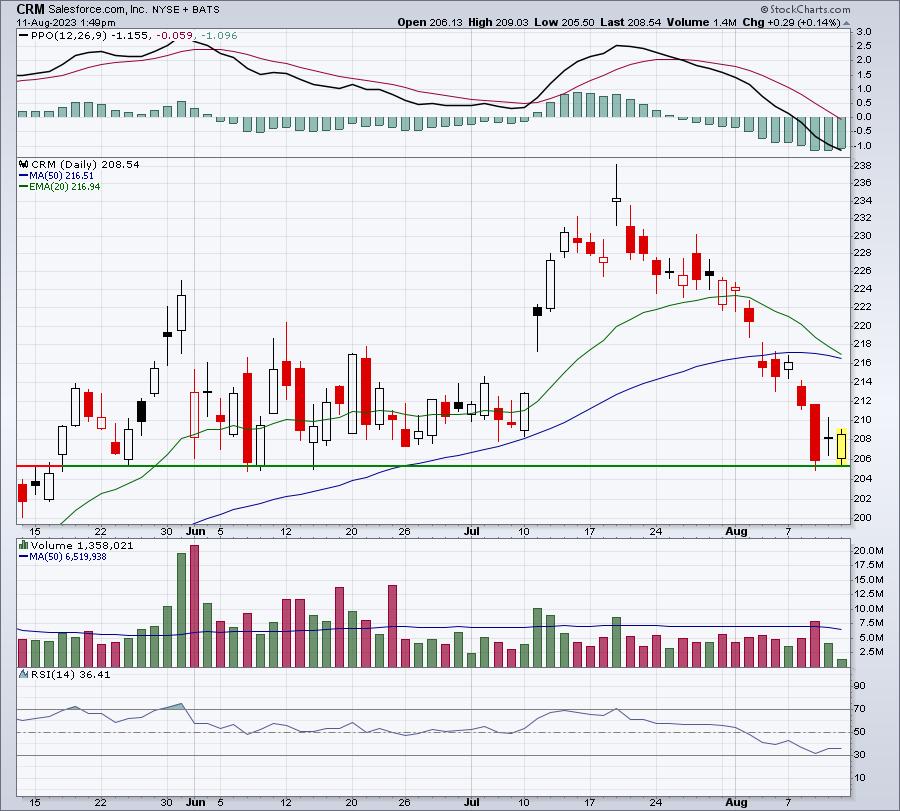
Buying at or near support, doesn't guarantee success, but it certainly helps to manage risk.
Earnings Reports
Here are the key earnings reports for the next two days, featuring stocks with market caps of more than $10 billion. I also include notable companies with market caps below $10 billion. Finally, any portfolio stocks that will be reporting results are highlighted in BOLD. If you decide to hold a stock into earnings, please understand the significant short-term risk that you are taking. Please be sure to check for earnings dates for any companies that you own or are considering owning.
Friday, August 11:
SPB
Monday, August 14:
SU, ROIV, MNDY, ERJ, JKS, NVTS
Economic Reports
July PPI: +0.3% (actual) vs. +0.2% (estimate)
July Core PPI: +0.3% (actual) vs. +0.2% (estimate)
August consumer sentiment: 71.2 (actual) vs. 71.3 (estimate)
Happy trading!
Tom