
EB Daily Market Report - Tuesday, August 15, 2023
Max Pain
We will not host a max pain webinar this month, but will plan to host one next month. As it turns out, there's very little net in-the-money call or put premium to discuss this month anyhow. The typical historical behavior is to see stock prices rise into options expiration week, leaving quite a bit of net in-the-money call premium. That's very likely the reason why stocks struggle around options-expiration Friday and into the following week. Market makers manipulate prices lower to eliminate call premium.
Erin Webber sent out the August Max Pain Report over the weekend, so you can check out many individual stocks and their related net in-the-money call/put premium. There's little incentive for market makers to manipulate prices this month, so prices could gravitate either way - at least from a market maker perspective.
ChartLists Updated
I've updated three ChartLists, which have also been updated on our website:
- Raised Guidance ChartList (RGCL)
- Bullish Trifecta ChartList (BTCL)
- Short Squeeze ChartList (SSCL)
Executive Market Summary
- Futures turned lower overnight and we had another rough morning session
- We've seen mostly sideways action after reaching morning lows
- All 11 sectors are lower, led by the recently-hot energy sector (XLE, -1.78%)
- Despite downward pressure, two aggressive sectors - communication services (XLC, -0.64%) and technology (XLK, -0.64%) - are showing relative strength
- Today's top sector is health care (XLV, -0.24%), led by pharmaceuticals ($DJUSPR, +0.16%)
- Commodities are lower across the board, with crude oil prices ($WTIC, -1.84%) falling to $81 per barrel, just above its 20-day EMA
- The 10-year treasury yield ($TNX) surged to 4.27% this morning after July retail sales came in higher than expected, more than doubling expectations if we strip out autos
- Amgen (AMGN, +1.77%) continued its torrid advance and was the only Dow Jones component stock to gain more than 1% today
Market Outlook
Consumer spending represents roughly two-thirds of GDP, which is why I follow the XLY:XLP ratio so closely. I want to show you an intraday chart of the XLY:XLP since the beginning of August. We know that the market has been weak, but this relationship hasn't really changed much:
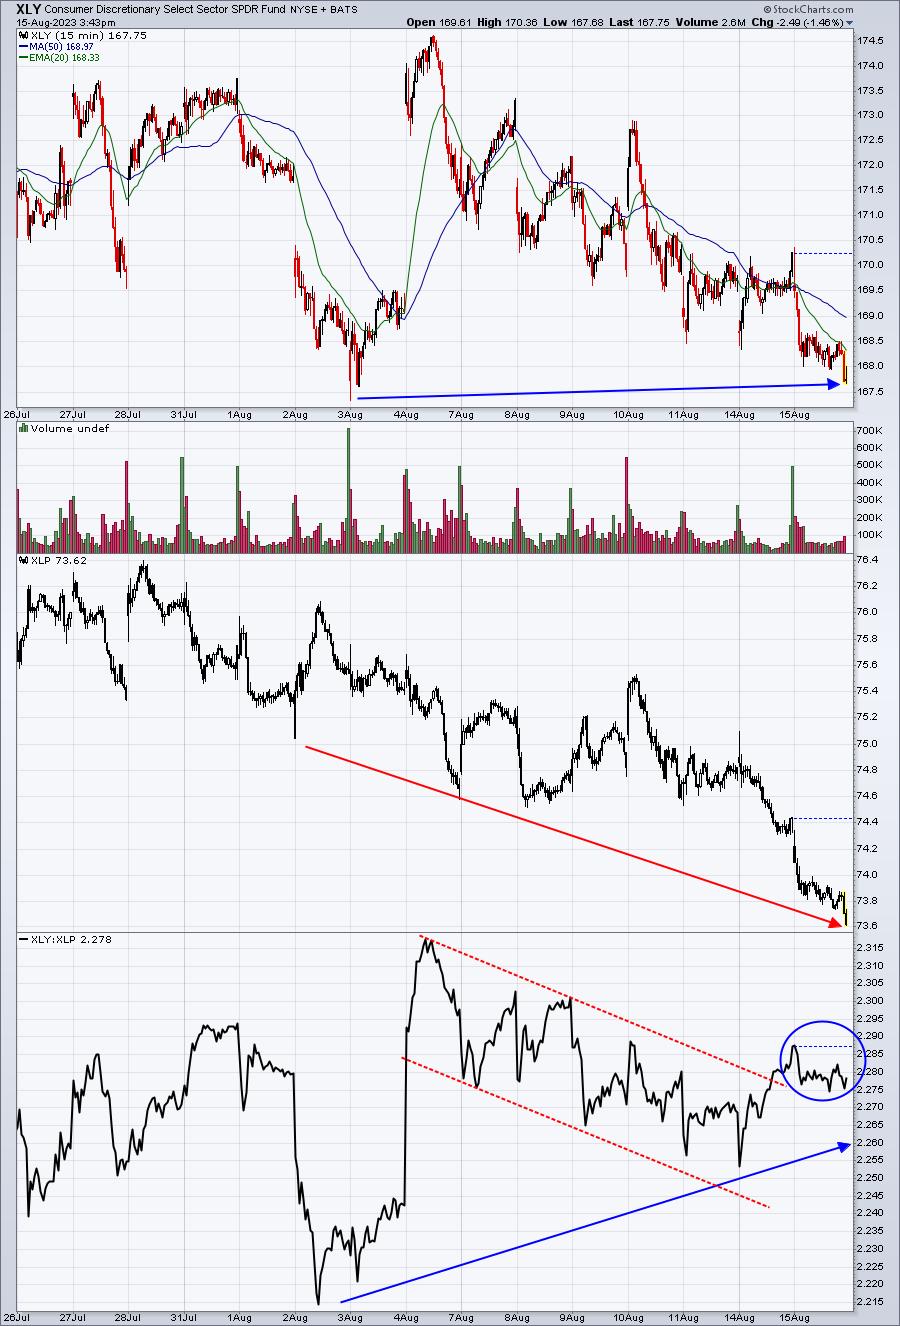
The market continues to struggle today, but few of my signals support prices falling in the weeks ahead. The XLY vs. XLP relationship has been a very important relationship throughout this century. Money is not pouring into the defensive staples area, which it should be if Wall Street firms were looking at big selling ahead in the overall market. You'd want to park your money in defensive sectors. But the XLY:XLP ratio is MUCH stronger today than it was at the beginning of August.
Sector/Industry Focus
You should know by now that I love watching sentiment on a regular basis. One of the reasons I felt we could see a period of consolidation last month was because the 5-day moving average of the equity-only put-call ratio ($CPCE) has reached its lowest level in more than a year, suggesting that a short-term top was near. Well, during this selloff, the 5-day moving average of the CPCE has moved above .70 and could hit the .75-.80 range where we usually see market bottoms. Check this out:
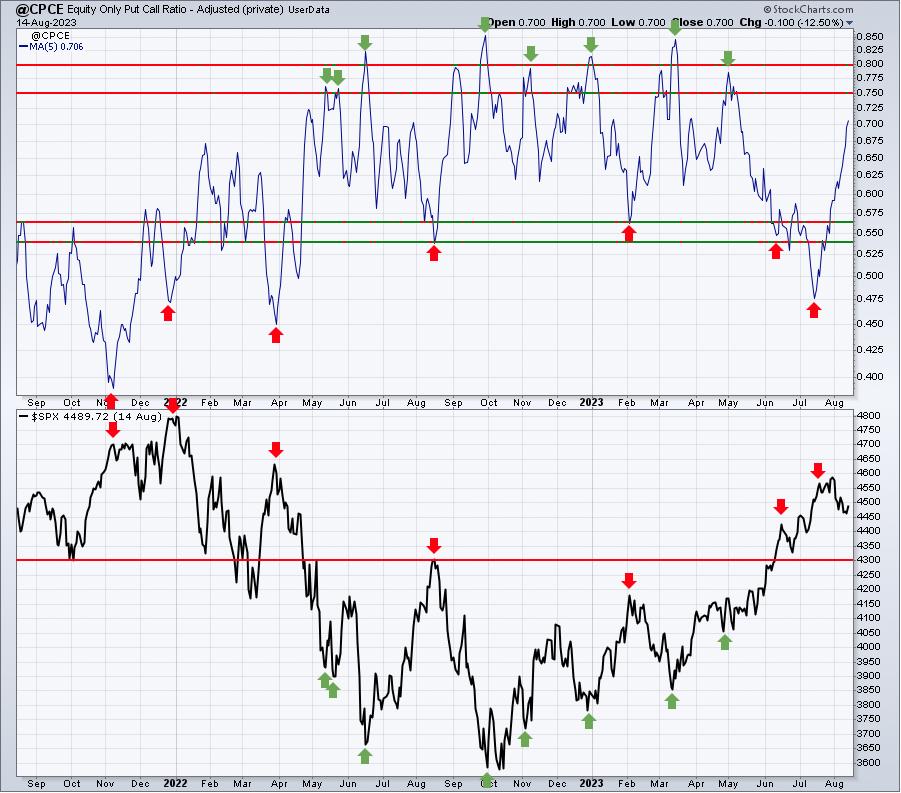
The CPCE is going to be high today, based on what I'm seeing at the CBOE.com intraday. We could very well get a CPCE sentiment buy signal as early as today's close. It's very important to realize where sentiment is at all times.
The above chart shows us repeatedly that when the CPCE 5-day moving average reaches .75, we should expect a market reversal back to the upside. We could be there at today's close. Let's see what happens over the next few days to couple weeks.
ChartLists/Strategies
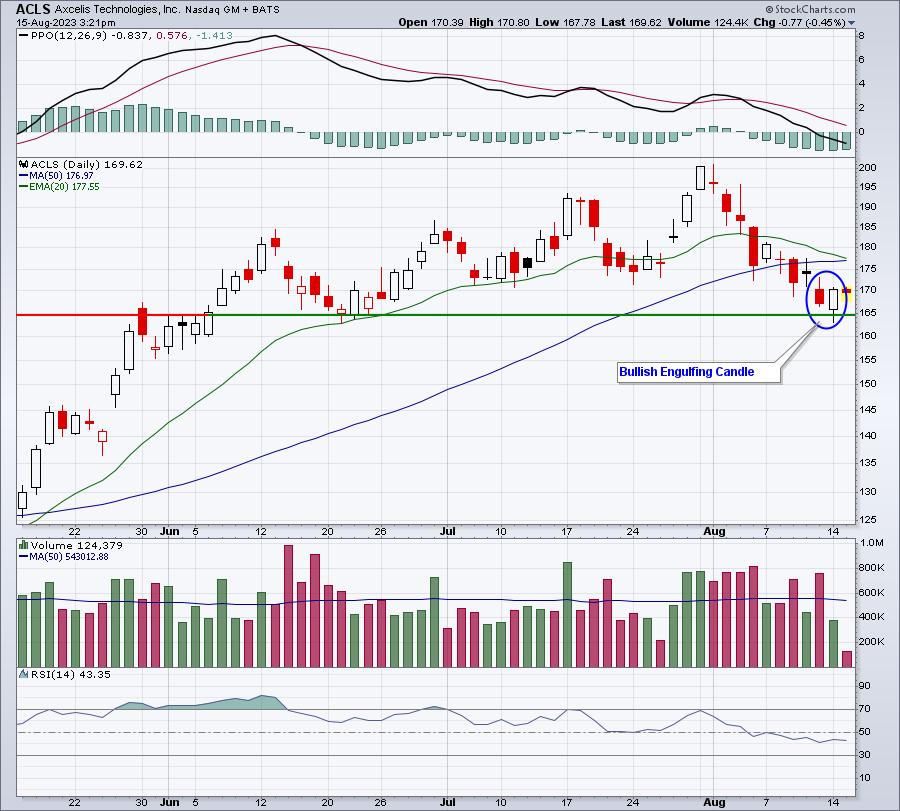
After a lengthy decline like the one we've been in, I like to look at our Downtrend Reversal scan to begin spotting stocks that are showing reversals. Here are my 2 favorites from today's scan:
ACLS:
GENI:
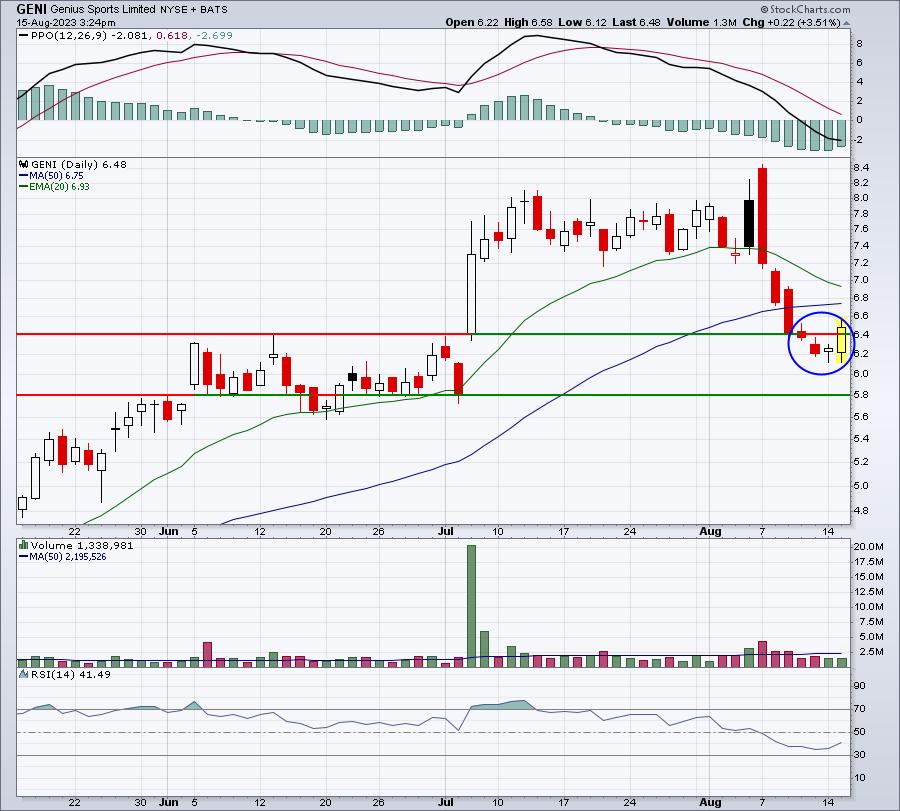
ACLS is on both our Strong Earnings ChartList (SECL) and Raised Guidance ChartList (RGCL), so I'd give the edge to that one. But GENI beat its revenue estimate, fell only a penny shy of its EPS estimate, then raised guidance. As a small $6 stock, GENI is the higher risk trade.
When the overall market does reverse back to the upside, the Downtrend Reversal scan could be your best friend. I'd run it every day, looking for solid trade candidates that have been beaten up in the short-term.
Earnings Reports
Here are the key earnings reports for the next two days, featuring stocks with market caps of more than $10 billion. I also include notable companies with market caps below $10 billion. Finally, any portfolio stocks that will be reporting results are highlighted in BOLD. If you decide to hold a stock into earnings, please understand the significant short-term risk that you are taking. Please be sure to check for earnings dates for any companies that you own or are considering owning.
Tuesday, August 15:
HD, ALC, A, NU, SE, CAH, ONON, JKHY, LEGN, TME, ESLT, COHR, HRB, MRCY, LRN
Wednesday, August 16:
CSCO, TJX, SNPS, TGT, JD, SQM, AMCR, PFGC, WOLF, STNE, AVT, EAT
Economic Reports
July retail sales: +0.7% (actual) vs. +0.4% (estimate)
July retail sales less autos: +1.0% (actual) vs. +0.4% (estimate)
August empire state manufacturing index: -19.0 (actual) vs. -0.4 (estimate)
June business inventories: +0.0% (actual) vs. +0.2% (estimate)
August housing market index: 50 (actual) vs. 56 (estimate)
Happy trading!
Tom