
EB Daily Market Report - Wednesday, August 16, 2023
Executive Market Summary
- Futures started a little weak, moved into positive territory early, but has since seen a lot of selling
- The 10-year treasury yield ($TNX) has climbed another 4 basis points and now resides at 4.26%, just 7 basis points from the 4.33% high established in October 2022
- Volatility ($VIX, +1.76%) is on the move higher again and now at 16.75; it's been mired in a trading range from 14.50-18.00 most of August
- Utilities (XLU, +0.48%) is the only sector gaining ground today; meanwhile, real estate (XLRE, -1.25%) is leading to the downside
- Apparel retailers ($DJUSRA, +2.97%) is notably strong today, approaching a key resistance level established in February 2023
- Commodities are again taking a hit mostly across the board as crude oil ($WTIC, -2.16%) falls back below $80 per barrel
- The FOMC minutes were released this afternoon and showed the Fed remains concerned about inflation - not great news for those believing we could have seen our last rate hike (like me)
Market Outlook
Yesterday, I highlighted the 5-day moving average of the equity only put call ratio ($CPCE). The only problem with the chart I showed is that I compared sentiment in a 2023 secular bull market advance with the 2022 action, which was anything but a secular bull market advance. So today, I wanted to highlight a period where we saw prices consistently rise with temporary pullbacks along the way, because that's what I believe we're enduring right now.
Check out this S&P 500 chart from 2016 through 2019 and, specifically, how the S&P 500 reacted nearly every time the 5-day moving average rose into the .70-.80 range, or slightly above:
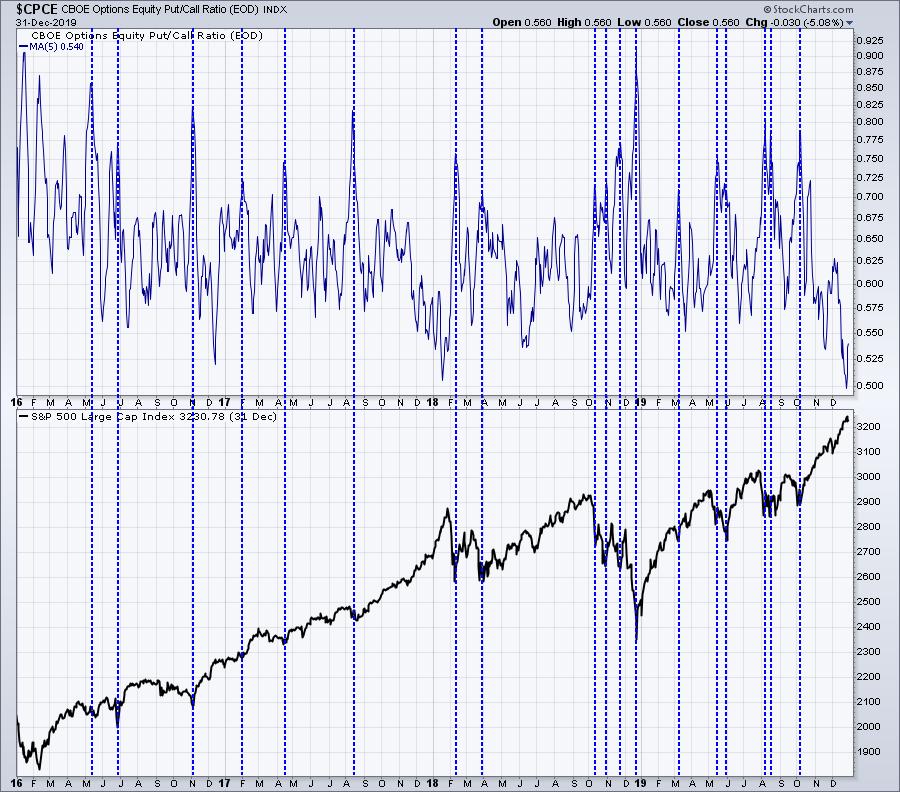
The blue-dotted vertical lines highlight each time the CPCE moved above .70. Currently, this 5-day moving average is at .73. Maybe we head to .80 before a bottom is found. Or perhaps this is the bottom. I know the CPCE was .68 5 days ago, so if today's CPCE ends up in the .75-.80 range, then the 5-day moving average will hit .75 for the first time since early May.
Note: Sentiment plus approaching 20-week EMA tests favor the bulls right now, but we need to see a reversal in this downtrend. I'll be back to just the IWM (and out of the TNA) at today's close. I certainly haven't given up on leveraged ETFs, but I want to lower my risk as the recent selling escalates. I'll likely move back to a TNA (leveraged) position if the IWM sees a bullish reversal.
Sector/Industry Focus
While our major indices have been weak this month, we have seen rotation lift up other areas. One such industry group is home improvements ($DJUSHI), which is threatening to clear a resistance range that's haunted the group on 5 different occasions over the past 16-17 months or so:
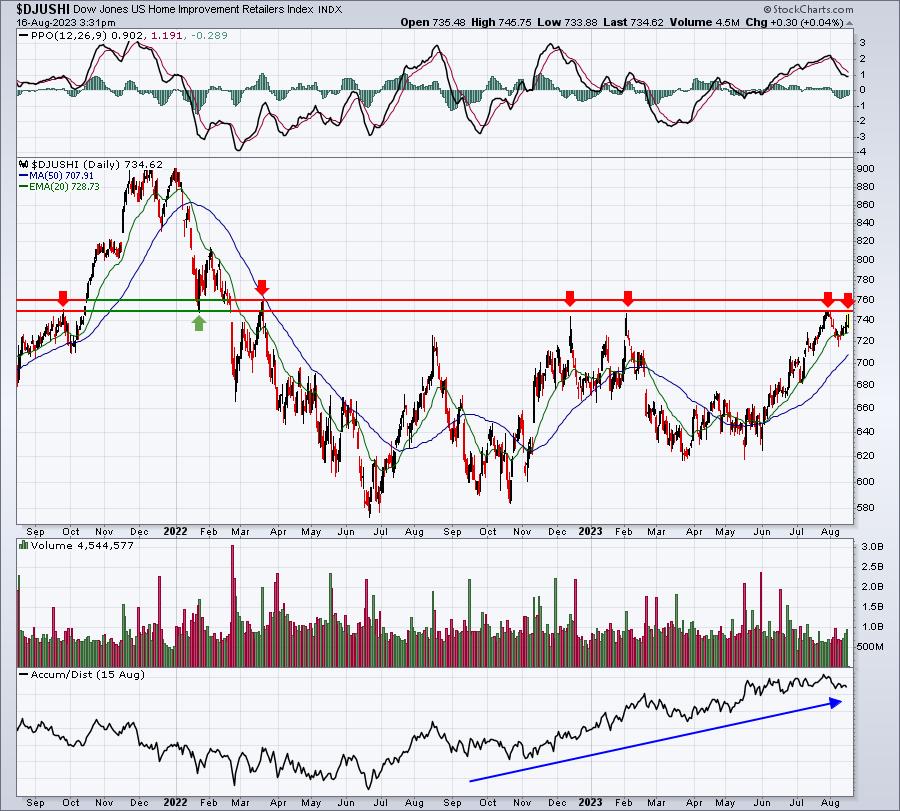
One consistency, however, has been the DJUSHI's AD line, which has steadily improved over the past year or more. I believe the rising AD line is quite meaningful as the DJUSHI tries to clear the 750-760 area. But a breakout isn't a breakout until it actually happens.
ChartLists/Strategies
During our Live Trading Room session this morning, I discussed our Downtrend Reversal scan, which identified 15 stocks on several of our key ChartLists (SECL, SFECL, RGCL, and SADCL) that had broken streaks of at least 5 consecutive trading days with lower daily highs. It doesn't mean that these stocks will soar, it's just a notification that these are stocks that could be reversing. I also discussed this scan in yesterday's DMR. Personally, I'll be running this scan every day. When our major indices ultimately bounce 5-10%, many of these individual stocks could see gains that double our major indices, possibly more.
I'm going to stick with ETF trading most of the next several weeks, but individual stocks could make sense for those willing to take on more risk in an attempt to produce higher reward.
Earnings Reports
Here are the key earnings reports for the next two days, featuring stocks with market caps of more than $10 billion. I also include notable companies with market caps below $10 billion. Finally, any portfolio stocks that will be reporting results are highlighted in BOLD. If you decide to hold a stock into earnings, please understand the significant short-term risk that you are taking. Please be sure to check for earnings dates for any companies that you own or are considering owning.
Wednesday, August 16:
CSCO, TJX, SNPS, TGT, JD, SQM, AMCR, PFGC, WOLF, STNE, AVT, EAT
Thursday, August 17:
WMT, AMAT, ROST, KEYS, NICE, BILL, TPR, GLOB, BILI, LITE, FTCH
Economic Reports
July housing starts: 1,452,000 (actual) vs. 1,455,000 (estimate)
July building permits: 1,442,000 (actual) vs. 1,464,000 (estimate)
July industrial production: +1.0% (actual) vs. +0.3% (estimate)
July capacity utilization: 79.3% (actual) vs. 79.1% (estimate)
FOMC minutes released at 2pm ET
Happy trading!
Tom