
EB Daily Market Report - Thursday, August 17, 2023
Executive Market Summary
- Futures showed some strength overnight, but selling resumed almost squarely on the opening bell
- Options are suggesting a reversal in stocks is rapidly approach, but the timing is difficult; prematurely calling the bottom can be very painful
- Economic reports today show the resiliency of the U.S., possibly the catalyst for the 10-year treasury yield ($TNX) rising another 5 basis points to 4.32%, effectively testing yield resistance of 4.33% from October 2022
- Crude oil ($WTIC, +1.64%) is rebounding today, jumping back near $81 per barrel
- Bitcoin ($BTCUSD, -4.35%) is tumbling today, breaking beneath recent price support around the 29000 level; other cryptos are falling by similar percentages
- Energy (XLE, +2.23%), buoyed by higher crude oil prices, is leading all sectors today
- The aggressive sectors (XLK, XLY, XLC) are hovering just above or just below the flat line, not yet receiving a full-on bullish endorsement
- If we see a big reversal today, especially in semiconductors ($DJUSSC), there's a potential bullish catalyst after today's close as Applied Materials (AMAT) reports its quarterly results
- The bearish argument could gain steam if the TNX clears 4.33% yield resistance
- As the Volatility Index ($VIX, +1.19%) rises, expect more volatility and whipsaw action; capitulation (big intraday selloff, followed by big afternoon buying) would be a great signal for the bulls near-term
Market Outlook
I am going to repost a 5-day moving average of the equity only put call ratio ($CPCE). Yesterday, I showed that, during a secular bull market advance, readings on the 5-day CPCE that hit the .70-.80 range have historically marked bottoms, sometimes significant bottoms. After yesterday's CPCE of 1.03, which, in my view, was only the second reading above 1.00 in 2023, the 5-day CPCE jumped to .80 I look to this chart as THE most important short-term sentiment chart and one of the most important charts for a trader - PERIOD:
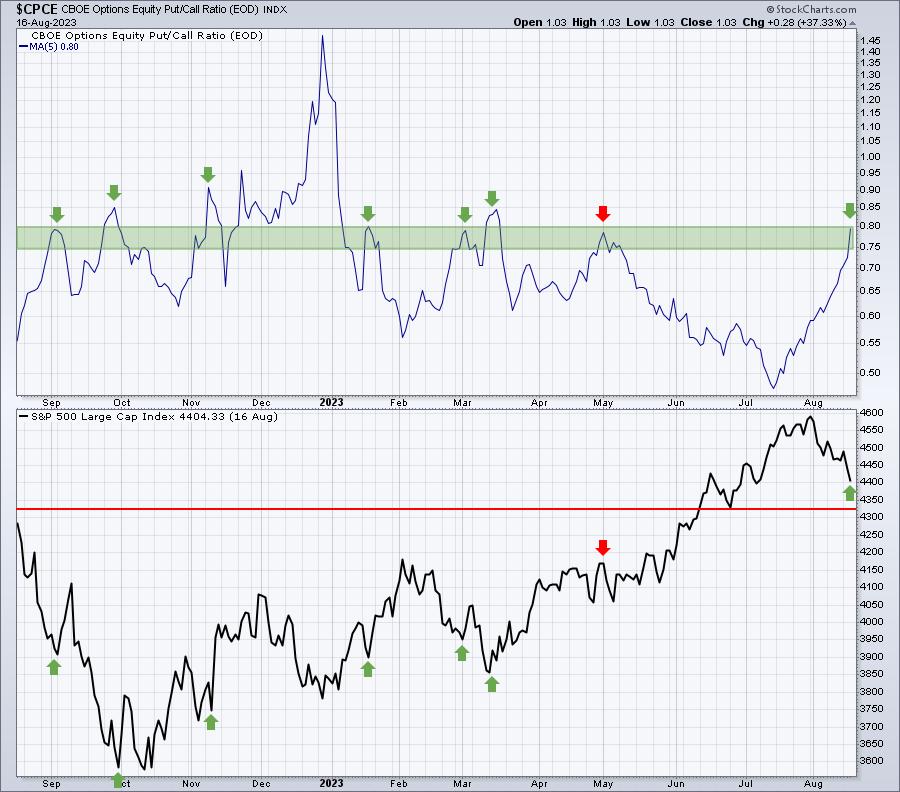
Is this signal perfect? Of course not, but it has a very strong track record over many, many years. The early-March signal worked, but only temporarily, and then we saw another low a couple weeks later - with another buy signal from the CPCE. The late-September/early-October signal, however, marked a MAJOR bottom. Both are possible here. I think it'll eventually mark a VERY important bottom this time as most all my indicators tell me we're going higher in Q4.
Personally, I exited all my TNA at yesterday's close and moved back to the IWM. Today I'm traveling and set limit orders to move a portion from the IWM to the TNA (slowly) as small caps fall further. The approaching 20-week EMA tests PLUS that CPCE reading of 1.03 are the primary reasons for re-entering. Previously, I was split 60% IWM and 40% TNA. This time, I'll likely move to 75% IWM and 25% TNA until I get a better sense that an uptrend is underway. At that point, I'll add to my position. That could happen at any time. Higher highs and higher lows in the IWM would be a very good start.
Sector/Industry Focus
One area to watch very, very closely is semiconductors ($DJUSSC). This group is always influential and it's difficult to imagine the market surging to all-time highs later this year or early next without the support of semiconductors. The current selling is taking the group towards its 20-week EMA, a very important support level on the longer-term weekly chart. Before I show the weekly chart, check out the daily chart and its current technical view:
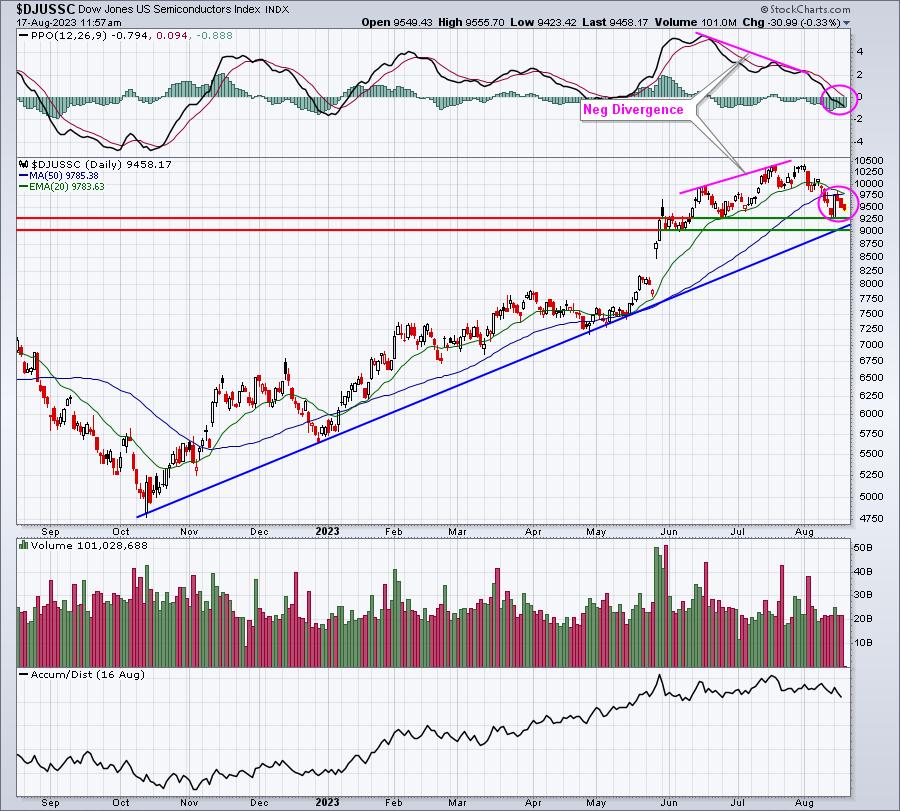
The negative divergence was very obvious and a pullback was certainly overdue. Well, now we've seen it. I see trendline support in the same 9000-9250 range where we also have price support. If you see a reversing candle form from here down to this range, trading the SOXL (Leveraged ETF that trades 3x the semi group) could be make sense, especially for those of you that are high-risk traders.
Now for that weekly chart:
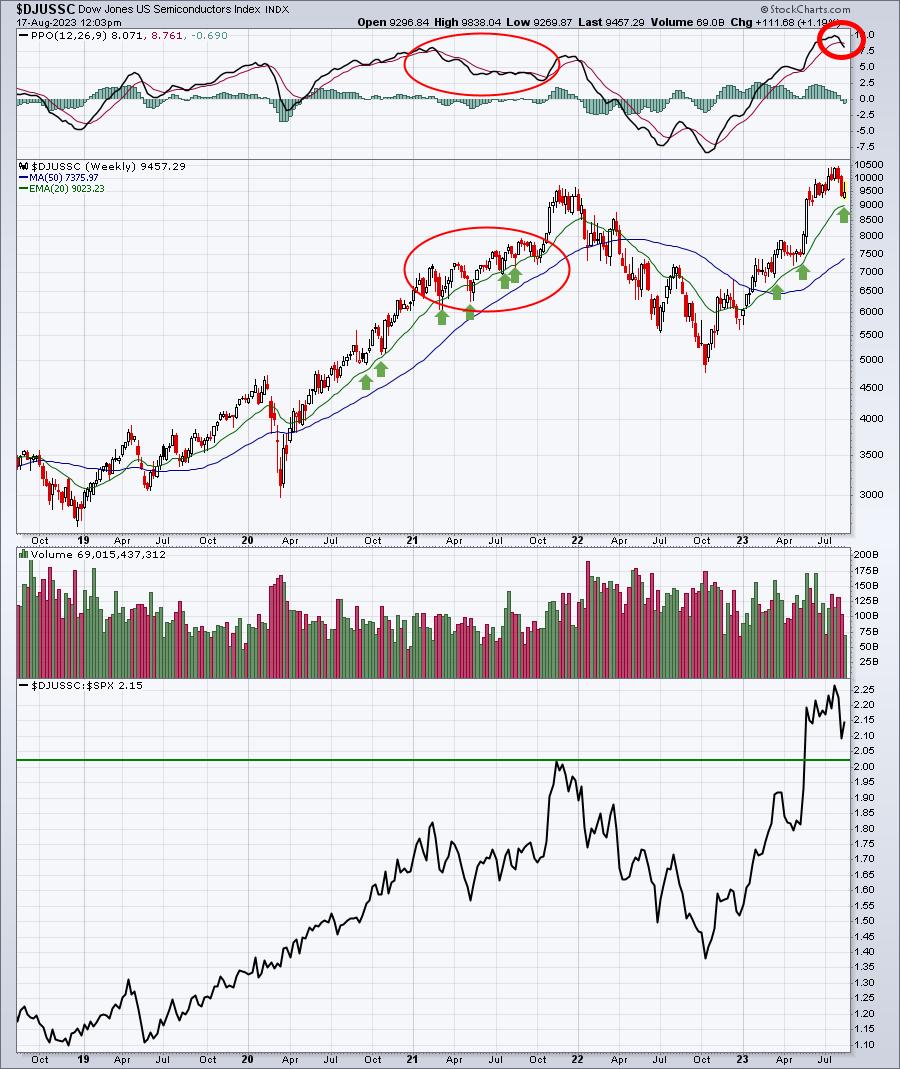
First, look at all those successful 20-week EMA tests during uptrends. DO NOT rule out a quick reversal off the 20-week EMA, IF we even test it at all. We'll see. Also, I'm asked A LOT of times why I would consider going long when the PPO rolls over and crosses beneath its trigger line (9-day moving average of and red line in the PPO)? Well, ANY TIME the PPO is above zero, there's positive momentum. After extended advances, it's almost a certainty that we'll see the PPO roll over and cross this line during pullbacks. As an example, I've circled the PPO and price action of semis during the majority of 2021. Note that the PPO stayed mostly below its trigger line as the DJUSSC continued to hold its 20-week EMA and advance throughout this period. The roll over and crossing of the trigger line tells us that the pace of advance, or slope, has slowed, but it does NOT signal that the group won't go higher.
ChartLists/Strategies
Here's yet another look at stocks returned this morning from our Downtrend Reversal scan (in SCTR order):
JFIN, NYCB, IBM, NIO, ECL, OTIS, HBM, FCX, DFS, PTON
Of these, OTIS is bouncing off a key price support that's been tested multiple times over the past couple months. DFS has been crushed to the downside, but it's testing long-term price support and an island cluster reversal could be in play soon. However, we need to see the gap up above the trading range over the past 3 sessions in order to confirm this candlestick pattern. NIO is perhaps the most aggressive stock on this list today and I like it, but it needs a "risk-on" environment to thrive and we're just not seeing it yet.
Earnings Reports
Here are the key earnings reports for the next two days, featuring stocks with market caps of more than $10 billion. I also include notable companies with market caps below $10 billion. Finally, any portfolio stocks that will be reporting results are highlighted in BOLD. If you decide to hold a stock into earnings, please understand the significant short-term risk that you are taking. Please be sure to check for earnings dates for any companies that you own or are considering owning.
Thursday, August 17:
WMT, AMAT, ROST, KEYS, NICE, BILL, TPR, GLOB, BILI, LITE, FTCH
Friday, August 18:
DE, PANW, EL, XPEV, VIPS, BKE
Economic Reports
Initial jobless claims: 239,000 (actual) vs. 240,000 (estimate)
August Philadelphia Fed Manufacturing Index: 12.0 (actual) vs. -10.0 (estimate)
July leading indicators: -0.4% (actual) vs. -0.4% (estimate)
Happy trading!
Tom