
EB Daily Market Report - Friday, August 18, 2023
StockCharts Article
I wrote a Trading Places with Tom Bowley article this morning that you might want to take a look at, if you haven't already. CLICK HERE to see the article.
Portfolio Update
Our Portfolios are scheduled to be sold at the close today. HOWEVER, because the stock market is showing signs of an impending rebound, I believe the odds are in our favor to remain invested. For each quarter's portfolio, we'll likely exit on the 19th and re-enter the new portfolios on the 25th. The reason is that historically the 19th to the 25th is the worst time of the calendar month. By exiting on the 19th and re-entering on the 25th (at the closes), we'll essentially remove the risk of holding during this period 4 out of the 12 months of the year.
This month is potentially much different, though. Normally, the stock market rises from the 11th to the 18th, which makes holding from the 19th to the 25th much riskier, primarily because of monthly option expiry. In August, however, we've seen extensive selling from the 11th through the 18th, so I believe it's practical to hold this month all the way through the 25th (although I could decide next week that we'll exit a day other than the 25th, which is next Friday. If anything today's option expiry should help the bulls and potentially help the bulls again next week.
We are HOLDING all portfolio stocks through next Friday, August 25th, unless discussed otherwise next week. We will do our "DRAFT" of new portfolio stocks next week and enter them at the close on Friday, August 25th.
Executive Market Summary
- Futures showed further weakness in our major indices as they all opened lower
- Buyers showed up quickly, however, especially on the small cap Russell 2000 (IWM, +0.69%)
- The key, though, will be how we finish today, not how we're trading at noon
- Cryptocurrencies continue to unravel, with bitcoin ($BTCUSD, -7.23%) now approaching a critical support level at 25000; litecoin ($LTCUSD, -13.84%) has hit a new low for 2023
- The Volatility Index ($VIX, -1.12%) is down today after initially surging near 19; a close above 20 would absolutely open the door to further panic in the near-term
- Most commodity prices are higher, including crude oil ($WTIC, +1.12%), which has climbed back above $81 per barrel
- The 10-year treasury yield ($TNX) is backing off the 4.33% yield resistance established in October 2022, down 7 basis points on the day thus far
- While the market is attempting a rebound today, sector performance is not exactly bullish as most aggressive sectors are lower; energy (XLE, +0.94%) and defensive sectors are leading
- Semiconductors ($DJUSSC, -0.24%) are off their lows of the session, but still in negative territory - despite a very strong quarterly earnings report by Applied Materials (AMAT, +2.51%)
- I don't like to over-dramatize things, but this afternoon's action and today's close is important for those looking for the start of a rebound - like me
Market Outlook
Listen, anything goes in the stock market. There are NEVER any guarantees. I've seen the best long setups fail. I've seen the market explode when there were few signals to support it. It's always about managing risk for me. If my signals line up for long trades, then I go in with more confidence until the market proves me wrong. If several warning signs emerge, then I try to reduce my exposure/risk until I feel more comfortable again. That's what works for me OVER time, not EVERY time.
If the stock market is setting up for a BIG move lower, it makes perfect common sense that the big Wall Street firms will be allocating their money (or rotating) in a very defensive way. That shows up on the charts, not on CNBC, and that's what happened at the end of 2021 and into 2022. I'm simply not seeing much of that currently, which makes it very difficult for me to grow bearish - despite the selling we've seen the past 4 weeks. In fact, it makes me more bullish. I was cautious at the start of the recent selling, because of SHORT-TERM warning signs. My longer-term signs remained, and still remain, bullish, which is why I maintain my bullish stance. I've made my mark by using my own proprietary signals, along with other technical, fundamental, sentiment and historical indicators. It's enabled us at EarningsBeats.com to rise above the rest and make solid calls BEFORE they occur. We have a history of doing so and we'll continue to strive to do that.
I re-established my TNA position over the past couple days, though as I indicated yesterday, I only rotated about 25% to the TNA (from the IWM) this time. Hopefully, this time works better. But if we make another dive into the close today, I'll take no chances. If ALL of our key indices/ETFs (SPX, NDX, IWM) close below their 20-week EMAs, I'll likely exit everything and sit in cash over the weekend. While I'm absolutely BULLISH, I am NEVER a fan of losing what I believe is the most important price support. If we close beneath 20-week EMAs, I'd rather err on the side of caution. It wouldn't be the end of the world if I had to re-enter at higher prices.
I do want to show you a chart of the IWM that is quite possibly printing a significant reversing candlestick:
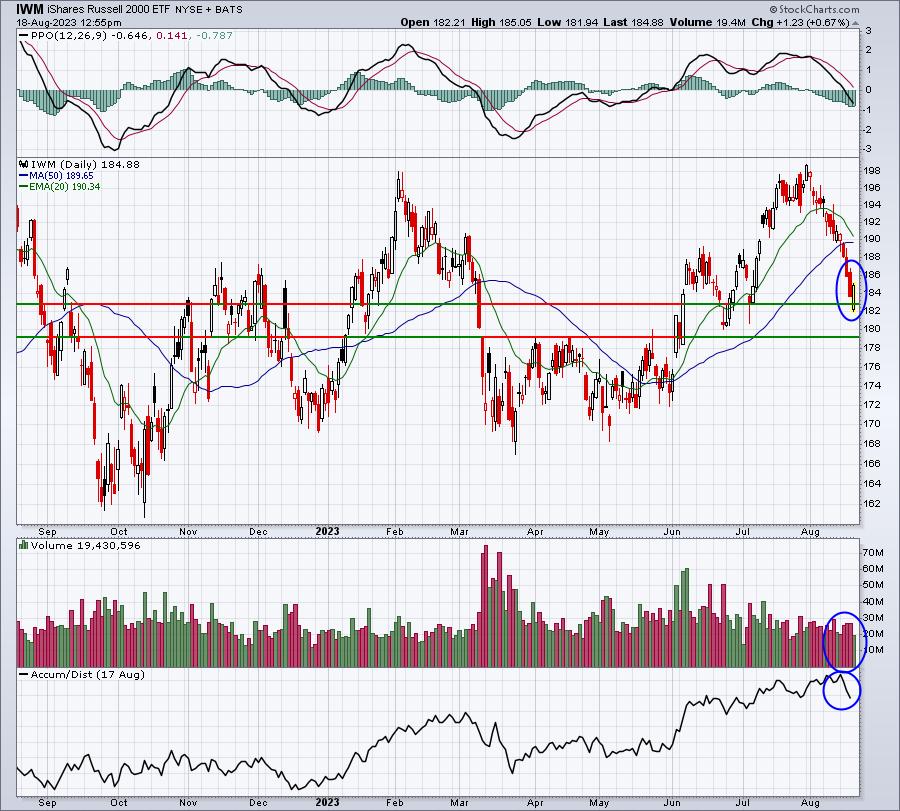
Watch these 3 things at the close today (blue circles above):
- Did we finish on or near the high of the day, printing a piercing or bullish engulfing candlestick?
- Did volume surpass recent down day volume?
- Did the AD line also reverse and perhaps begin another ascent to its all-time high?
If the answer to these 3 questions is "YES", I believe a bottom formed. If selling engulfs the market into the close again and these 3 questions are answered "NO", then we'll regroup and wait for another week of emotional trading.
Sector/Industry Focus
I've updated our key INTRADAY ratios and I wanted to share those with you, along with the latest CPCE 5-day reading. Here are some of the charts that I believe are important as we try to assess whether Wall Street is truly prepping for much more weakness ahead:
$CPCE:
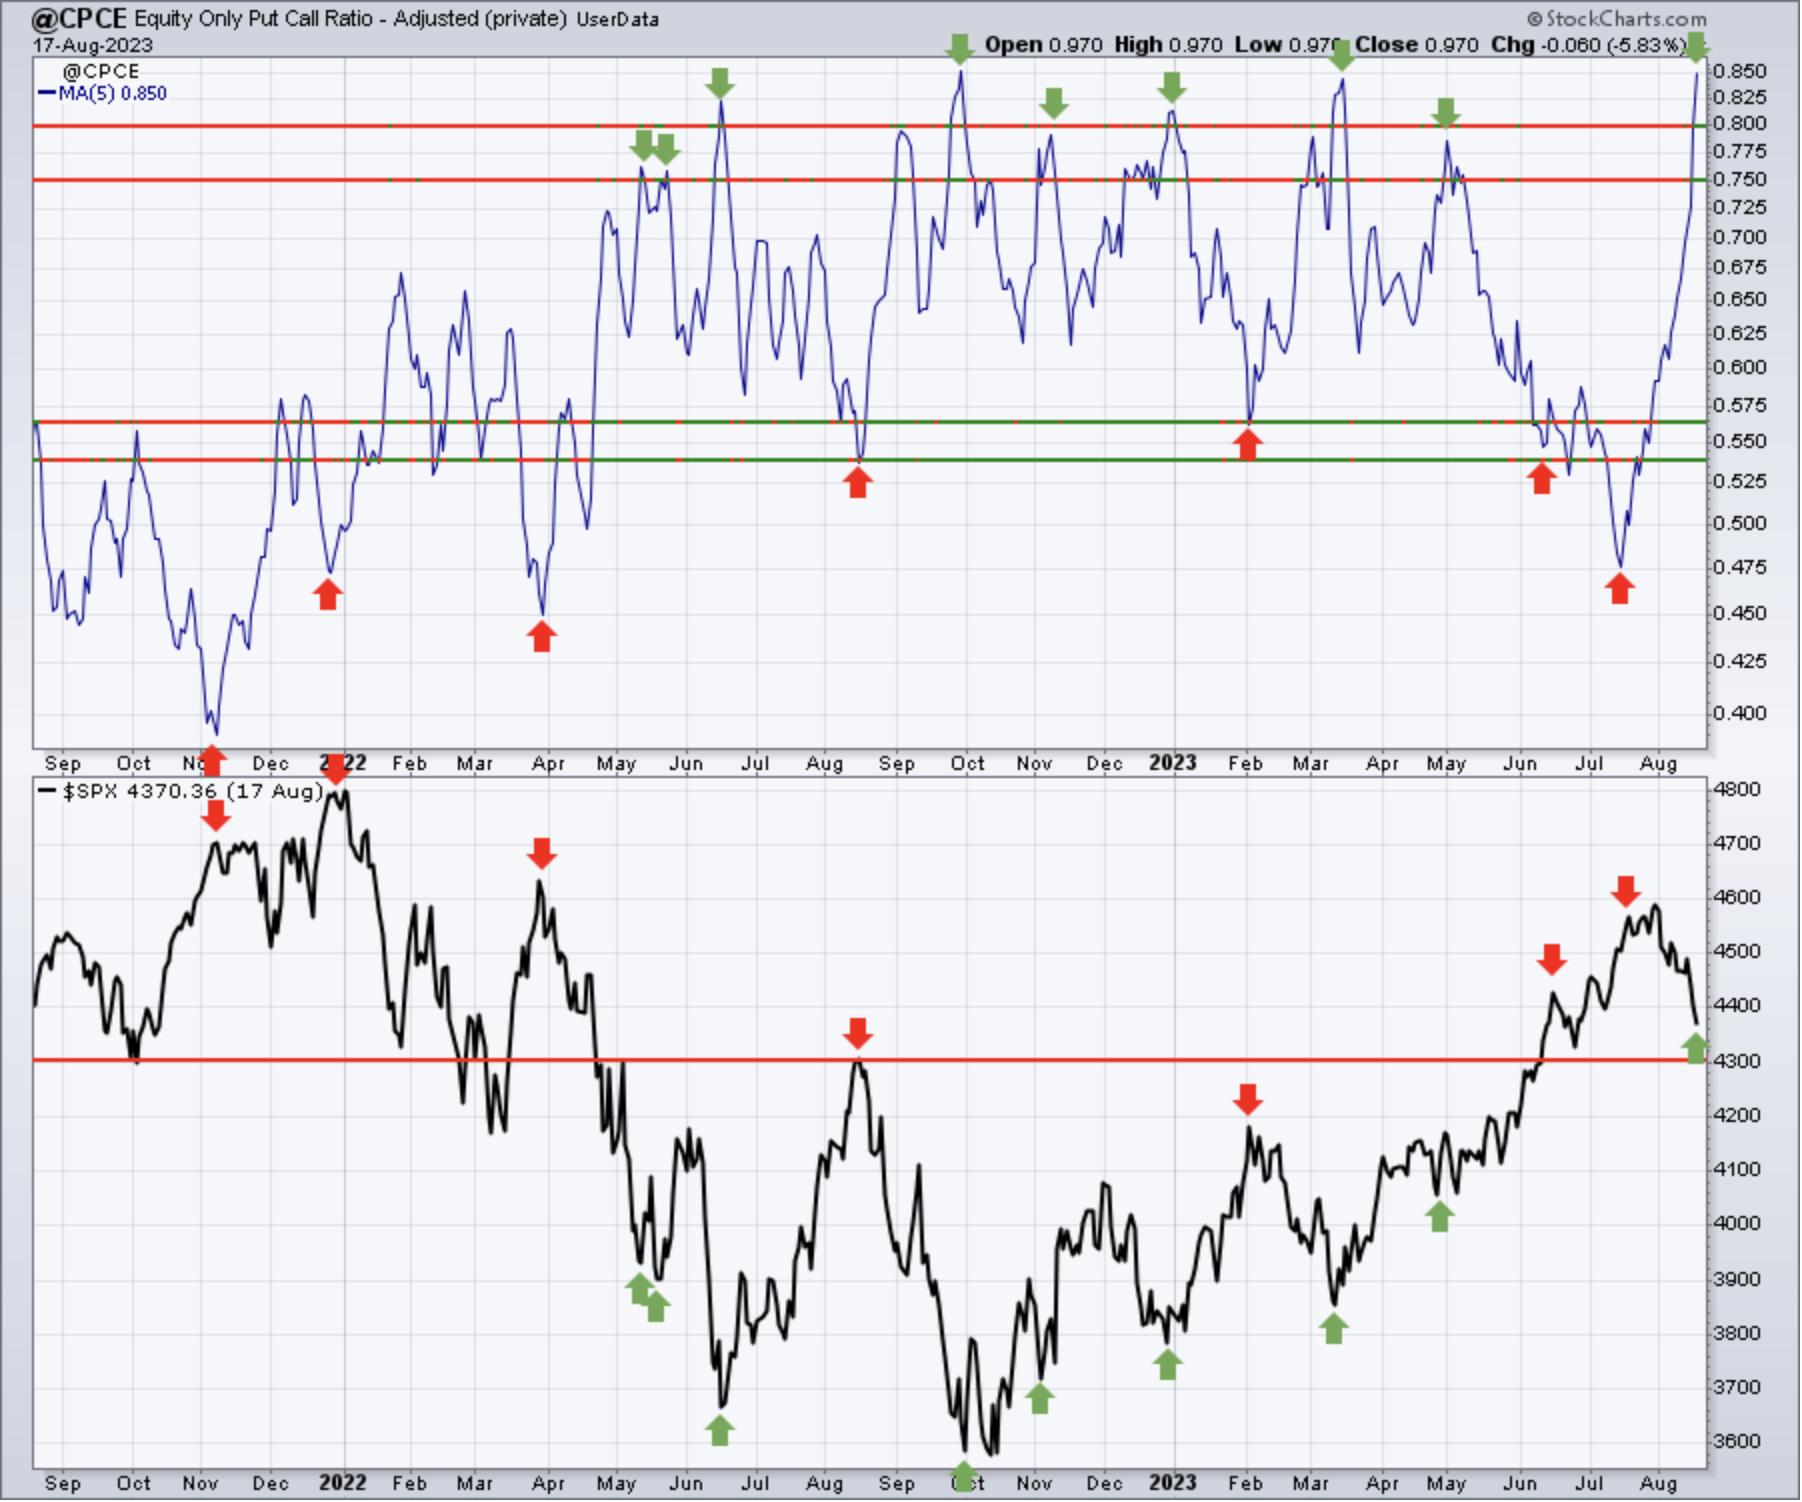
Red arrows mark lows in the CPCE 5-day moving average, which show extreme complacency (normally marking market tops). I've used those same red arrows to indicate where the S&P 500 was when these "sell signals" emerged. The green arrows mark highs in the CPCE 5-day moving average, which shows extreme fear (normally marking market bottoms). I've used those same green arrows to indicate where the S&P 500 was when these "buy signals" emerged. You're welcome to draw your own conclusions, but when I see those green arrows, it's TIME TO BUY. The current 5-day moving average of the CPCE is at .85, the HIGHEST level it's been over the past 2 years. Sell this market at your own risk.
QQQ vs. SPY:
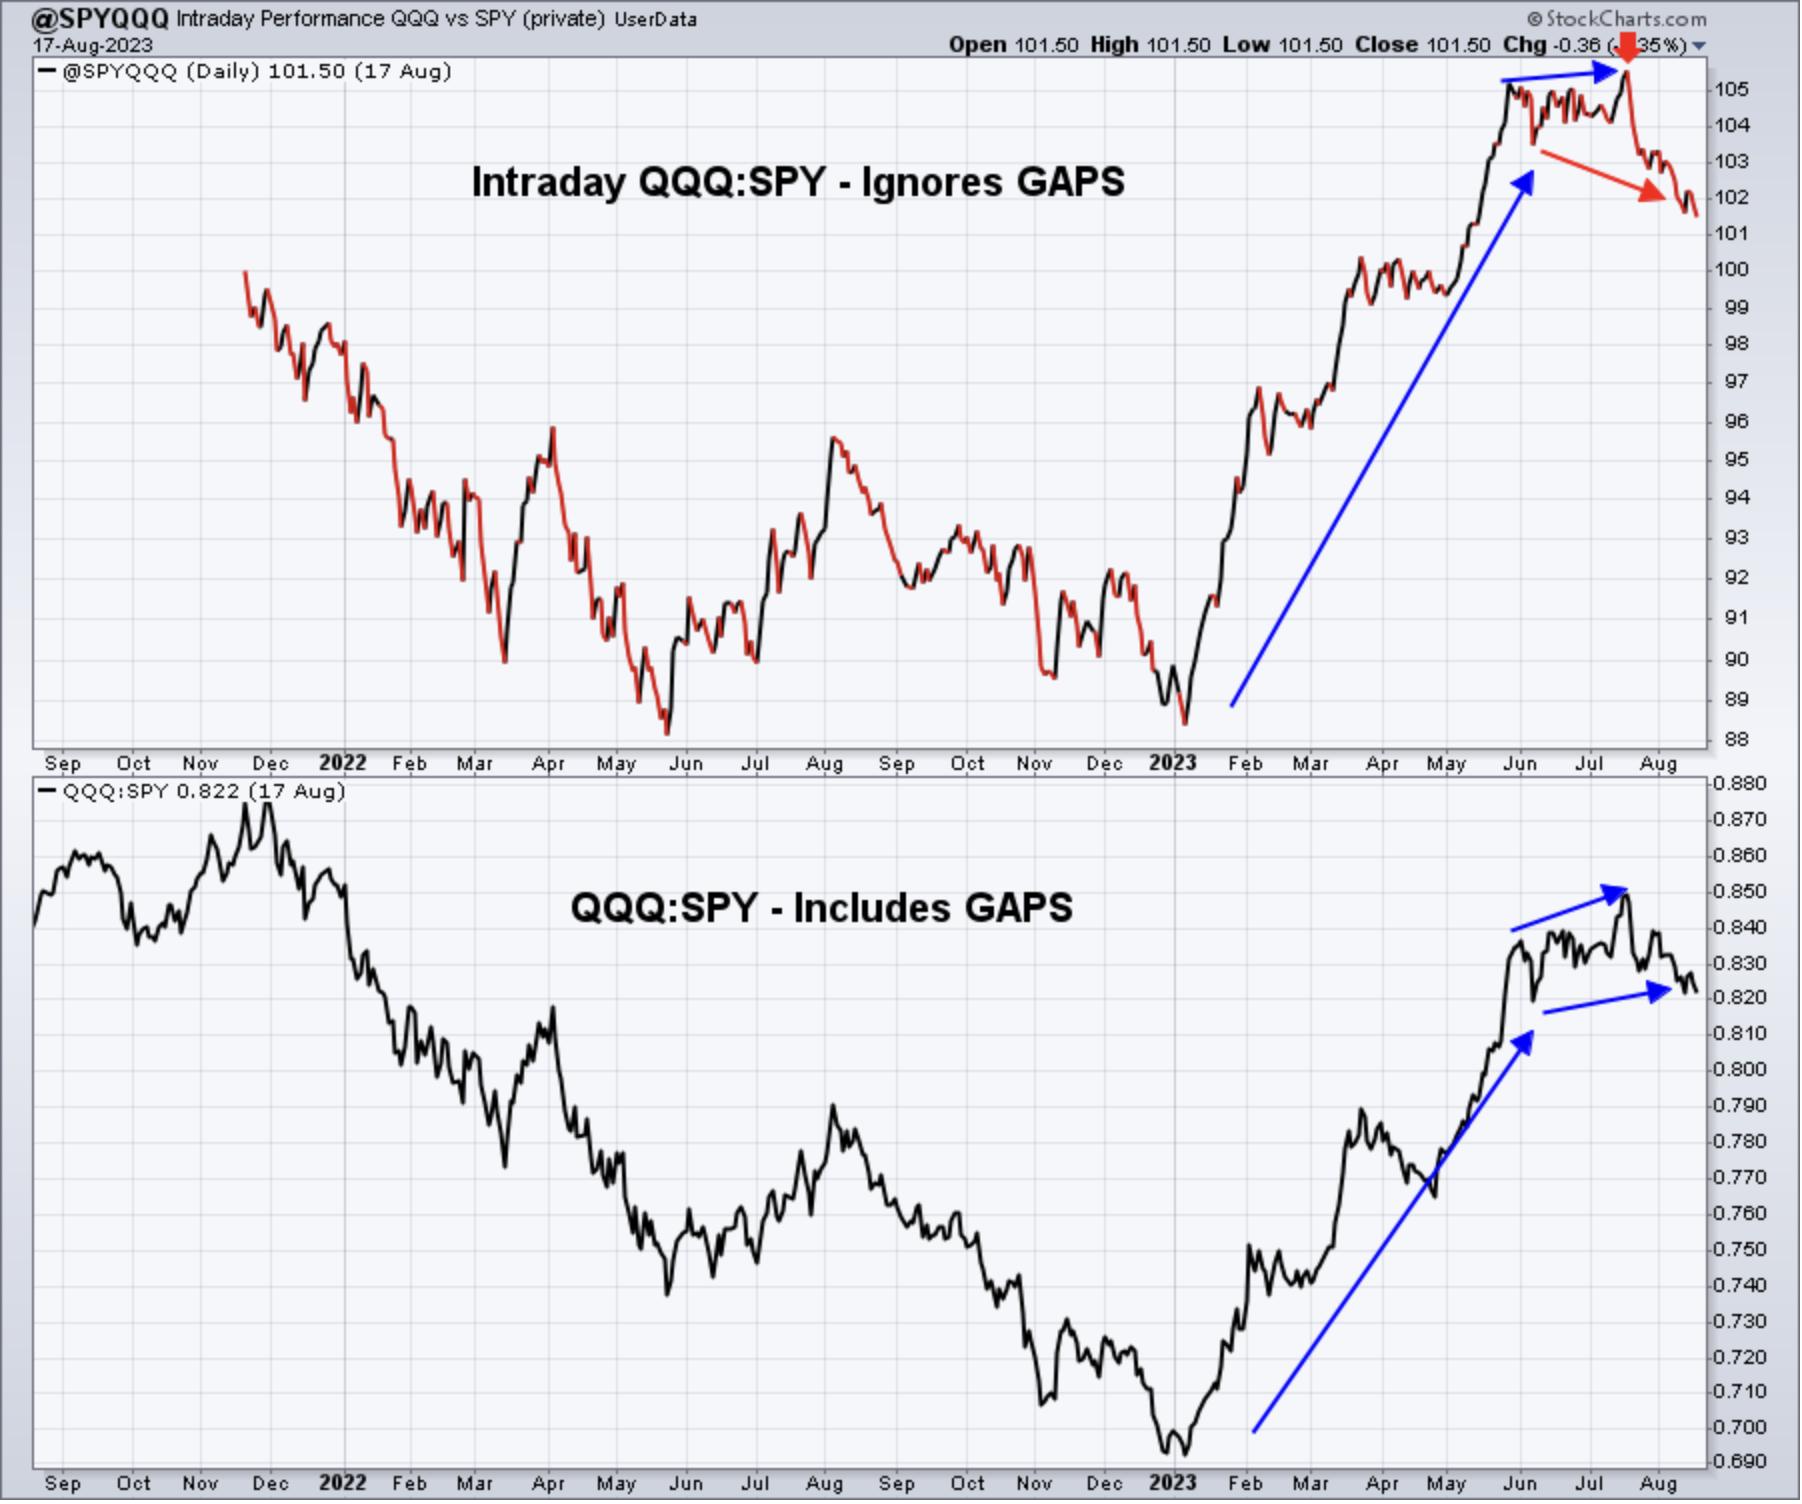
We've seen some deterioration in the QQQ:SPY ratio, but to be quite honest, it was waaaay overdue. The QQQ had been crushing the SPY and there was ZERO rotation away from the QQQ as the July top formed - VERY UNLIKE what we saw during the final rally in 2021. That's why I believe we're in a very different market environment right now.
XLY vs. XLP:
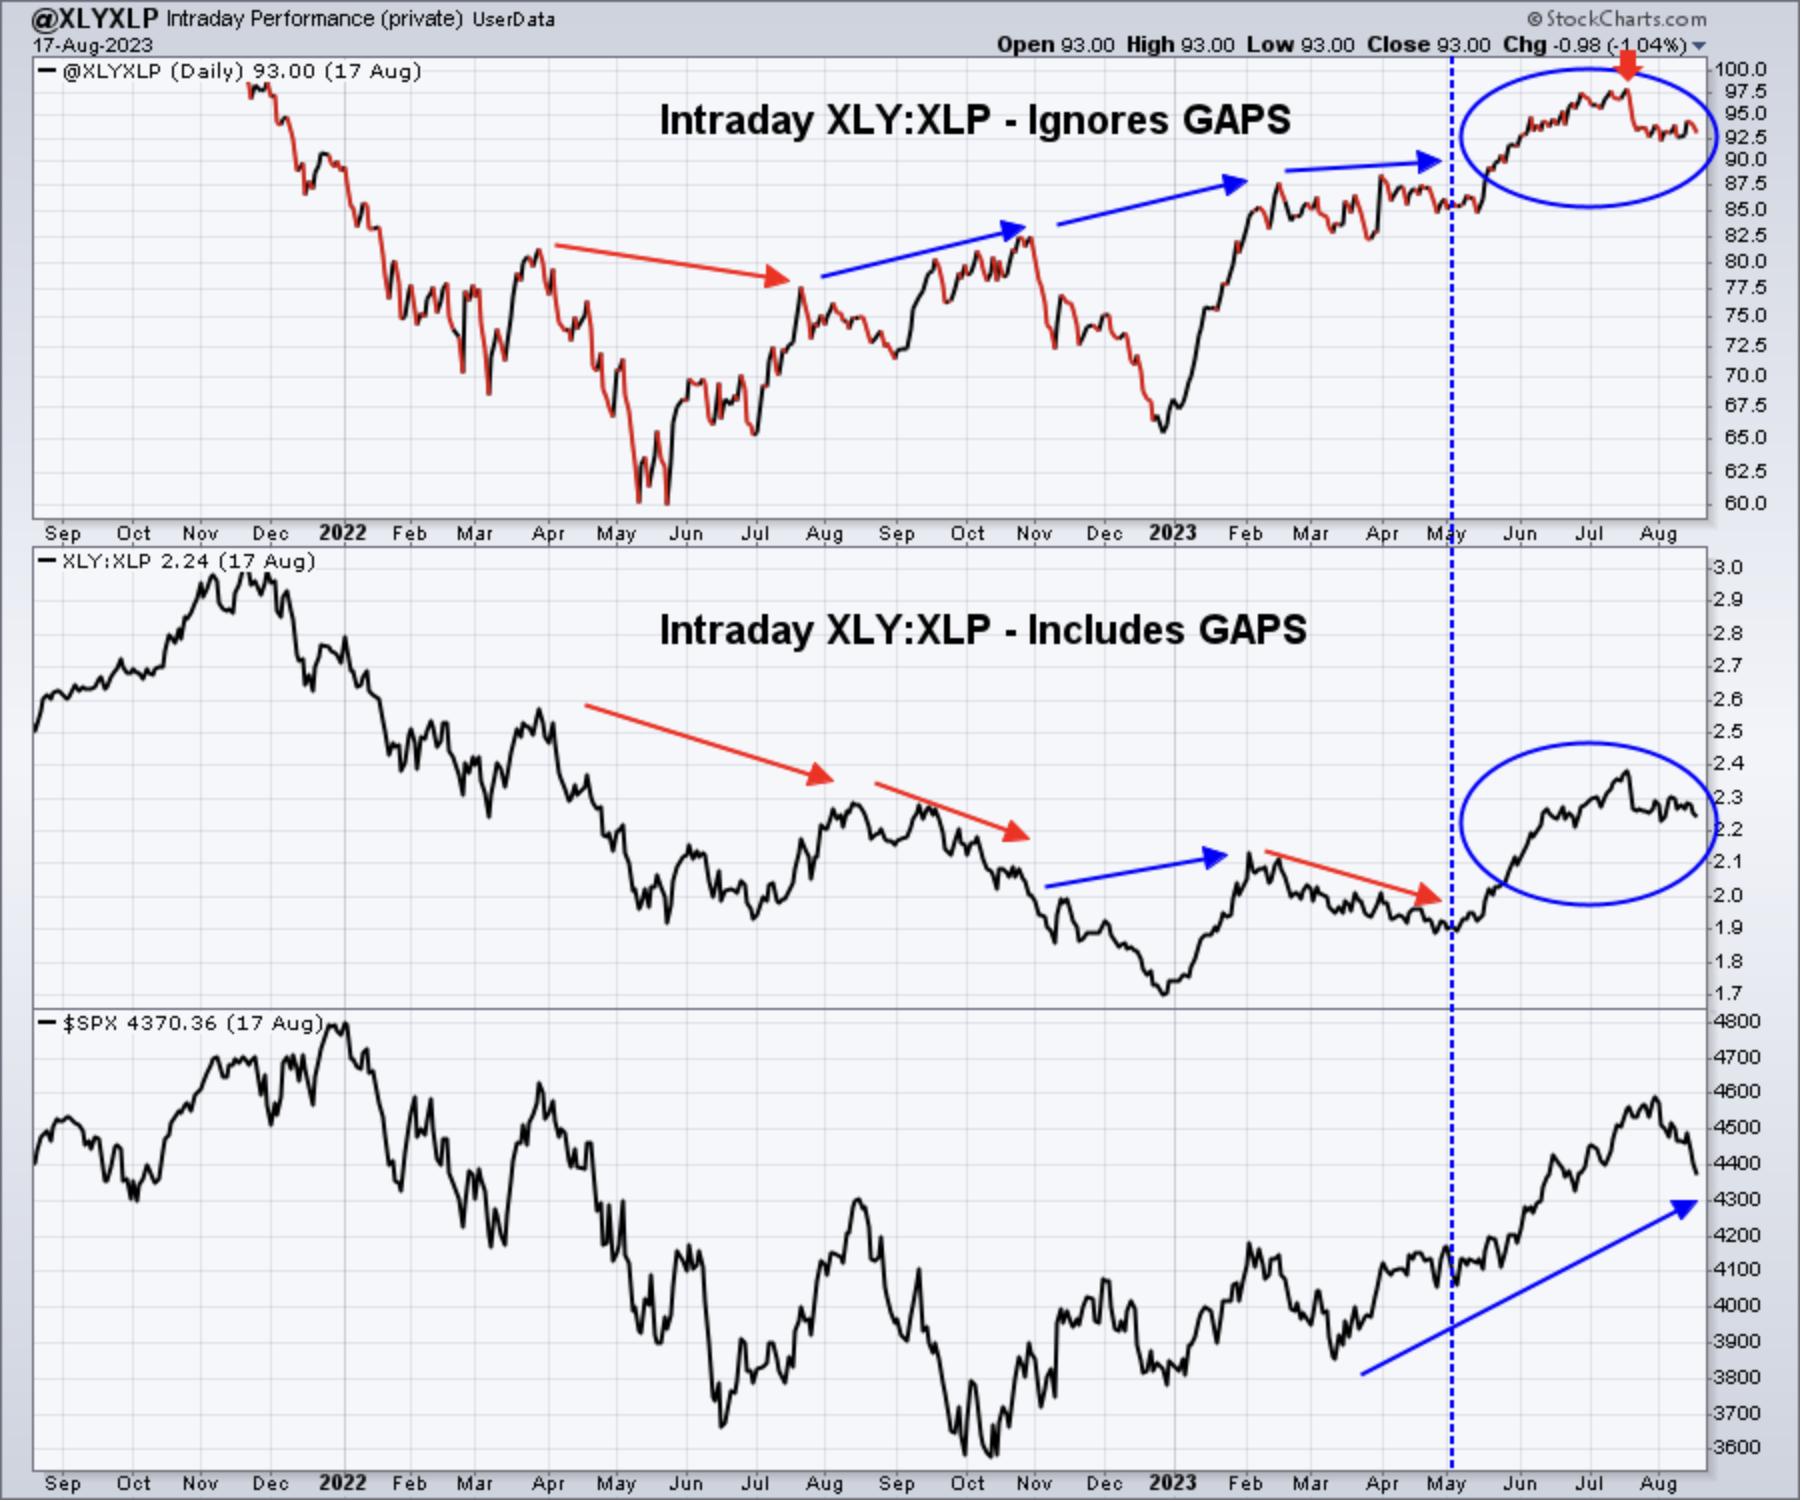
This XLY:XLP ratio is perhaps the most important ratio as consumer spending is roughly 2/3 of our GDP. If this XLY:XLP ratio is rising, it's a VERY STRONG and bullish signal that Wall Street expects good things ahead. While we've seen a lot of selling in August, this intraday ratio has remained above the level it was at the beginning of August. In other words, during the trading day, we've seen ZERO rotation out of the aggressive consumer discretionary area and into the defensive consumer staples. I simply cannot jump on this bearish bandwagon given this signal.
IWM vs. QQQ:
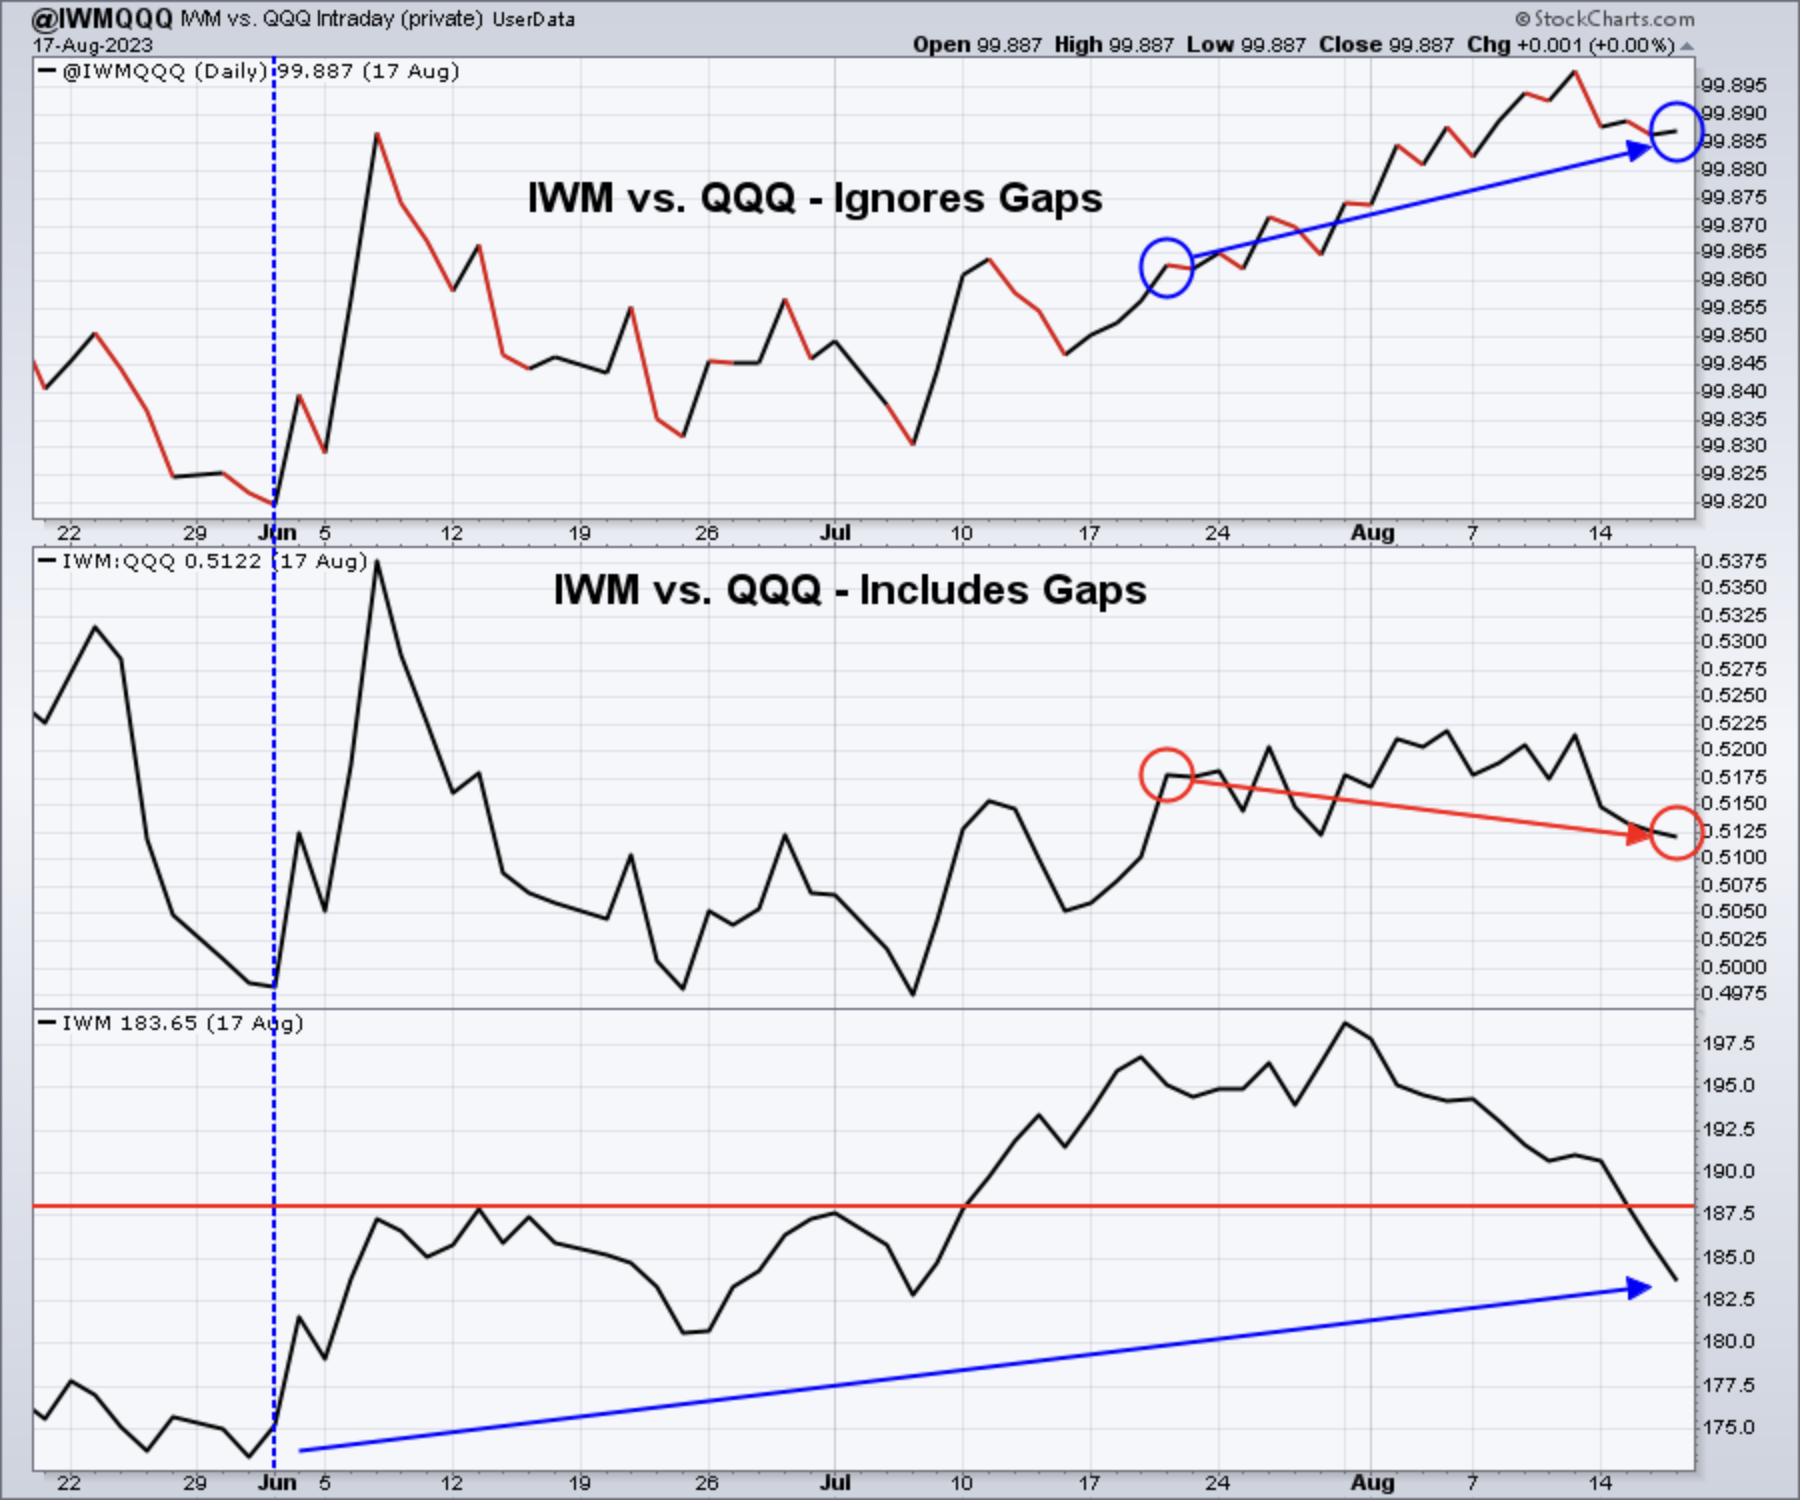
First, let me say that I don't use this ratio to call the future direction of stock prices. I've been following this ratio simply to see if it appears a shift is taking place from large cap to small cap stocks. Since the market top, both the IWM and QQQ have moved significantly lower, but check out that top panel. The IWM has trended significantly higher on a relative basis vs. the QQQ IF WE IGNORE OPENING GAPS, which is exactly what I do.
I said back in mid-July to "lower the expectation bar" for the stock market until we get to Q4. I had no idea that we'd see a 10% decline in some areas, but I did know the market was ripe for a period of selling and/or consolidation. That's exactly what we've seen. Based on technical considerations, along with the intraday ratios above, I believe we're AT or VERY NEAR a MAJOR bottom. Could I be wrong? Absolutely, but I don't shy away from calling what I see.
By the way, here's the latest equity only put call reading at cboe.com today:
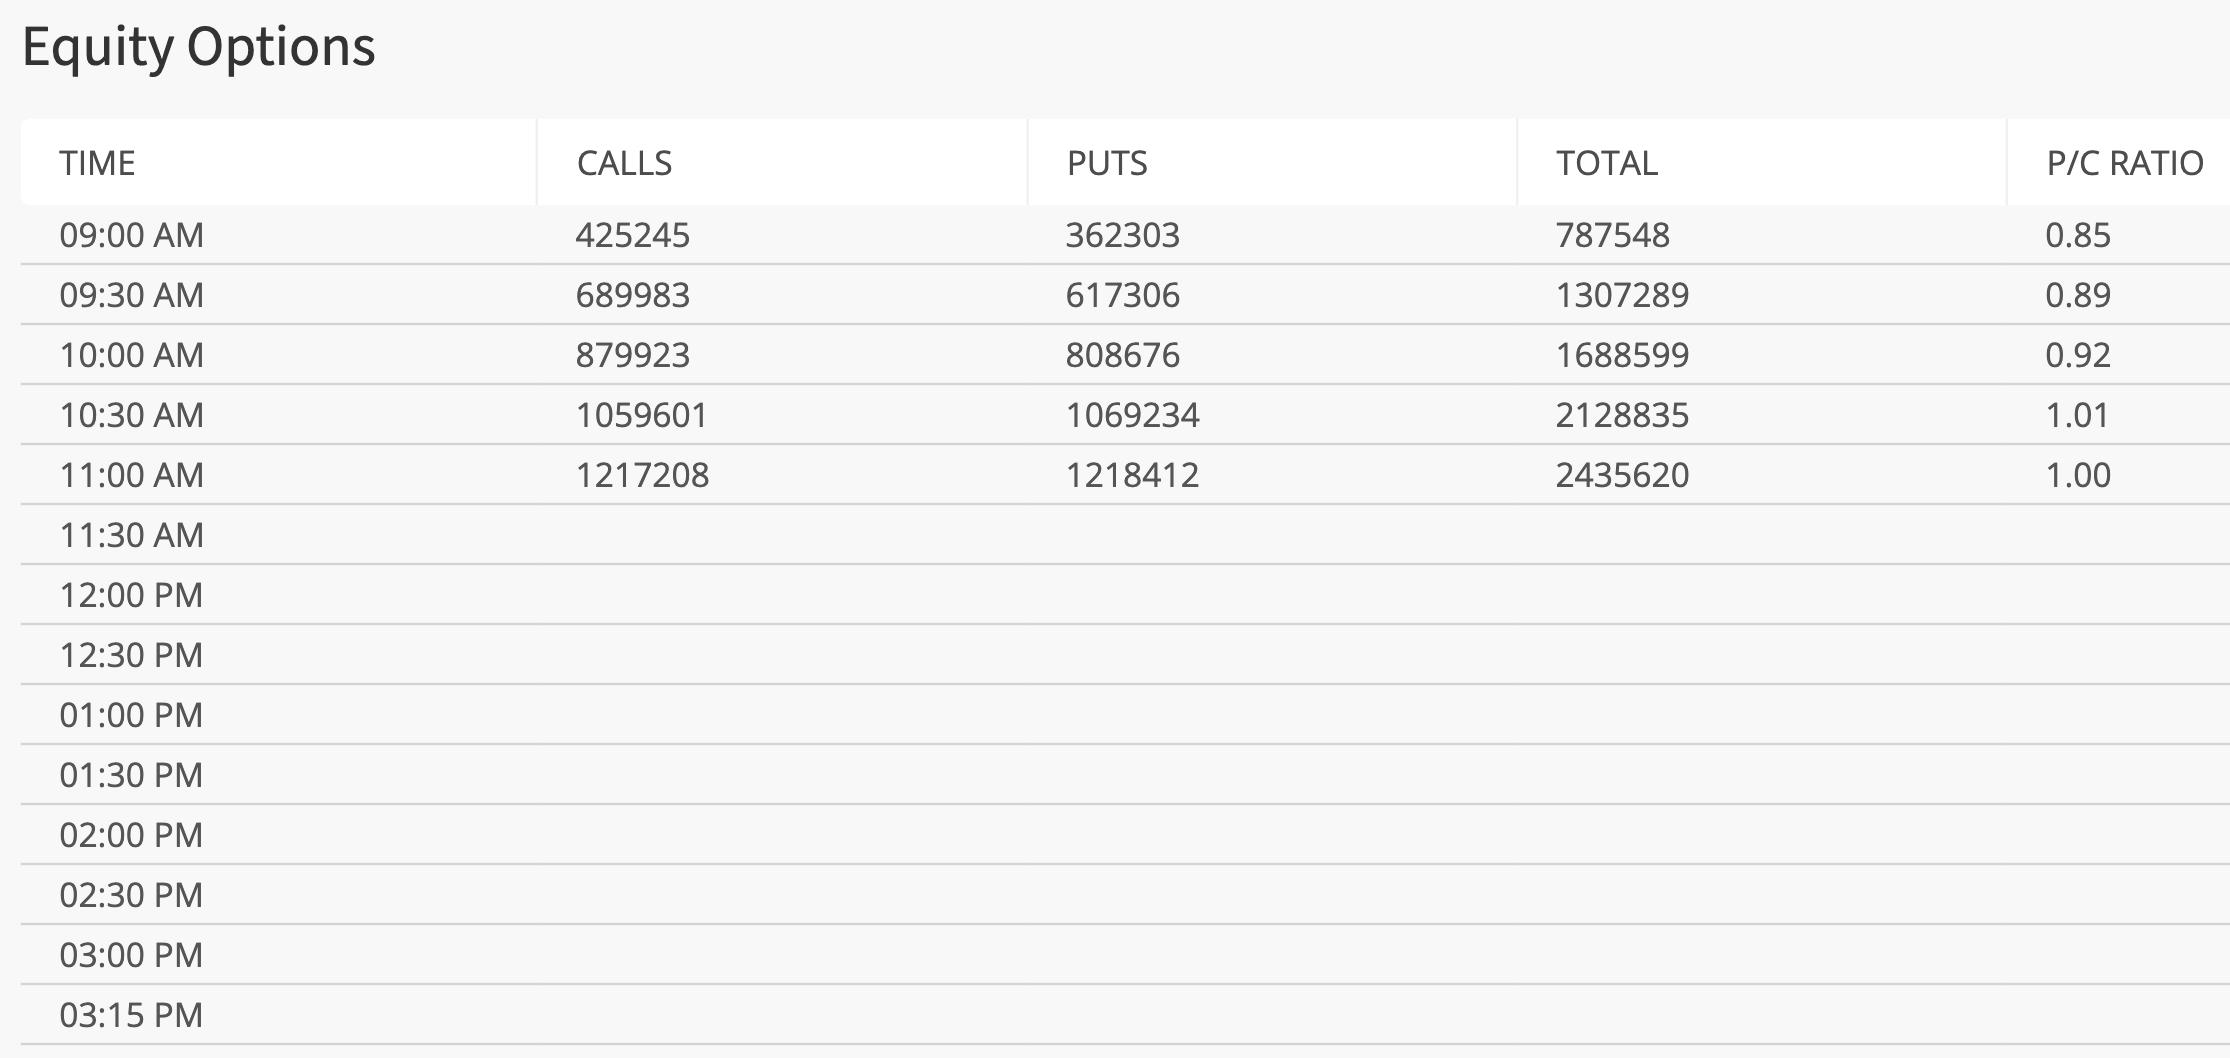
The mindset of retail traders has completely changed again as they chase the market down, what they believe, is a certain rabbit hole. I'm going with the opposite, the hole is in the process of being plugged.
ChartLists/Strategies
The pace of stock reversals will increase significantly if the overall market does the same. Obviously, that's the million-dollar question right now - when will the stock market reverse? Today? Monday? Later next week sometime? The past few days we've seen roughly 10-15 stocks appear on our Downtrend Reversal scan. Today, there are 15 so far and that number could rise if we see afternoon market strength. Here are the latest possible reversals:
AZUL, CPRI, AMAT, AGS, CVGI, DRD, ALV, CPA, AX, GTN, LMND, WSC, GTES, ALGM, TDOC
I look for stocks that show many reasons to consider buying, so that these other signals corroborate the reversal of its recent downtrend. Here are the 3 names on this list that I like, because of other corroborating signals:
AMAT:
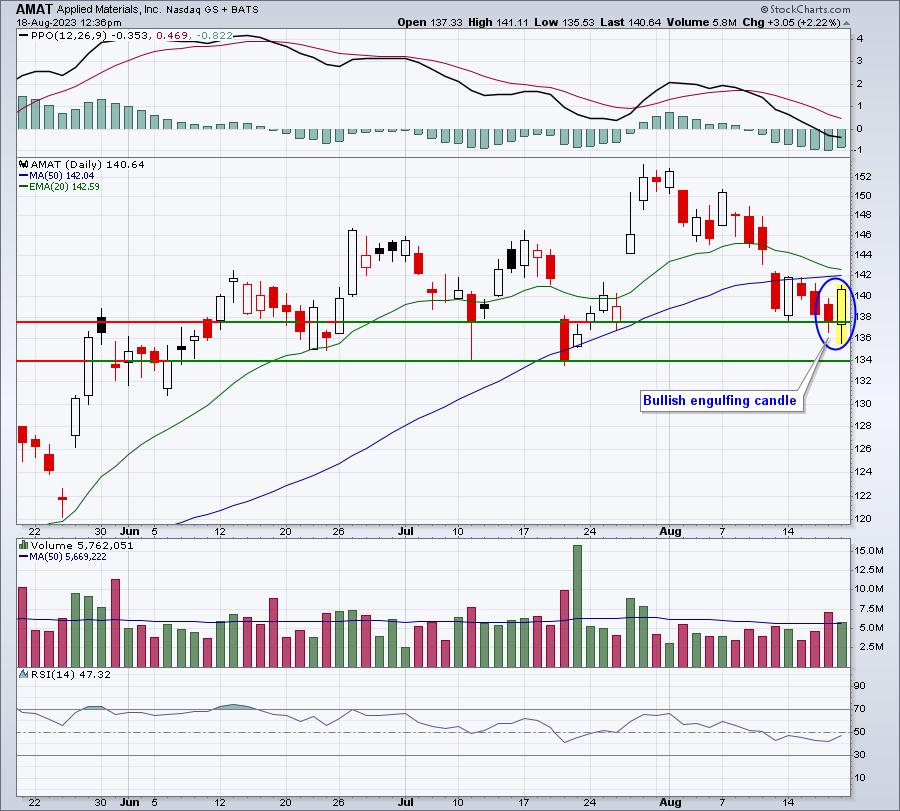
AMAT reported revenues and EPS that both easily surpassed Wall Street consensus estimates. And today, on heavy volume, it's printing a bullish engulfing (reversing) candle at a key price support zone. I see AMAT performing very well near-term.
AGS:
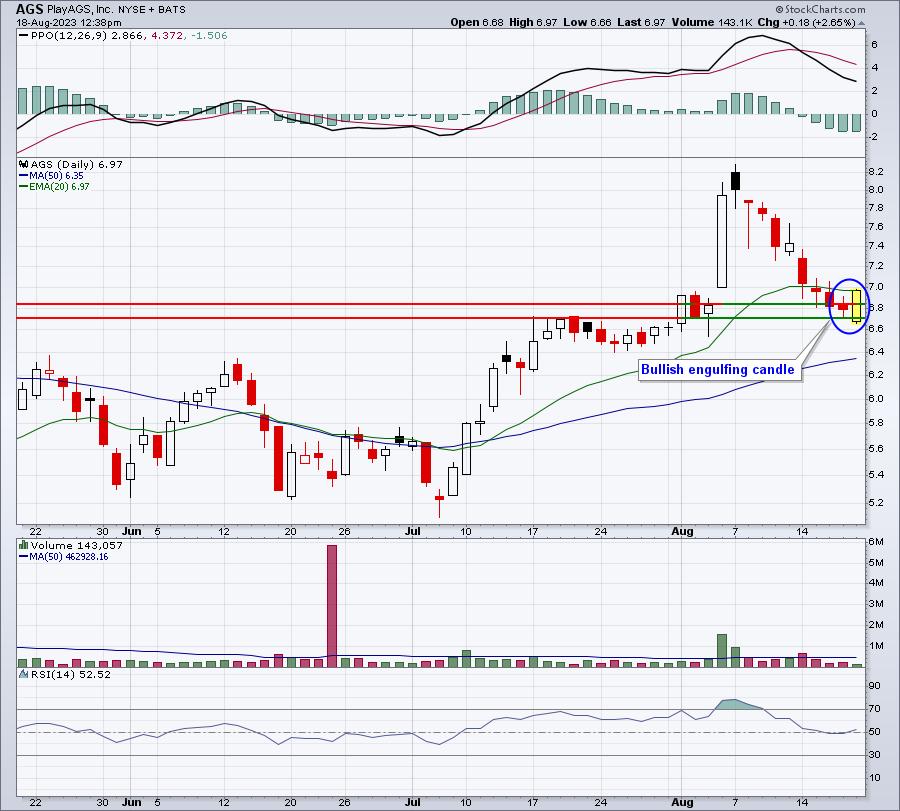
This reversing candle looks nice as well and we can also throw in both gap and price support as corroborating signals of a potential bottom.
ALV:
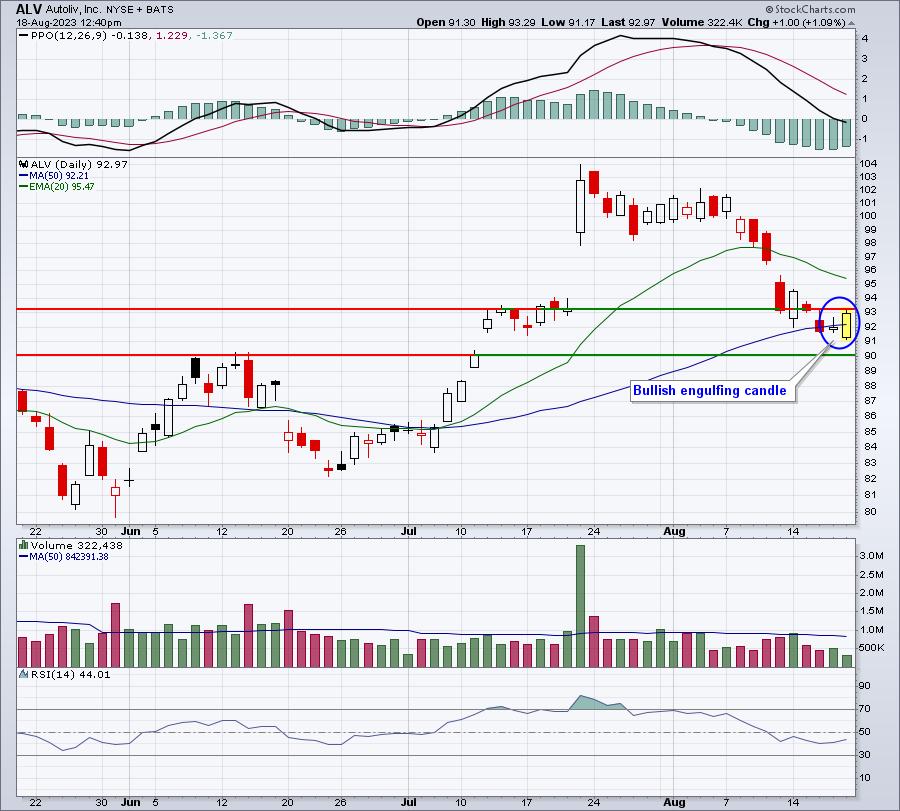
ALV failed to hold its most recent gap support near 93, but it is attempting a nice reversal today in a recent gap and price support zone.
AMAT and ALV clearly have the strongest AD lines among these 3, if that's important to you.
Earnings Reports
Here are the key earnings reports for the next two days, featuring stocks with market caps of more than $10 billion. I also include notable companies with market caps below $10 billion. Finally, any portfolio stocks that will be reporting results are highlighted in BOLD. If you decide to hold a stock into earnings, please understand the significant short-term risk that you are taking. Please be sure to check for earnings dates for any companies that you own or are considering owning.
Friday, August 18:
DE, PANW, EL, XPEV, VIPS, BKE
Monday, August 21:
ZM, NDSN, FN
Economic Reports
None
Happy trading!
Tom