
EB Daily Market Report - Tuesday, August 22, 2023
ChartList Update
I'm currently working to update all of our key ChartLists prior to our Portfolio Draft on Thursday, August 24th at 5:30pm ET. I'm hoping to have the following complete by Thursday:
- Strong Earnings (SECL)
- Strong Future Earnings (SFECL)
- Raised Guidance (RGCL)
- Strong AD (SADCL)
- Bullish Trifecta (BTCL)
- Earnings AD (EADCL)
I'll keep you posted, but expect the updated ChartLists to be ready on Thursday morning.
Portfolio Update
Our Portfolios were scheduled to be sold at the close last Friday. However, given the extreme reading (.85) in the 5-day moving average of the equity only put call ratio, which suggests an imminent rally at hand, we decided to hold our portfolios another week.
We are HOLDING all portfolio stocks through this Friday, August 25th, unless discussed otherwise. We will do our "DRAFT" of new portfolio stocks on Thursday, August 24th and enter them at the close on Friday, August 25th.
Executive Market Summary
- Futures were higher overnight and we gapped up at the opening bell
- There's been mostly selling ever since; small caps (IWM) have held up better on an intraday basis
- The 10-year treasury yield ($TNX) continues to hover near the key 4.33% yield level with the Fed's Jackson Hole speech set for Friday
- 9 of 11 sectors are now lower, with leadership from real estate (XLRE, +0.31%) and utilities (XLU, +0.30%)
- Financials (XLF, -1.02%) represent the worst-performing sector as banks ($DJUSBK, -2.47%) struggle again
- Commodities are mixed as crude oil ($WTIC, -0.58%) drops back close to $80 per barrel
- Existing home sales were reported slightly below expectations; home construction ($DJUSHB, +1.07%) are bouncing on the news, perhaps establishing a neckline near 1850
- Dick's Sporting Goods (DKS, -24.12%) is leading several retailers lower after reporting quarterly results
Market Outlook
I realize that this is truly getting the microscope out, but the Volatility Index ($VIX) hasn't spiked while we've seen the S&P 500 drift lower throughout the trading day since the gap up at the opening bell. Check this out:
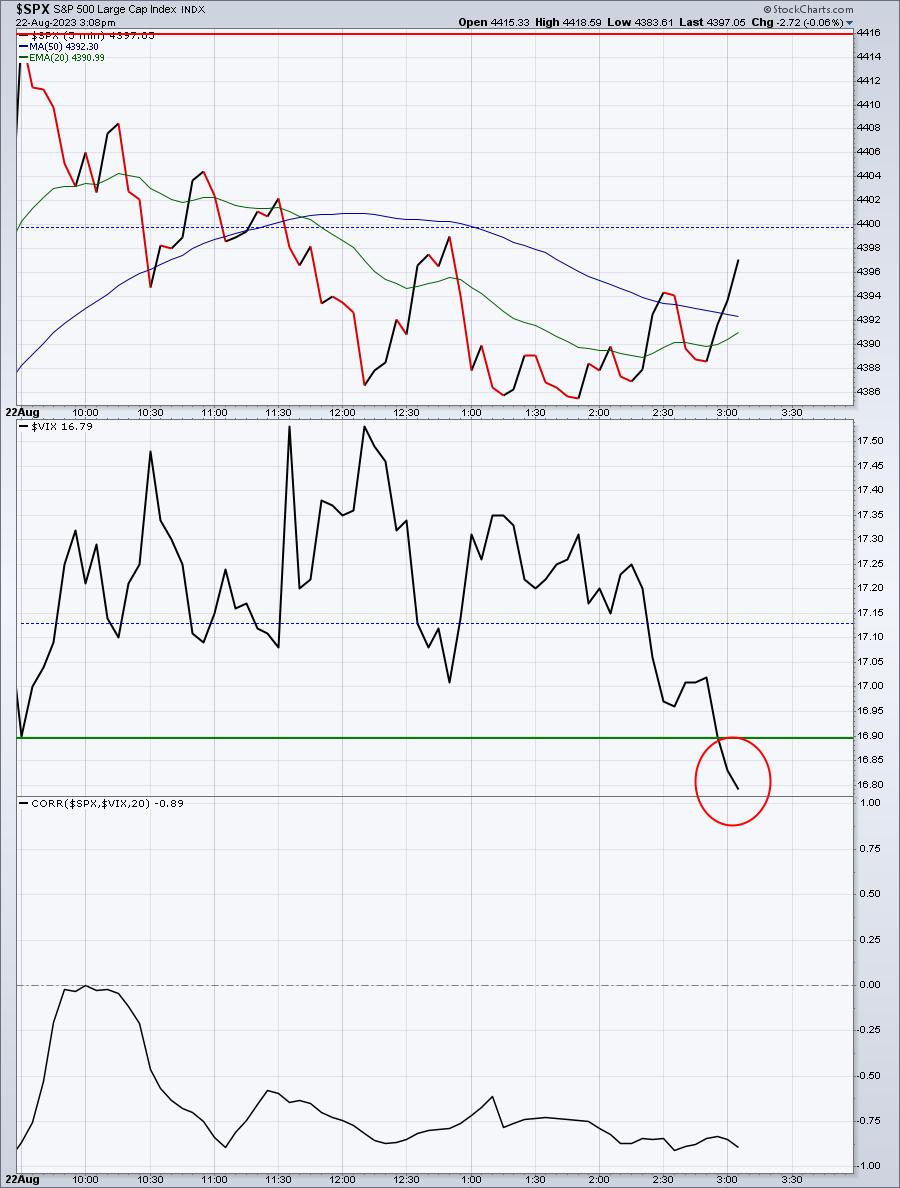
This might mean absolutely nothing, but I look for clues in all places. I find it VERY interesting that the VIX has just fallen to its low of the day, with the S&P 500 still quite a bit away from its daily high. It certainly seems like fear is quickly abating and that has to be considered a bullish short-term development. How meaningful? I'm not sure, but the next few days will likely tell us.
If I step back a bit and look at the daily chart of the QQQ (ETF that tracks the NASDAQ 100), I see a different, more bearish picture that we need to at least be aware of:
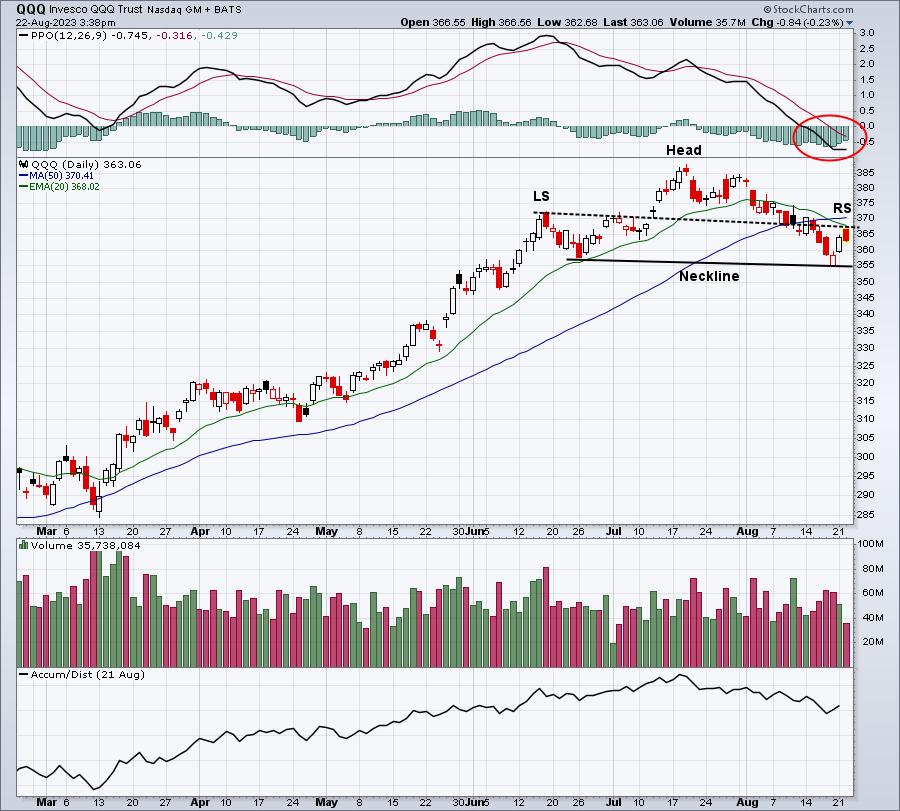
There's a POTENTIAL head & shoulders top in place that, if broken to the downside, could measure to as far as 320 to the downside. I say "potential" head & shoulders, because I pay little attention to topping H&S patterns during a secular bull market advance, unless they execute with a breakdown. With Fed Chief Jerome Powell set to talk from Jackson Hole on Friday, there's a catalyst looming.
If we move out further from a time perspective, we'll see successful 20-week EMA tests thus far across most key areas. Let's see how this all plays out.
Sector/Industry Focus
Consumer staples (XLP) represent the more defensive side of consumer spending. While I don't look for relative strength from this group during secular bull market advances, I do expect to see key levels of absolute price support hold. Right now, the XLP is testing one of these key price support levels:
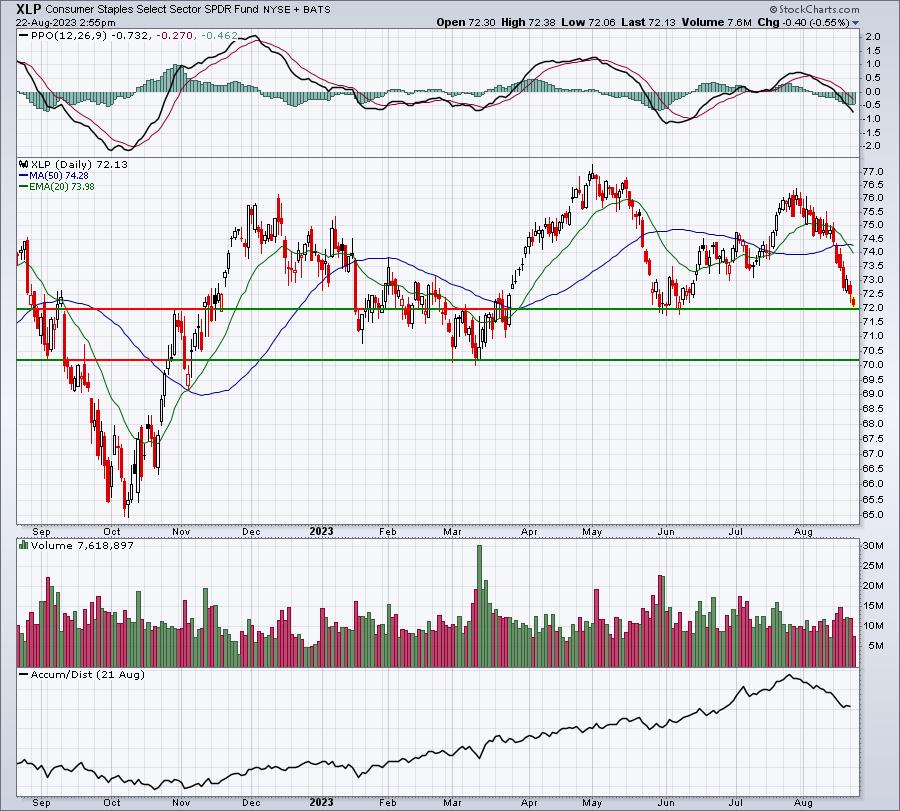
72 provided excellent price support back in late May and early June and we're there again. Again, I'm not looking for leadership from this sector, just participation.
ChartLists/Strategies
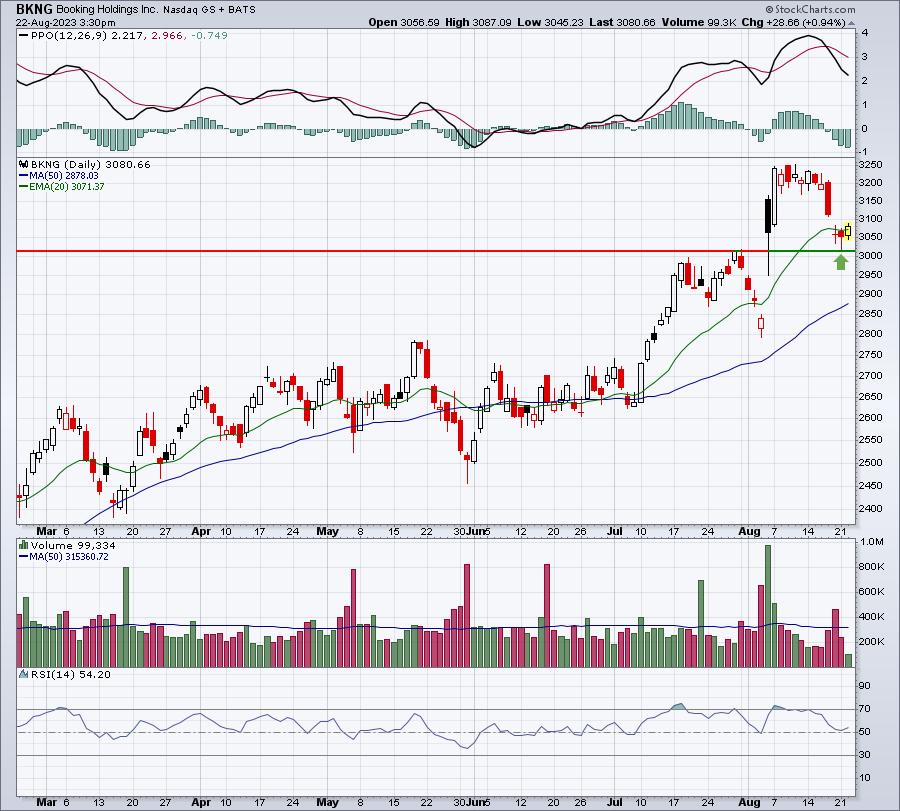
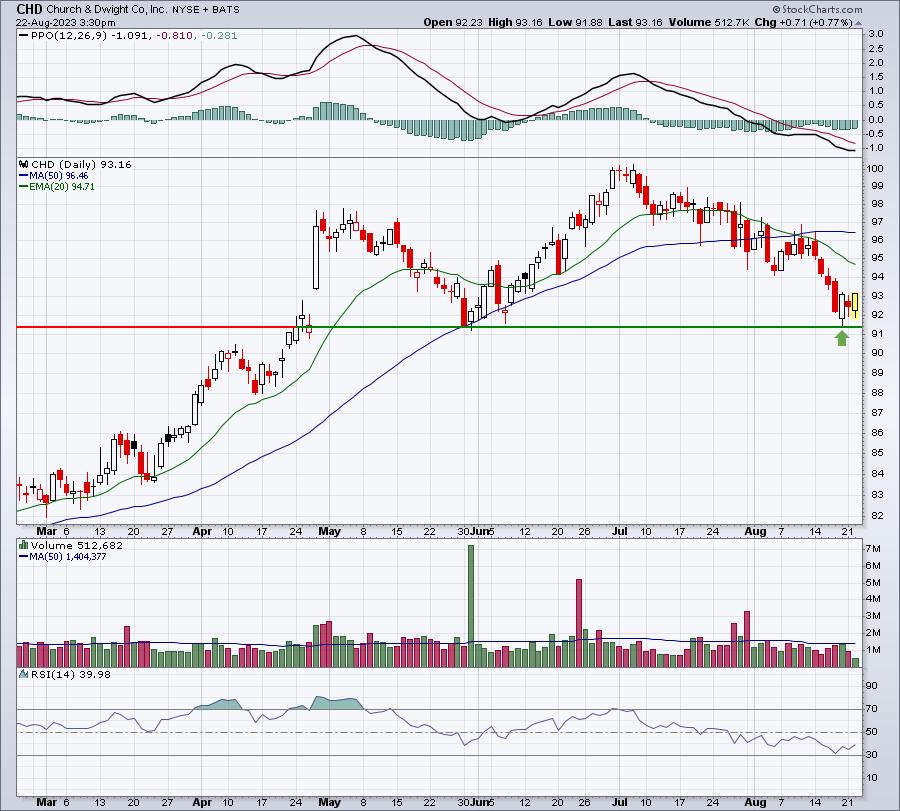
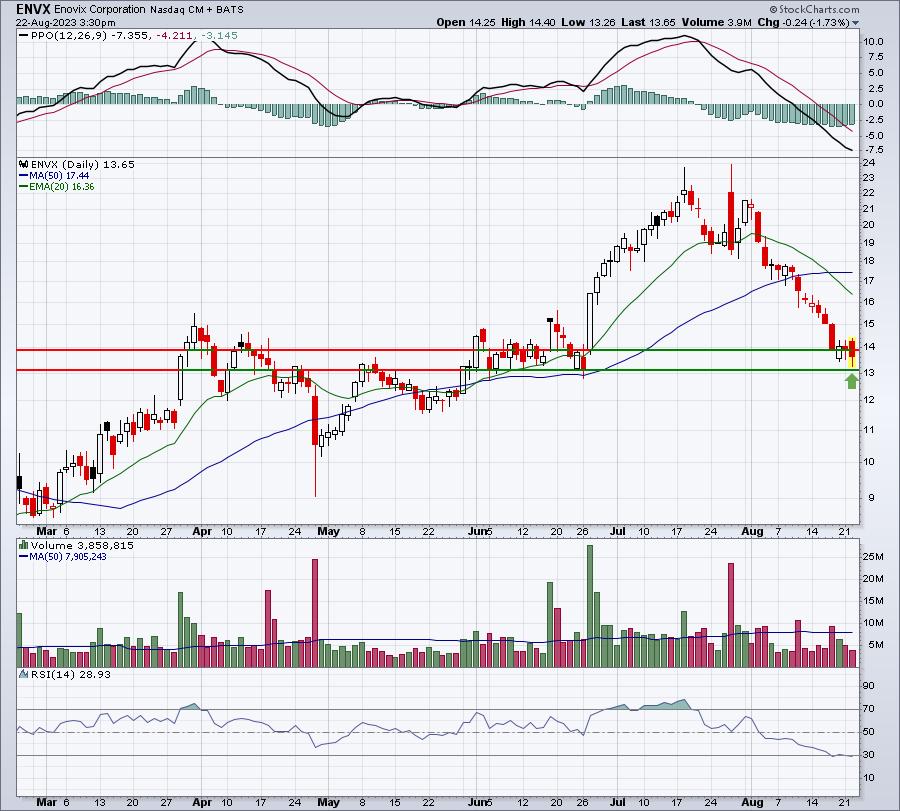
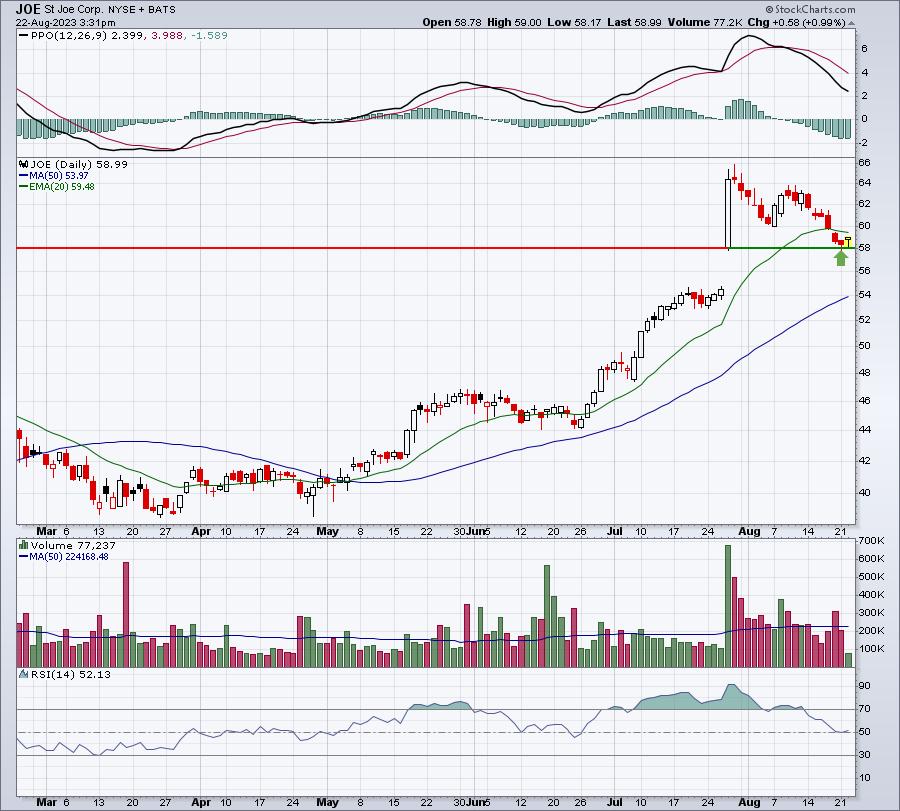
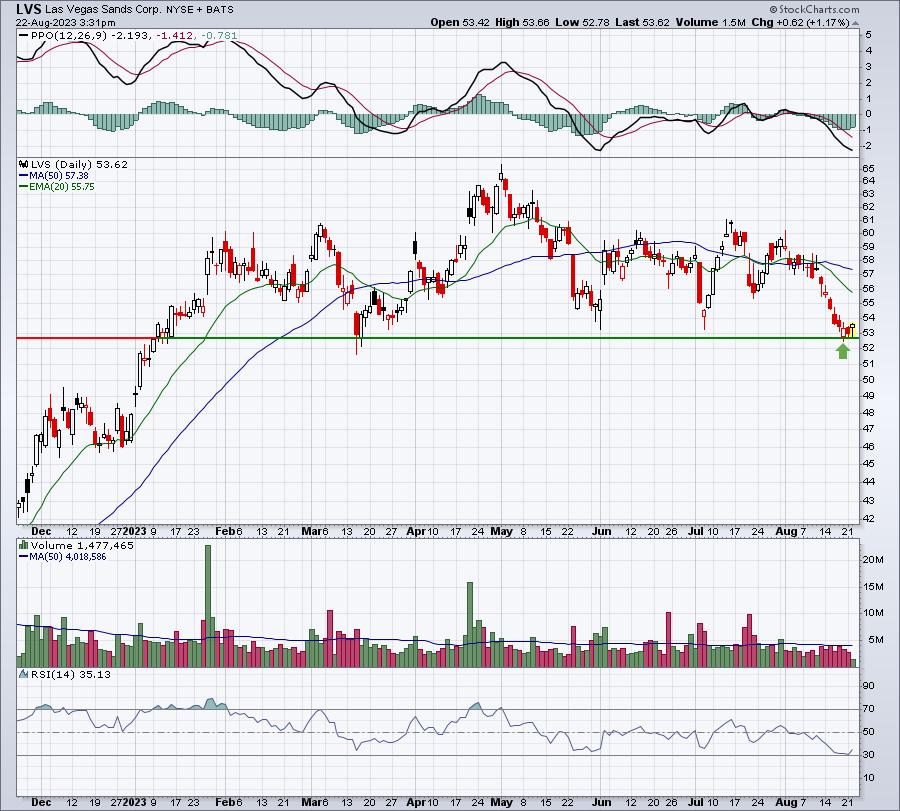
From the Downtrend Reversal scan, check these out:
BKNG:
CHD:
ENVX:
JOE:
LVS:
SWI:
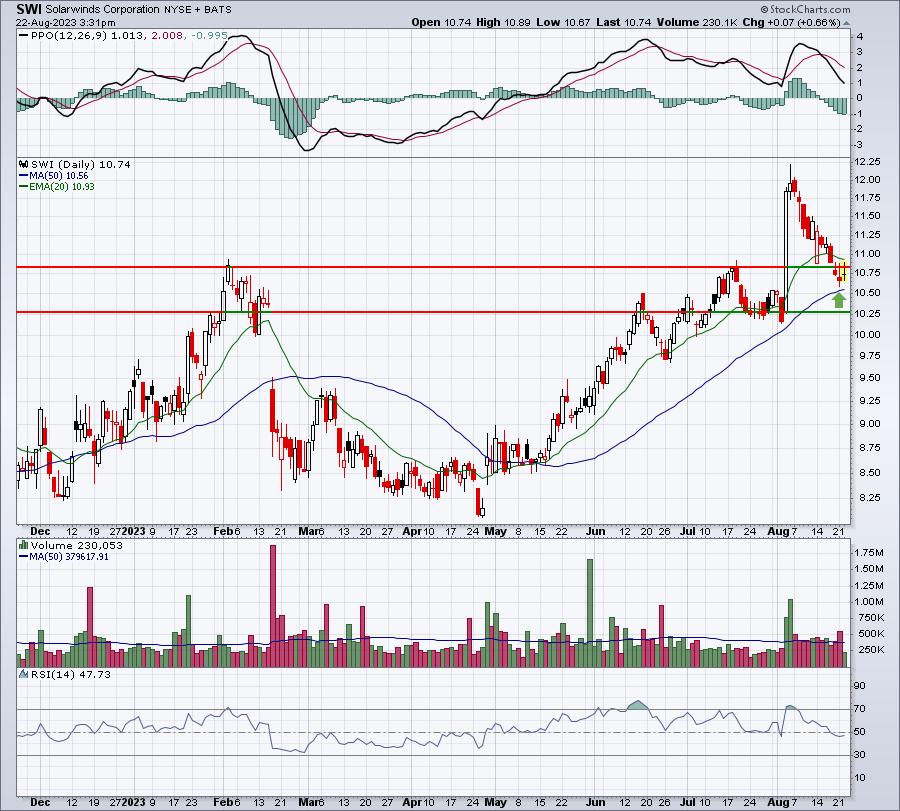
The green arrows mark key support tests just prior to today's higher daily high printing.
Earnings Reports
Here are the key earnings reports for the next two days, featuring stocks with market caps of more than $10 billion. I also include notable companies with market caps below $10 billion. Finally, any portfolio stocks that will be reporting results are highlighted in BOLD. If you decide to hold a stock into earnings, please understand the significant short-term risk that you are taking. Please be sure to check for earnings dates for any companies that you own or are considering owning.
Tuesday, August 22:
LOW, MDT, BIDU, DKS, COTY, BJ, TOL, M, URBN, CSIQ
Wednesday, August 23:
NVDA, ADI, SNOW, ADSK, SPLK, NTAP, GRAB, WSM BBWI, AAP, KSS, DY, PTON, FL, ANF, ZUO, GES
Economic Reports
July existing home sales: 4,070,000 (actual) vs. 4,150,000 (estimate)
Happy trading!
Tom