
EB Daily Market Report - Thursday, August 31, 2023
Executive Market Summary
- Futures were solid overnight and our major indices gapped higher
- We've since weakened, especially on the Dow Jones, which was the early leader and is now the clear laggard
- Cryptocurrencies are under pressure today, as bitcoin ($BTCUSD, -3.74%) drops over 1000 points
- Gold ($GOLD, -0.27%) is lower, but currently range bound from 1915-2009; it's currently at 1973 per ounce
- Crude oil ($WTIC, +2.21%) has spiked back above $83 per barrel, though energy shares (XLE, -0.03%) trade near the flat line
- Strength today is coming from technology (XLK, +0.66%) and consumer discretionary (XLY, +0.58%)
- Broadline retail ($DJUSRB, +2.11%) looks intent on challenging overhead resistance near 3000, led by Amazon.com (AMZN, +2.46%)
- The 10-year treasury yield ($TNX) is drifting lower, down 3 basis points to 4.09%
- Western Digital (WDC, +5.97%) is today's best-performing S&P 500 stock, threatening to bust out above overhead price resistance at 44.97
Market Outlook
Ever since I discussed the equity only put call ratio ($CPCE) signaling a potential market bottom, we've seen rising prices. Well guess what? The nonbelievers are still out there, which is excellent news for those of us in the bullish camp. Check out the S&P 500 chart below, with the 5-day SMA of the CPCE in the panel beneath it:
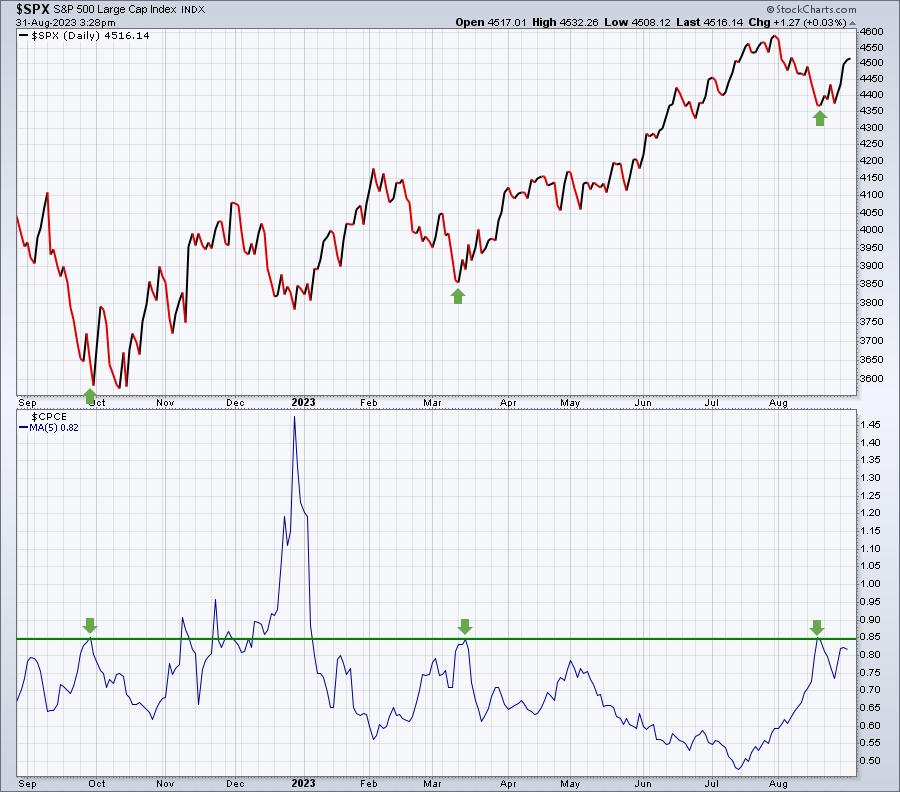
5-day readings that reach .85 historically suggest it's time to "hold your nose" and buy. In the chart above, we need to ignore the readings in November and December. I've discussed this in the past, but these numbers were heavily skewed by hedge funds that were buying huge numbers of puts against the key large cap names like AAPL, MSFT, GOOGL, NVDA, AMZN, TSLA, etc. This did NOT reflect the attitude of retail traders, which is my purpose in studying the CPCE. Those 3 readings with the green arrows marked key turning points in the stock market. August's .85 reading on August 17th marked an absolute perfect bottom. The gap lower on the S&P 500 on August 18th was THE bottom. But look at where this 5-day reading currently resides! It's still at .82! There's still a ton of fear among options traders, so I'd continue to look for higher prices ahead.
Sector/Industry Focus
As we entered May, I discussed that growth stocks LOVED the months of May, June, July, and August. Well, today is the last day of August. So what happens from now through year end? Growth isn't usually in a good mood during the next four months. To illustrate, let's look at two relative strength seasonality charts, IWF vs. IWD and QQQ vs. SPY:
IWF:IWD
This represents large cap growth (IWF) vs. large cap value (IWD). Let's look at this seasonality chart on a relative basis:
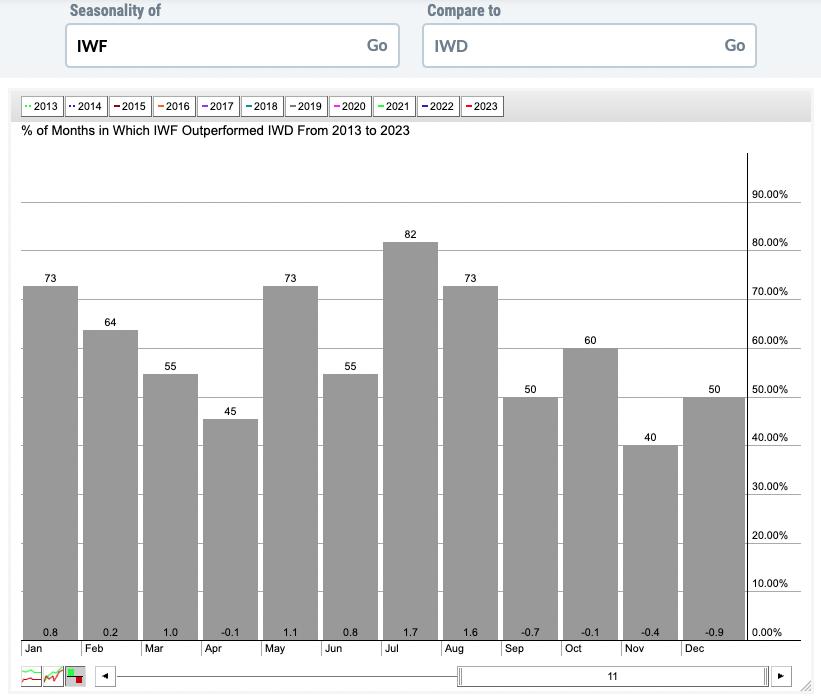
The above chart provides us how the IWF has performed relative to the IWD for each calendar month over the past 11 years. It was on April 10, 2013 that the S&P 500 finally cleared its highs from 2000 and 2007. So the above chart provides us the relative performance of the IWF vs. IWD during this secular bull market, now roughly 10.5 years old.
From January through August, the IWF averaged outperforming the IWD by 7.1 percentage points. The ONLY down month on a relative basis is April where the IWF underperformed the IWD by a paltry 0.1%.
Now let's look at September through December. The IWF has underperformed the IWD every month in this period, totaling 2.1 percentage points. Historically, the stock market is led by VALUE stocks over the last four months of the year and I won't be surprised if it happens again in 2023.
QQQ:SPY
Now let's look at the more growth-oriented NASDAQ 100 vs. the benchmark S&P 500:
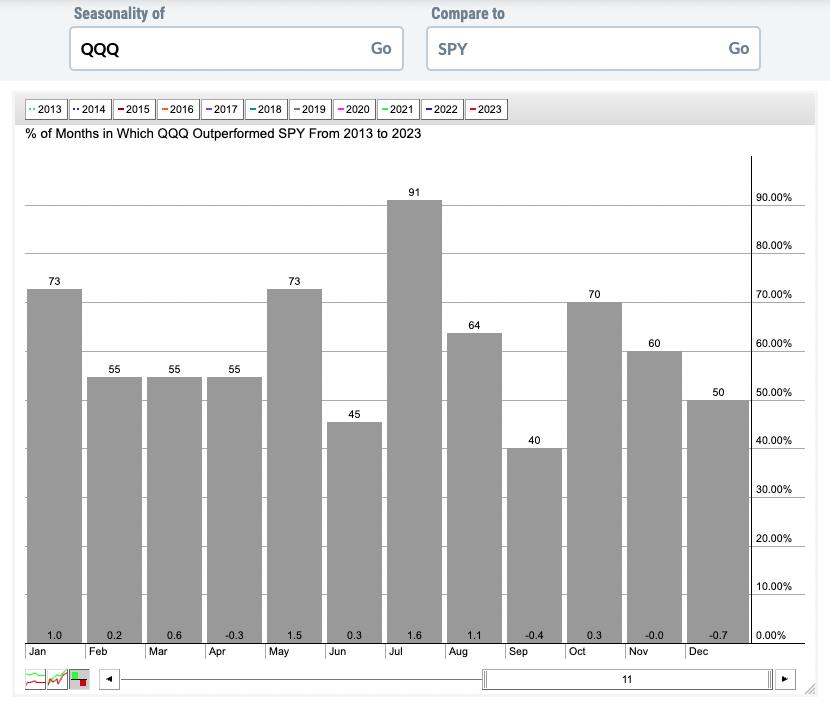
During the first 8 months of the calendar year, the QQQ averages outperforming the SPY by 6.0 percentage points. However, the script is flipped from September through December as the QQQ averages underperforming the SPY by 0.8 percentage points.
Here's the bottom line. We should expect to see better performance by value stocks through year end, though I fully expect nearly every pocket of the stock market to gain ground.
ChartLists/Strategies
I like to work my way through the Strong AD ChartList (SADCL), looking for stocks that are setting up technically. Here are two from this ChartList, one at key price support and the other setting up nicely in a bullish continuation pattern:
AAN:
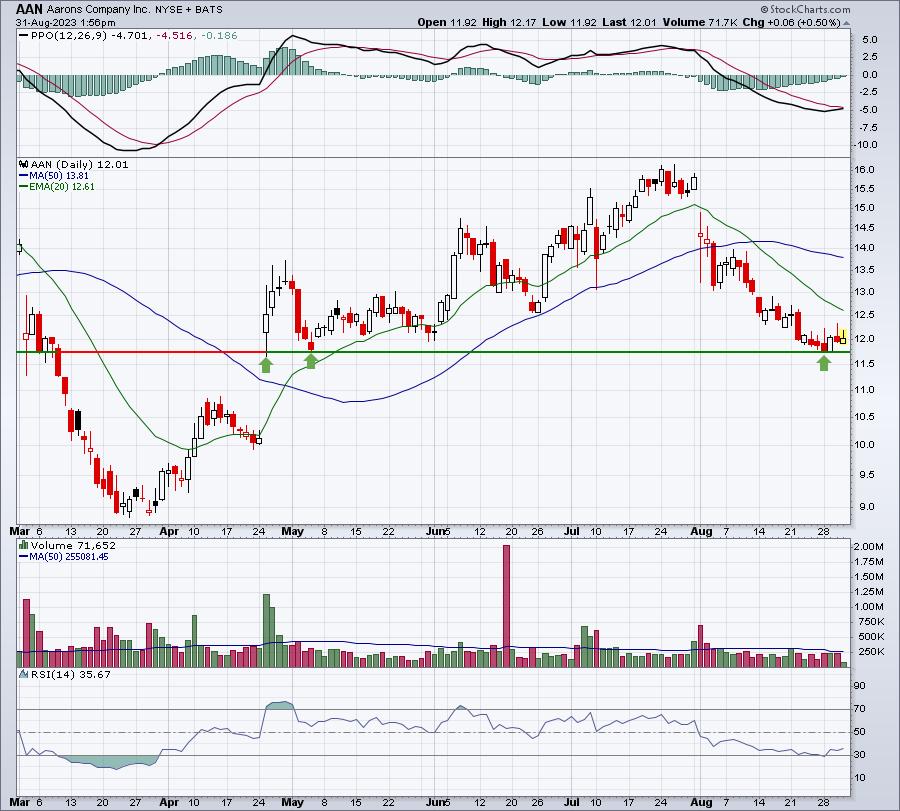
Since the April earnings report gap higher, AAN has held this 11.75 support level. The PPO is turning higher and about to cross its trigger line. AAN is also coming off of overbought conditions, evidenced by the recent reading on the RSI below 30.
Any position here should also have a closing stop in that 11.70-11.75 area.
DBX:
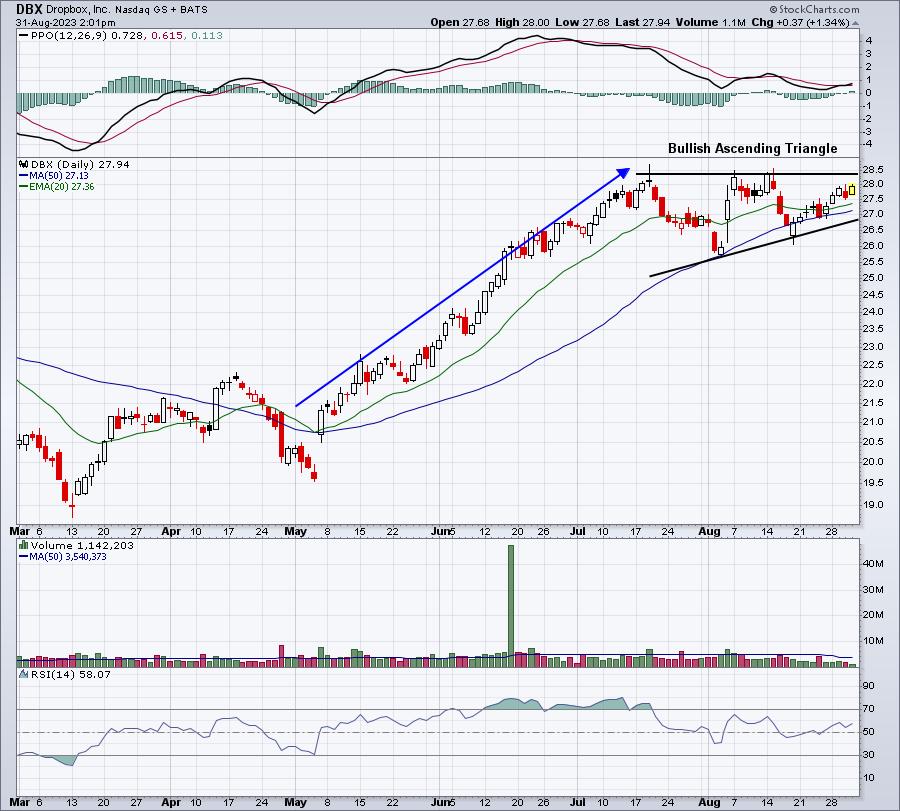
This is the type of bullish continuation pattern that I look for after a lengthy advance. Watch 28.40-28.50 overhead price resistance. A breakout initially measures to 31 or so.
Earnings Reports
Here are the key earnings reports for the next two days, featuring stocks with market caps of more than $10 billion. I also include notable companies with market caps below $10 billion. Finally, any portfolio stocks that will be reporting results are highlighted in BOLD. If you decide to hold a stock into earnings, please understand the significant short-term risk that you are taking. Please be sure to check for earnings dates for any companies that you own or are considering owning.
Thursday, August 31:
AVGO, VMW, LULU, DELL, CM, DG, MDB, HRL, BEKE, IOT, CPB, NTNX, CIEN, ESTC, OLLI, SIGN, MOMO
Friday, September 1:
None
Economic Reports
Initial jobless claims: 228,000 (actual) vs. 238,000 (estimate)
July personal income: +0.2% (actual) vs. +0.3% (estimate)
July personal spending: +0.8% (actual) vs. +0.6% (estimate)
August Chicago PMI: 48.7 (actual) vs. 44.6 (estimate)
Happy trading!
Tom