
EB Daily Market Report - Tuesday, September 5, 2023
ChartLists
I updated 6 ChartLists over the weekend and they have been updated on our website:
- Seasonality (SEASCL)
- Short Squeeze (SSCL)
- Strong Earnings (SECL)
- Strong Future Earnings (SFECL)
- Raised Guidance (RGCL)
- Bullish Trifecta (BTCL)
Executive Market Summary
- Futures were mostly lower overnight and our major indices have spent day up or down slightly
- Small and mid caps showed leadership on Friday, but have given it back today, lagging well behind the others
- Crude oil ($WTIC, +1.22%) has spiked above $86 per barrel, though most other commodities are lower; silver ($SILVER, -2.86%) continues to back off from its test of overhead resistance near 25.50
- The 10-year treasury yield ($TNX) has jumped 9 basis points to 4.26%
- Many times, financials (XLF, -0.79%) and industrials (XLI, -1.56%) rise with the TNX, but that is not the case today
- Energy (XLE, +0.63%) is leading all sectors today, with technology (XLK, +0.47%) close behind; materials (XLB, -1.67%) is lagging along with the XLI
- Software ($DJUSSW, +0.96%) is helping to mitigate potential losses on the SPY and QQQ (see Sector/Industry Focus below)
- Tesla (TSLA, +5.00%) is having a strong session, leading all stocks in the S&P 500
Market Outlook
Uptrends many times simply run out of steam and require a period of selling/consolidation. Many traders view these periods as the start of something much worse, but often times it's nothing more than a "reset" on momentum, before another uptrend begins. In July, I discussed the short-term warning signs that pointed to potential period of consolidation/selling and now we've seen it. During these periods, I look for signs of continuation patterns and currently I see two. Check this out:
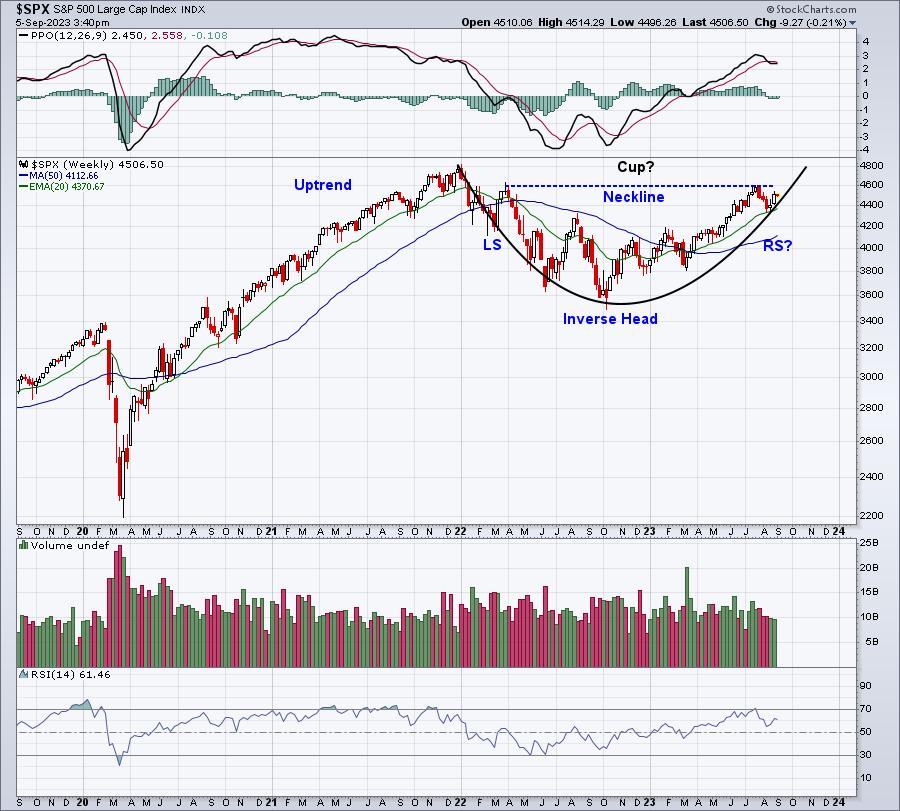
The black pattern is that of a cup. In order to "finish" the pattern, we'd need to see a move up to or slightly above 4800, with a short period of selling to establish a handle. The beauty here, if this pattern were to execute, is that the measurement would be from the top of the cup to the bottom, or roughly 1300 points. Add that to the breakout level and it provides us a potential target to 6100+.
The second potential bullish continuation pattern could be an inverse head & shoulders pattern and this potential pattern is shown in blue. There's still some ambiguity as to how this potential inverse right shoulder might form. Perhaps it's already complete OR a trip down to 4200 (even past my key support on the S&P 500 from 4305-4330) could still be in the cards. A breakout above the neckline near 4600 measures from the neckline down to the inverse head, or roughly 1100 points. That initial measurement would lift the S&P 500 to 5700.
Clearly, both of these patterns, if they execute would suggest very bullish action for later in 2023 and into 2024.
Sector/Industry Focus
Software ($DJUSSW) is having another nice day, moving further and further away from its recent low and recapturing its moving averages in the process:
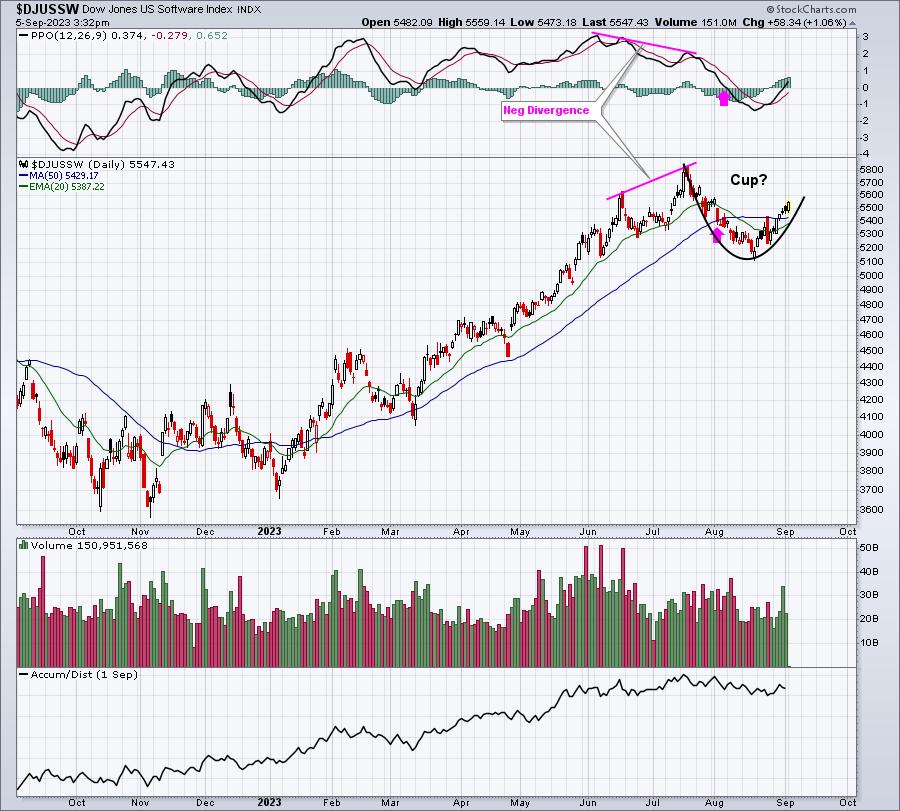
The negative divergence on the daily chart has played out and it no longer is providing us any clues. However, we do still have evidence of potential slowing momentum on the weekly chart:
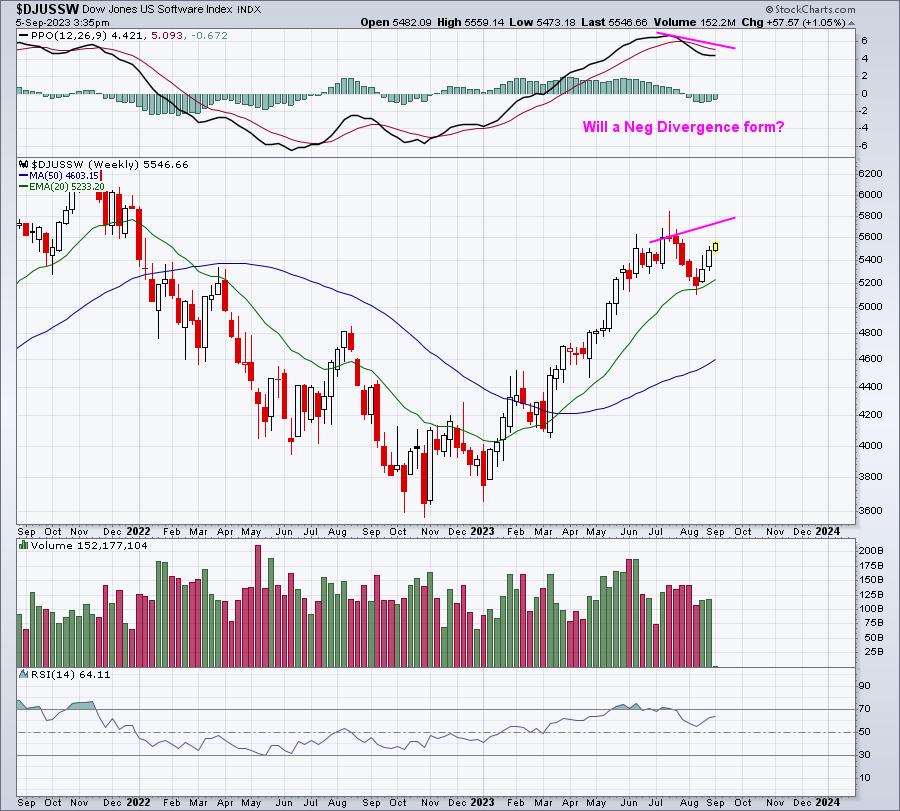
If this occurs, it could present further difficulty later in September.
ChartLists/Strategies
September is most definitely one month during the year where we should lower our expectations. While I remain very bullish U.S. equities heading into year end, I do view the next 4 weeks or so as a "bridge" between our current period of consolidation and our future break above 4600 on the S&P 500. As I mentioned on my TP Live show this morning, this is not a time to get overly exposed on the long or short side. I have no plans to use leverage, unless recent lows are retested or approached. Even then, I'd likely consider only a small percentage of leverage - similar to what I used last week.
In the meantime, my plan is to trade the major ETFs (SPY, QQQ, IWM) and watch the rotation, if any, that takes place to begin to develop my plan for Q4.
Earnings Reports
Here are the key earnings reports for the next two days, featuring stocks with market caps of more than $10 billion. I also include notable companies with market caps below $10 billion. Finally, any portfolio stocks that will be reporting results are highlighted in BOLD. If you decide to hold a stock into earnings, please understand the significant short-term risk that you are taking. Please be sure to check for earnings dates for any companies that you own or are considering owning.
Tuesday, September 5:
ZS, GTLB, HQY, ASAN, AVAV, BRC
Wednesday, September 6:
CPRT, PATH, DSGX, GME, CXM, AI, AEO, CHPT, INTA, VRNT, PLAY, PHR, PLAB, YEXT
Economic Reports
July factory orders: -2.1% (actual) vs. -2.6% (estimate)
Happy trading!
Tom