
EB Daily Market Report - Wednesday, September 6, 2023
Executive Market Summary
- Futures were lower overnight and we began the day in negative territory, except for small and mid caps, which seem to be doing the opposite now
- It's been a day of mostly selling/distribution, but we are seeing a bit of afternoon strength, at least in the past hour
- Small and mid caps have shown relative strength throughout the session and continue to do so
- The 10-year treasury yield ($TNX) is on the move higher once again, jumping 3 basis points today to 4.30%
- The CPI and PPI reports due out next week pose considerable risk; if they show inflation higher than expected, we could see another surge in rates, potentially a catalyst for another 2nd half of September swoon
- The key overhead yield resistance on the TNX is at 4.33%-4.35%
- Crude oil prices ($WTIC, +1.44%) are closing in on $88 per barrel, a level not seen since mid-November 2022
- Utilities (XLU, +0.13%) is the only sector in positive territory today; the aggressive technology (XLK, -1.16%) and consumer discretionary (XLY, -1.02%) lead the laggards to the downside
- Computer hardware ($DJUSCR, -3.54%) is a problem for the bulls as Apple, Inc. (AAPL, -3.69%) is on the verge of losing its rising 20-day EMA again
Market Outlook
For those who believe this market will soon be in free fall, I have a "risk-on" chart that I'd like to share. As the stock market has moved higher throughout 2023, money has been heavily invested in areas of the market considered higher risk. In other words, growth stocks have outperformed value stocks. Aggressive sectors have outperformed defensive sectors. This has never been a recipe for market disaster ahead.
The following chart of the S&P 500 shows a number of intermarket relationships in the panels beneath it. This is a chart that I review periodically, but I hadn't discussed it in a DMR in awhile. I thought today would be a good time, especially as we see prices move lower over the past couple sessions. Check this out:
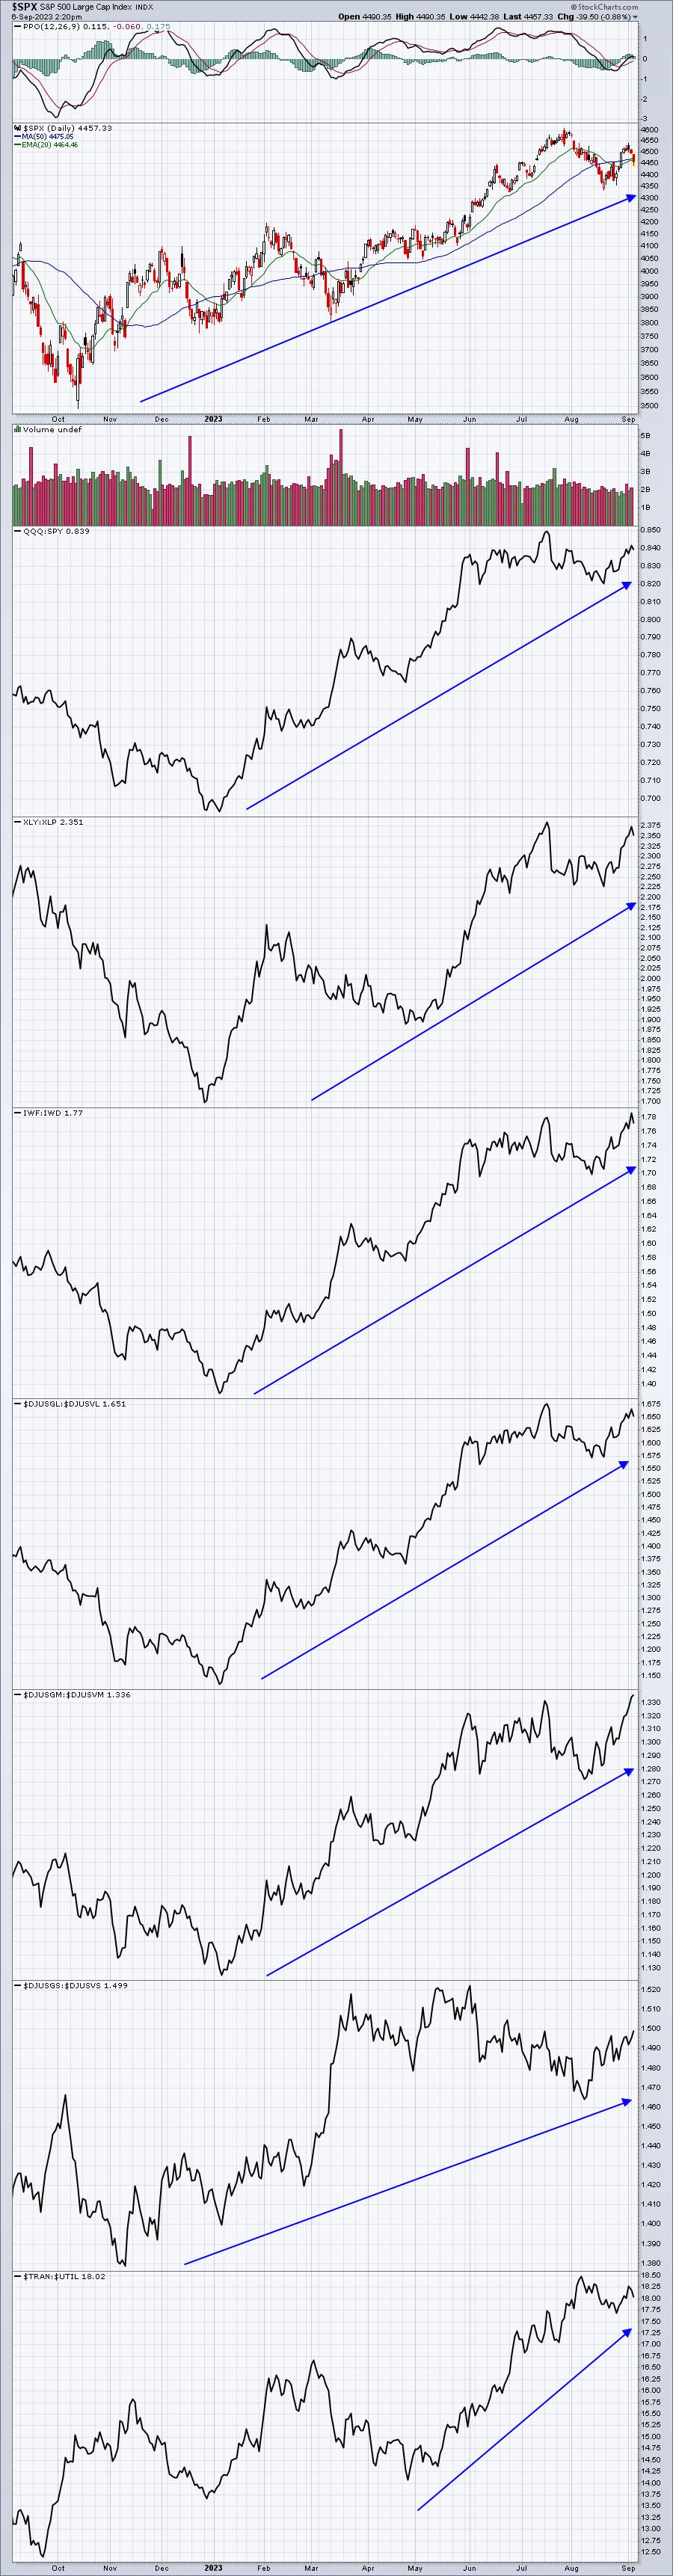
EVERY ONE of my sustainability ratios is moving higher with S&P 500 price action. There are no warning signs. From a sentiment perspective, the 5-day SMA of equity only put call ratio ($CPCE) recently hit .85, suggesting a market bottom. We saw the 253-day SMA of the CPCE roll over some time ago, suggesting a long-term market advance was underway. While a few areas do show momentum issues, I fully expect that proceeds from any selling in those areas will simply rotate into other areas, namely industrials and financials in Q4. Energy, materials, and health care could also benefit from this rotation. Remember, wide participation is what lifts and sustains secular bull markets. I believe we'll see more of it during Q4, lifting U.S. equities.
When I look at all of my charts, all of my signals, I see nothing but bullishness. So I don't care what anyone is saying on CNBC. I don't care if a big hedge fund announces they've sold a gazillion shares of the market and that they're going to short. I don't care what other technical analysts might be saying. I've developed my own signals for calling the market and they've proven to be excellent. Let the others say what they may. After September, we're going higher.
Sector/Industry Focus
Semiconductors ($DJUSSC) are having a very rough session and, quite honestly, it could be a precursor of what we should expect through the balance of the year. Perspective is important not only when it comes to calling the overall market, but also when we look at sectors, industry groups, and individual stocks. The DJUSSC is up more than 100% since last October's cyclical bear market bottom. That is NOT sustainable. We get so used to it rising that we believe it MUST continue. It doesn't have to continue and it most likely won't. I believe there's tremendous risk in the group currently. Several of the leaders may hold up better than others, but we should really begin to lower our expectations on this group. Here's a daily chart:
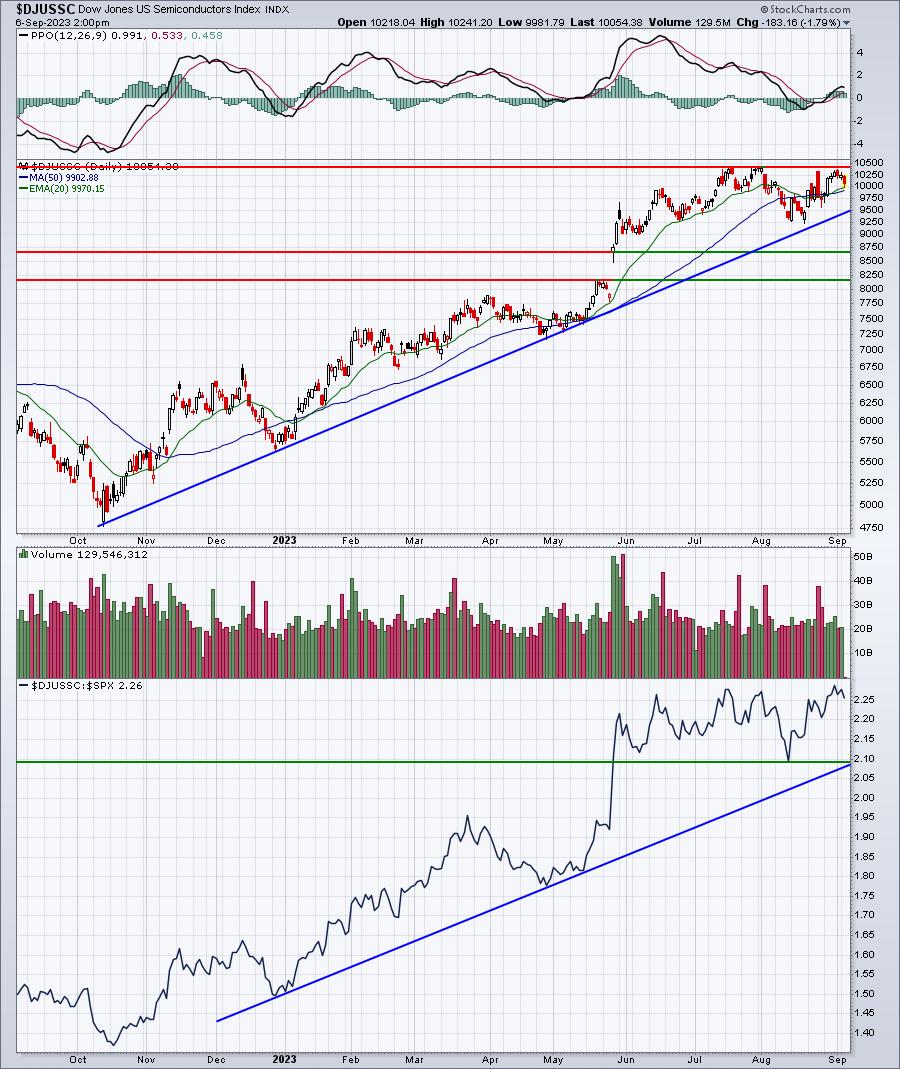
A simple trip lower to test its absolute price trendline and/or its relative price trendline would be very normal, and really, we should expect it. I think there's a chance that the DJUSSC could drop back to those price support lines at 8200/8700. That type of selling in semis would likely result in significant rotation into areas like industrials (XLI) and financials (XLF). Historically, we see that often in Q4, so the theory is not far fetched.
ChartLists/Strategies
We hosted our LIVE trading room at 10:00am ET this morning and I'll discuss two trades that were made:
RCL:
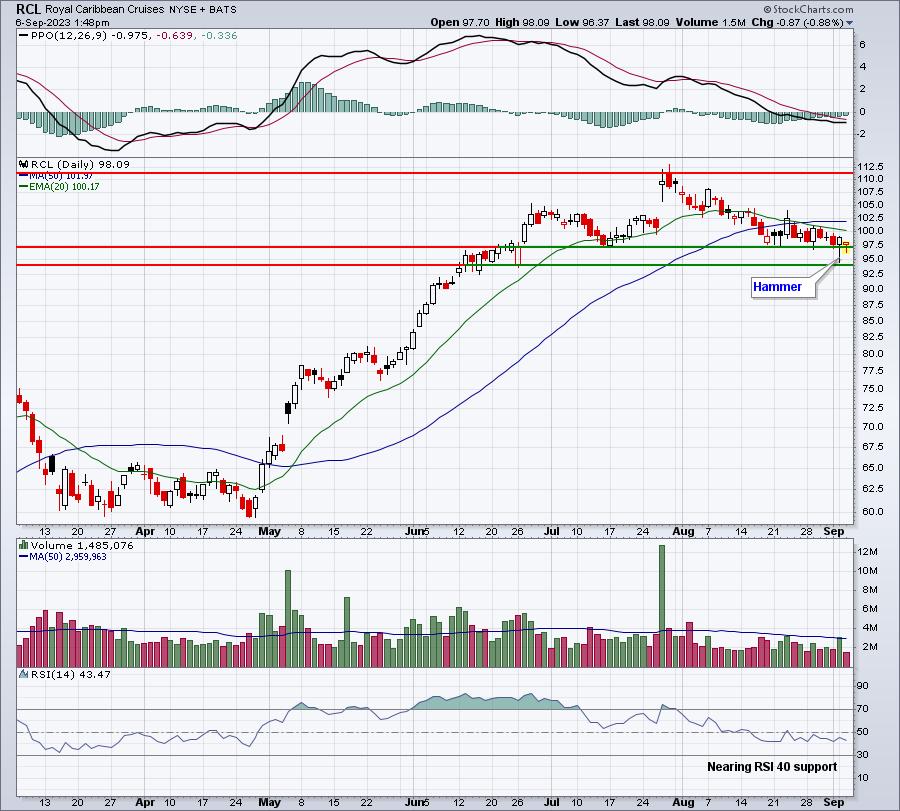
RCL was picked up off of our RSI 40-50 scan, which is one of the predefined scans that is included on our website. After getting the results of the scan, we sorted those results in SCTR order, highest to lowest. From there, we concentrated on SCTR scores above 70. A SCTR score above 70 tells us that the stock shows decent relative strength and the RSI in the low 40s represents a level where technically-sound stocks tend to reverse. RCL shows excellent price support in the 94-97 range. I bought one-half of my RCL shares at 97.60 this morning and placed a good-til-cancelled limit order at 94.75. I'd consider giving RCL a bit of room to the downside, perhaps 92-93, where I'd keep a closing stop in play. In the meantime, I believe it's quite possible that RCL rebounds back to its recent high in the 112-113 area. RCL is also a part of the recreational services industry ($DJUSRQ) that I featured in the EB Weekly Market Report on Monday. That group is currently resting squarely on its rising 20-week EMA and potentially poised to rebound from there.
NVAX:
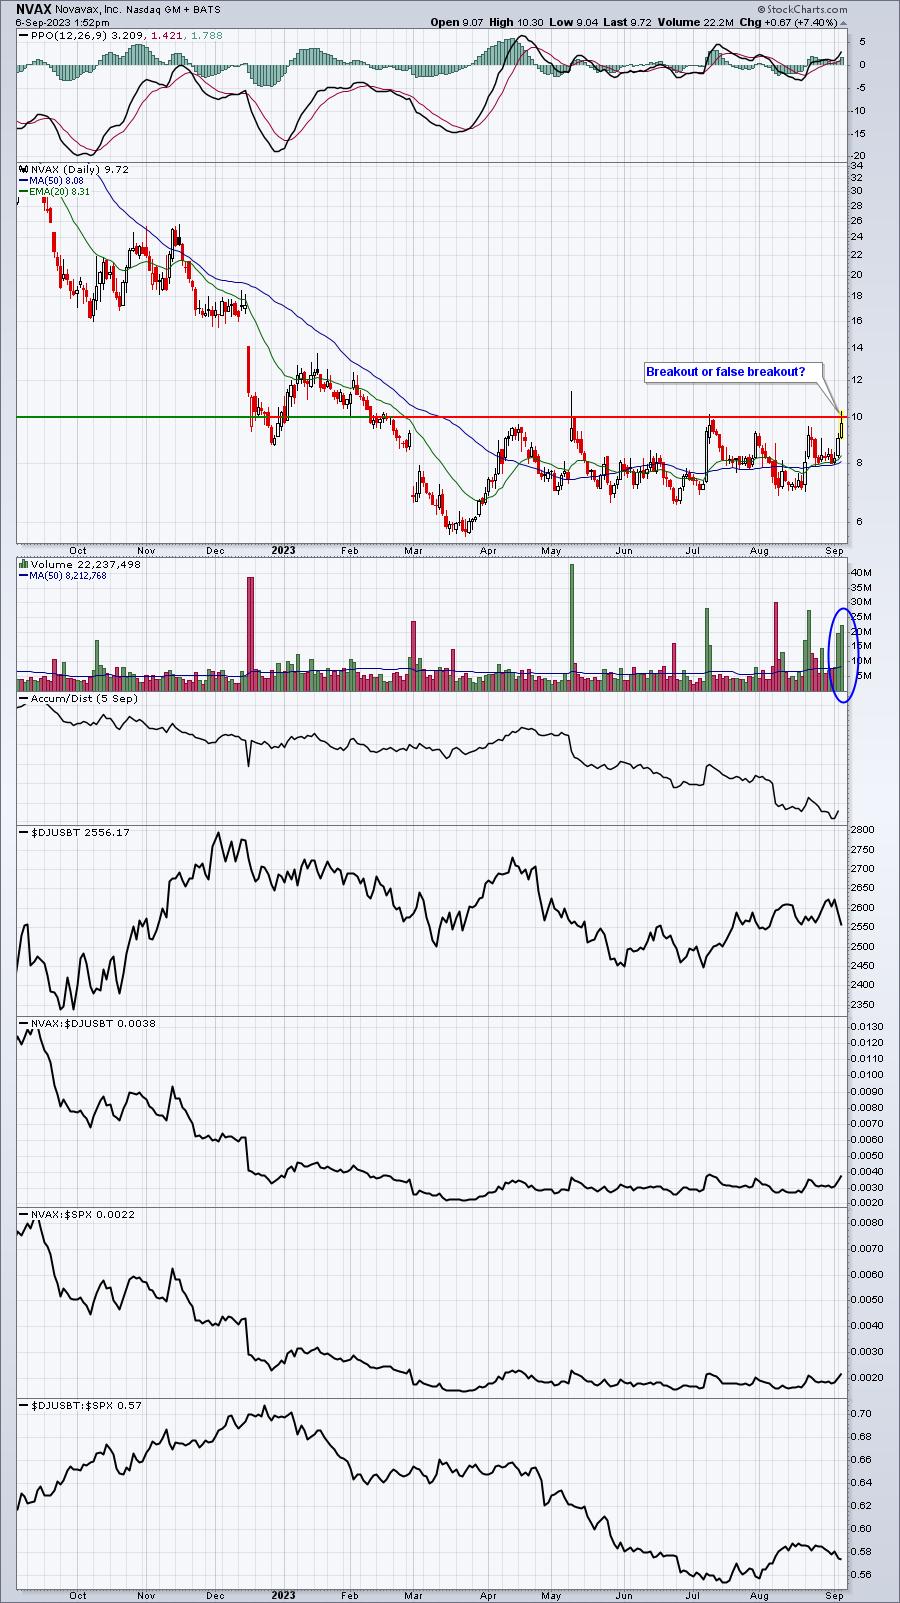
Ok, this one requires any trader to take on significant risk. NVAX is on our Short Squeeze ChartList (SSCL) and currently shows that 45.79% of its float (available shares) has been shorted. Breakouts can trigger massive short squeeze rallies and NVAX has traded an extraordinary number of shares already today (2.4x average volume with over 2 hours left in the trading day). NVAX could be on the cusp of a massive short squeeze rally OR it could be in process of topping once again at the $10 level. NVAX could be at 7-8 at the end of this week or it could be at 15. It literally is like playing the roulette wheel in Vegas. Pick black or red. What we do know, however, is that there are a TON of short sellers and NVAX is currently the most heavily-shorted stock in the market. I take small positions in short squeeze stocks so that I can manage downside risk. My NVAX position, taken earlier at 10.03, will be roughly 1/6 of my RCL position if the 94.75 limit order executes on RCL. If NVAX finishes the afternoon stronger and looks to close above 10, I'll likely add to my position, expecting a gap higher in the morning. We'll see, but PLEASE keep in mind the SERIOUS RISK that's inherent in a potential short squeeze stock like this one.
Earnings Reports
Here are the key earnings reports for the next two days, featuring stocks with market caps of more than $10 billion. I also include notable companies with market caps below $10 billion. Finally, any portfolio stocks that will be reporting results are highlighted in BOLD. If you decide to hold a stock into earnings, please understand the significant short-term risk that you are taking. Please be sure to check for earnings dates for any companies that you own or are considering owning.
Wednesday, September 6:
CPRT, PATH, DSGX, GME, CXM, AI, AEO, CHPT, INTA, VRNT, PLAY, PHR, PLAB, YEXT
Thursday, September 7:
TTC, DOCU, RH, GWRE, SAIC, SMAR, BRZE, ABM, KFY, SMTC, MEI
Economic Reports
August ISM services: 54.5 (actual) vs. 52.4 (estimate)
Beige book to be released at 2:00pm ET
Happy trading!
Tom