
EB Daily Market Report - Tuesday, September 12, 2023
Executive Market Summary
- Futures were lower overnight and our major indices opened lower today
- The Russell 2000 (IWM, +0.02%) is showing relative strength as the other indices are much lower on a percentage basis
- Bitcoin ($BTCUSD, +3.88%) is bouncing off key 25,000 support, and it's leading other cryptocurrencies
- Crude oil ($WTIC, +1.84%) is jumping again, this time nearing $89 per barrel; other commodities are mixed
- The 10-year treasury yield ($TNX) is fairly flat at 4.27% as both bond and stock traders prepare for the August CPI data, which will be released tomorrow morning at 8:30am ET
- Energy (XLE, +2.21%) is the clear sector leader, buoyed by higher crude prices
- Financials (XLF, +0.78%) are making a rare strong showing, led by banks ($DJUSBK, +1.88%) and investment services ($DJUSSB, +1.31%)
- Meanwhile, software ($DJUSSW, -2.32%) and computer hardware ($DJUSCR, -2.31%) are weak, triggering a drop in technology shares (XLK, -1.84%)
- Communication services (XLC, 1.04%) is also weak, due primarily to internet stocks ($DJUSNS, -1.43%)
- Oracle Corp (ORCL, -13.28%) is the worst S&P 500 performer, after reporting its latest quarterly results
Market Outlook
The consumer discretionary vs. consumer staples (XLY:XLP) ratio is setting a new recent high, hitting a level of 2.42, which had not been seen since April 2022:
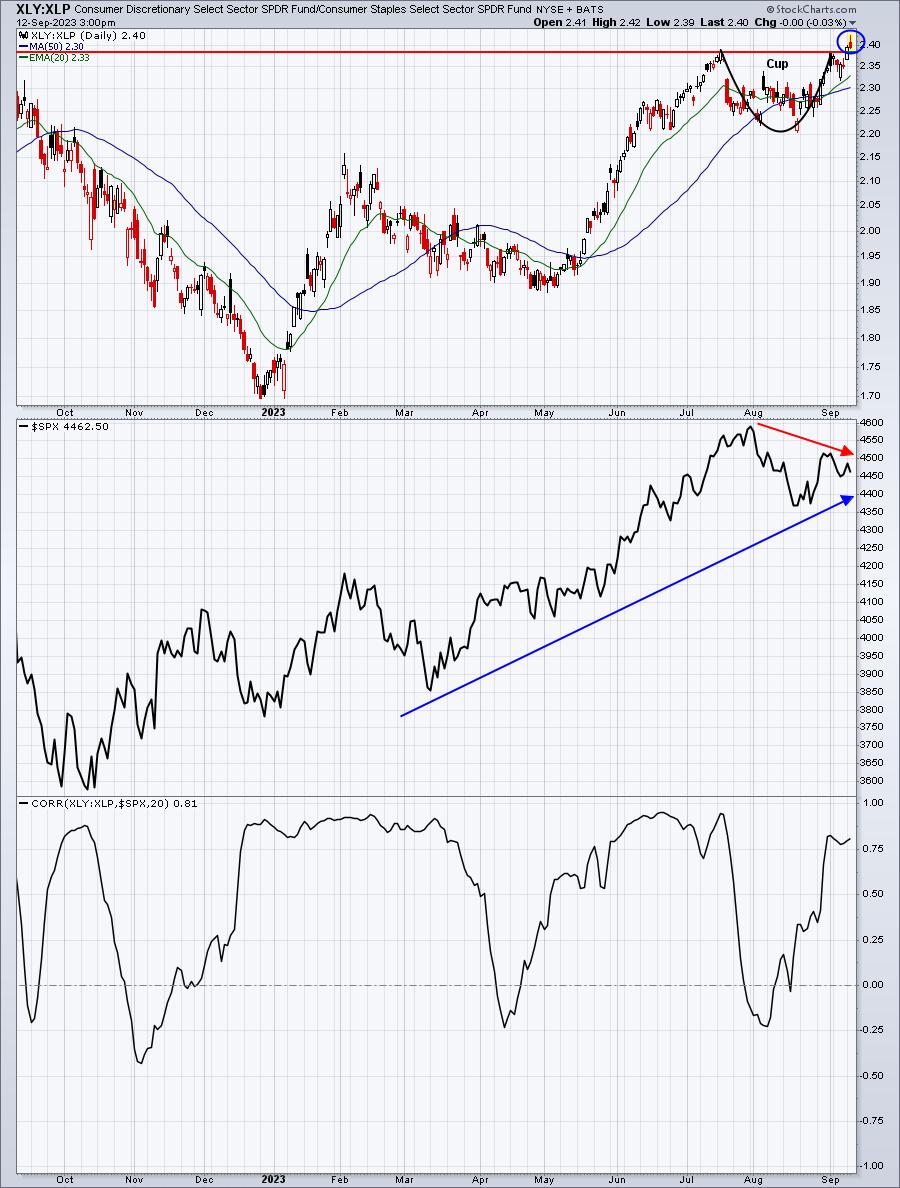
As a reminder, there's a VERY STRONG positive correlation between the direction of the XLY:XLP ratio and the benchmark S&P 500. The fact that the XLY:XLP ratio is breaking out to a 17-month high signals to me that the S&P 500 move through 4600 probably isn't too far behind.
Sector/Industry Focus
I'm using weakness to begin accumulating the industrials sector (XLI). This group loves Q4 as you can see from the following seasonality chart:
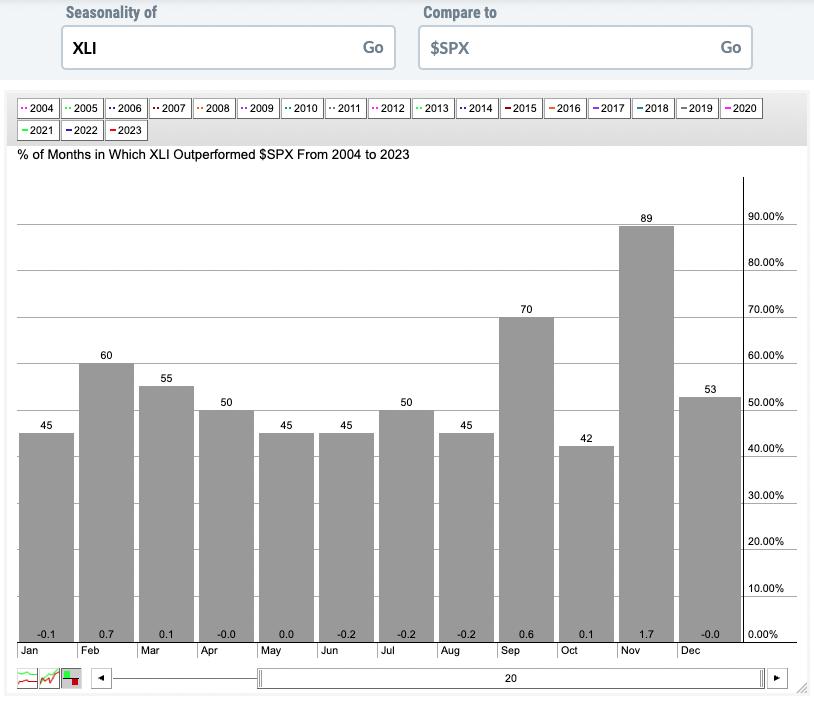
This goes back 20 years and it's the RELATIVE performance vs. the S&P 500. Check out November! But I use seasonal charts as a secondary indicator. The price chart provides me my primary indicator and, technically, this seems like a nice area to begin buying the XLI:
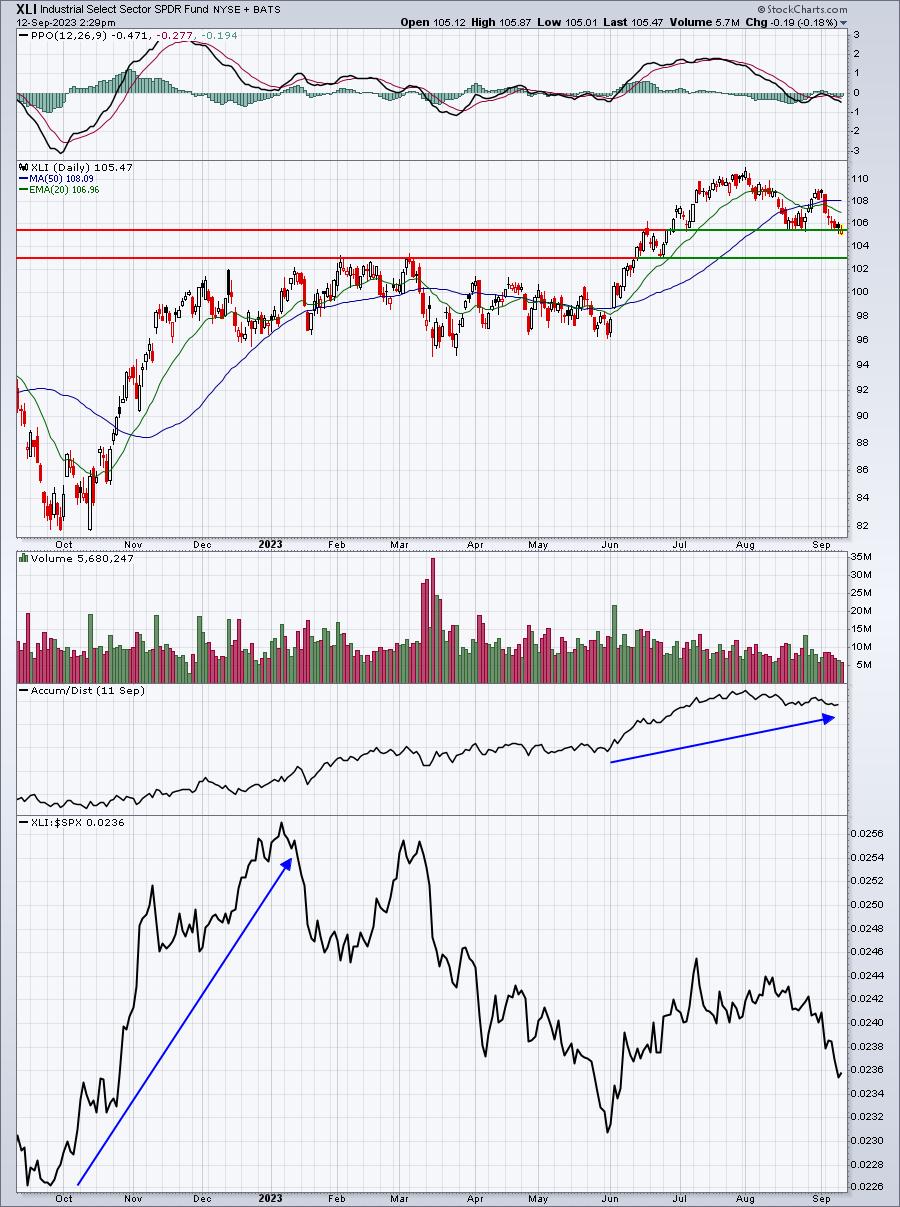
You can see the Q4 relative strength in the XLI from 2022. I'm certainly not expecting that sort of relative performance, but the 103-105 area looks to me to be great support for building a position in the XLI, if it's something that interests you. The AD line has remained fairly strong, despite the 5-6% selloff in price.
ChartLists/Strategies
If you like to trade off rising 20-day EMAs, ETN from the Bullish Trifecta ChartList (BTCL) might be of interest. It's been rising steadily for months and is testing its 20-day EMA for only the third time in the past three months:
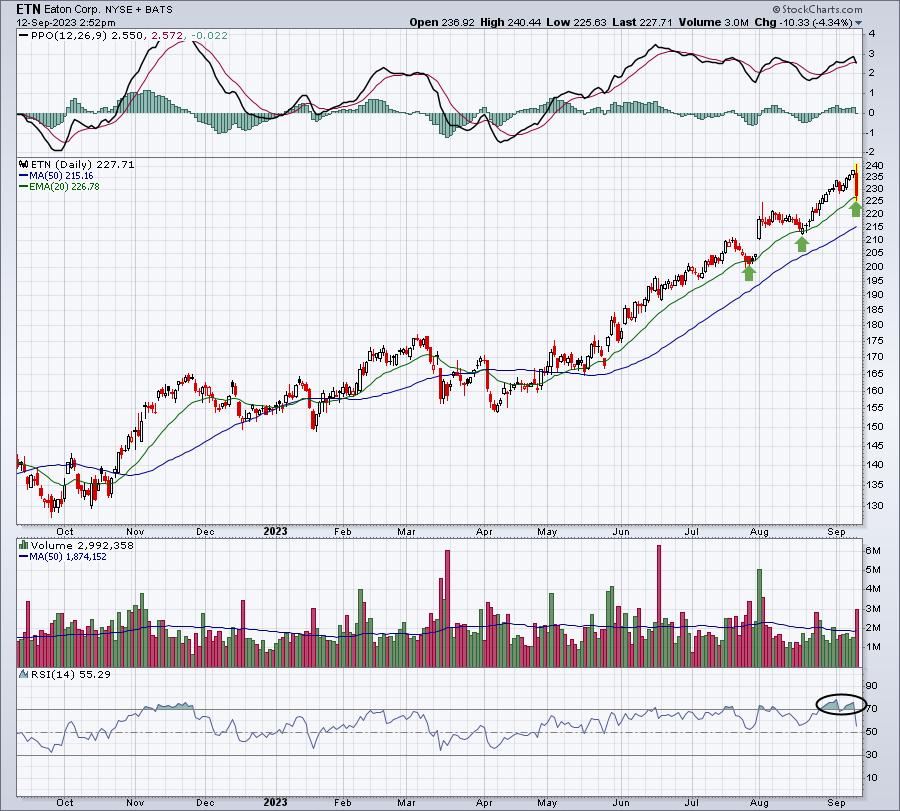
ETN was very overbought prior today's selling, so it's actually a relief. It could morph into more selling, especially if the 20-day EMA fails to provide support into the close. Recent history, however, suggests that this 20-day EMA test is buyable. I'd keep a very tight stop on any close beneath the 20-day EMA, while looking for a short-term rebound to the 235-240 range.
Earnings Reports
Here are the key earnings reports for the next two days, featuring stocks with market caps of more than $10 billion. I also include notable companies with market caps below $10 billion. Finally, any portfolio stocks that will be reporting results are highlighted in BOLD. If you decide to hold a stock into earnings, please understand the significant short-term risk that you are taking. Please be sure to check for earnings dates for any companies that you own or are considering owning.
Tuesday, September 12:
None
Wednesday, September 13:
None
Economic Reports
None
Happy trading!
Tom