
EB Daily Market Report - Friday, September 15, 2023
Charting Forward
StockCharts had a Q3 "Charting Forward" special hosted by David Keller, StockCharts.com's Chief Market Strategist. I was joined by Julius de Kempenaer and Mish Schneider on a panel-like discussion of current market conditions and a look at what could lie ahead in Q4. I enjoyed the discussion and you likely will as well as I provided my latest thoughts on various topics. You can check out the entire YouTube video by CLICKING HERE.
Executive Market Summary
- Futures were lower as we opened for the last day of trading this week
- Our major indices held up fairly well through two inflation reports and a retail sales report this week
- All eyes now turn to the Fed, which will meet next Tuesday and Wednesday to decide our short-term interest rate fate
- The 10-year treasury yield ($TNX) is threatening to break above the October 2022 and August 2023 highs in the 4.33%-4.35% range; we're up 2 basis points to 4.31% after touching 4.34% earlier
- The NASDAQ is our weakest major index, perhaps responding to the recent move higher in the TNX
- Our aggressive sectors are the weakest today, with technology (XLK, -2.00%) leading the way
- Semiconductors ($DJUSSC, -3.11%) are a big reason why
- All 11 sectors are lower on the session
- Meanwhile, crude oil ($WTIC, +0.62%) is now trading above $90 per barrel, its highest level since a double top formed in October/November 2022 just below $94 per barrel
- Semi equipment manufacturers are among the weakest S&P 500 stocks today as Lam Research (LRCX, -5.04%), KLA Corp (KLAC, -4.78%), and Applied Materials (AMAT, -4.68%) are all under pressure
Market Outlook
I talk a lot about perspective when analyzing the stock market. It's normally a very bad idea to form an overall opinion based on just one or two factors. The stock market is a great big jigsaw puzzle and putting together just a couple pieces does you no good. We have to put it ALL together. As part of that strategy, it's always important to look at all timeframes. A very short-term trader might use a 5-day, 10-minute chart. Hourly, daily, and weekly charts also make sense to view - once again to gain perspective. None of these four charts, by itself, does the trick. We need all four (well, the 10-day chart can be ignored by most traders who are not looking to get in and out very quickly). So how does the S&P 500 look, if we review each of the four timeframes?
5-day 10-minute chart:
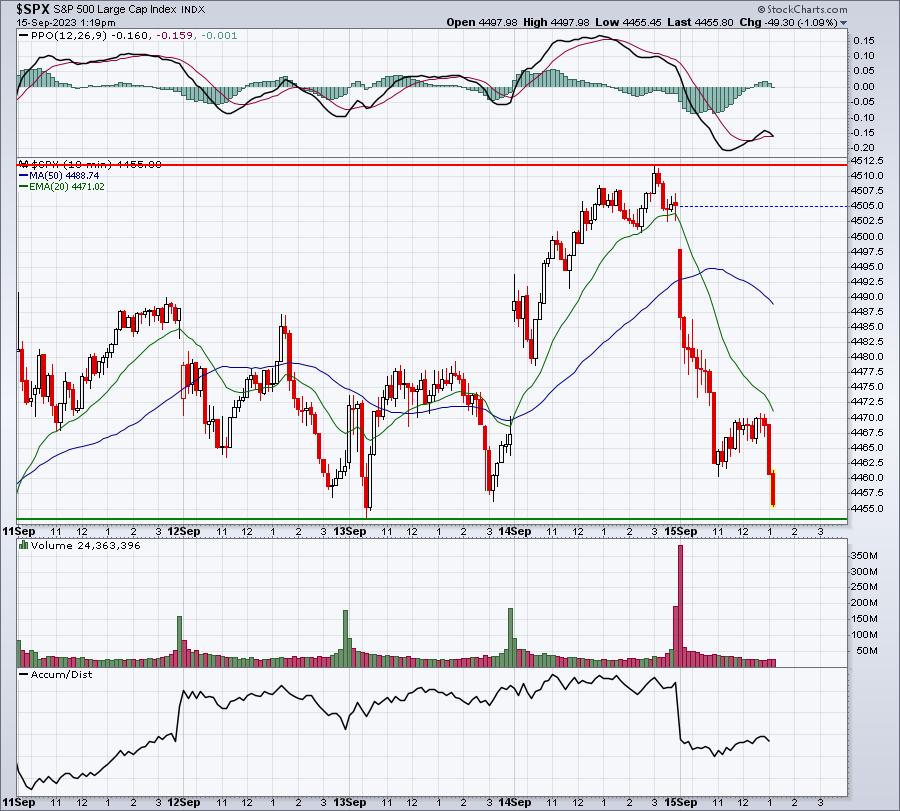
This is what market "chop" looks like. One day, we're up and looking good. The next day, we're right back where we were before. Obviously, I see down action today, but we're trading in a range between short-term resistance at 4512 and short-term support at 4453.
Hourly chart:
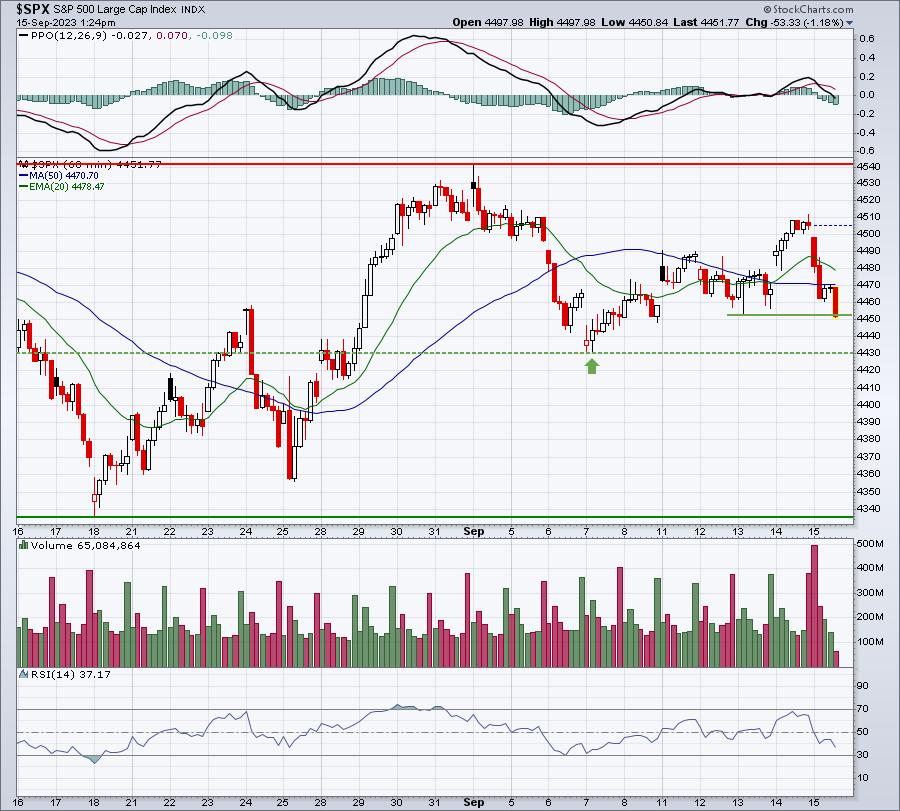
This shows us a much wider range from 4335 support to 4541 resistance. I drew that 5-day 10-minute chart support line of 4453 to show that, on an hourly chart, this support really means little. On this hourly chart, 4430 would seem to provide a bit more support, with the 4335 a larger support level.
Daily chart:
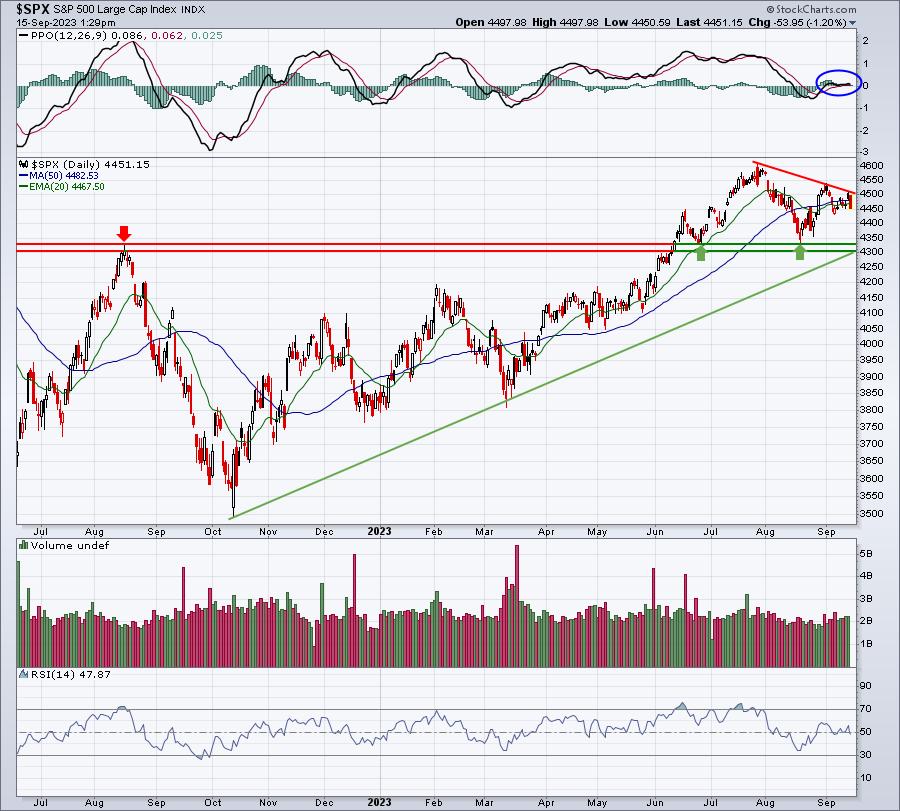
Here's yet another perspective. As we zoom further out, we realize that we have more downside potential, while still remaining in a very significant uptrend. From this daily perspective, we realize that we're in a bull market uptrend, with excellent price support from 4300 (August 2022 high) to 4335 - recent price lows over past few months. The daily PPO is telling us there's no momentum whatsoever in this timeframe as the PPO has been hugging the flat line for the first half of September as we chop back and forth.
Weekly chart:
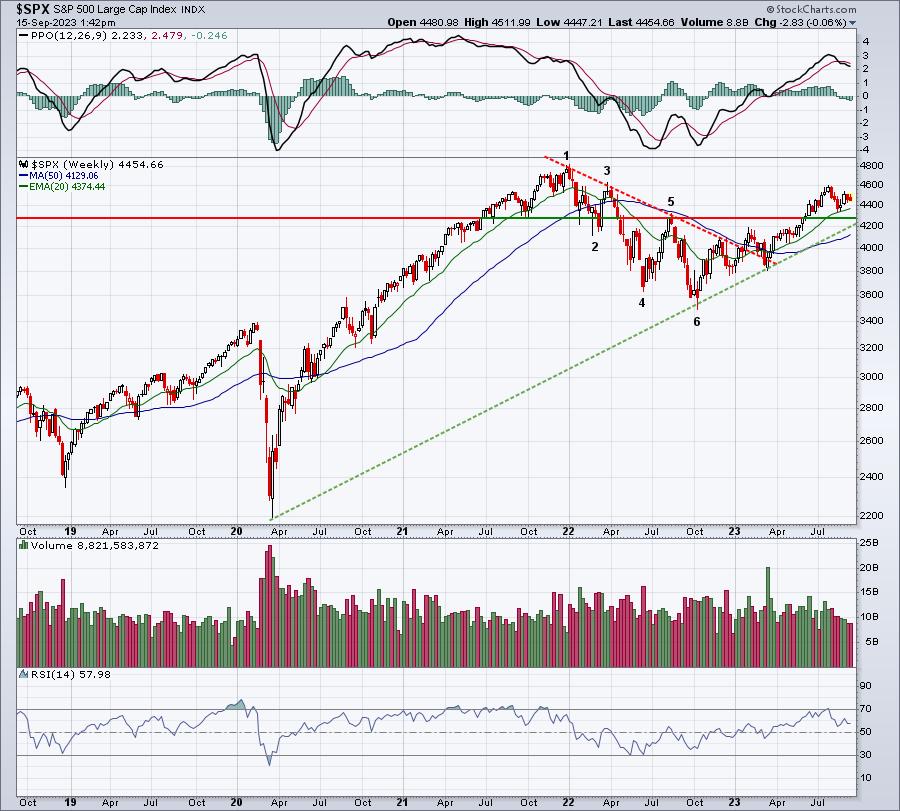
Now here's a bigger picture view that enables us to take recent cyclical bear markets (2018, 2020, 2022) into account. Clearly, we broke the 2022 cyclical bear market downtrend (Points 1 through 6 show lower highs and lower lows) and a trendline was drawn on points 1, 3, and 5 to highlight that prior cyclical bear market downtrend. Currently, the 4200-4300 area is our major price support. By zooming out to a 5-year period, it shows that support levels on shorter timeframes really aren't that big when we use perspective.
Sector/Industry Focus
I continue to be very encouraged by the behavior of the Volatility Index ($VIX). You'd think that this recent period of consolidation/selling would have sent the VIX much higher. Instead, it remains not too far from a fresh 2023 low. If there's little nervousness with the stock market falling, and market makers do not see the need to raise premiums on options, then I have little fear myself. Check out the VIX:
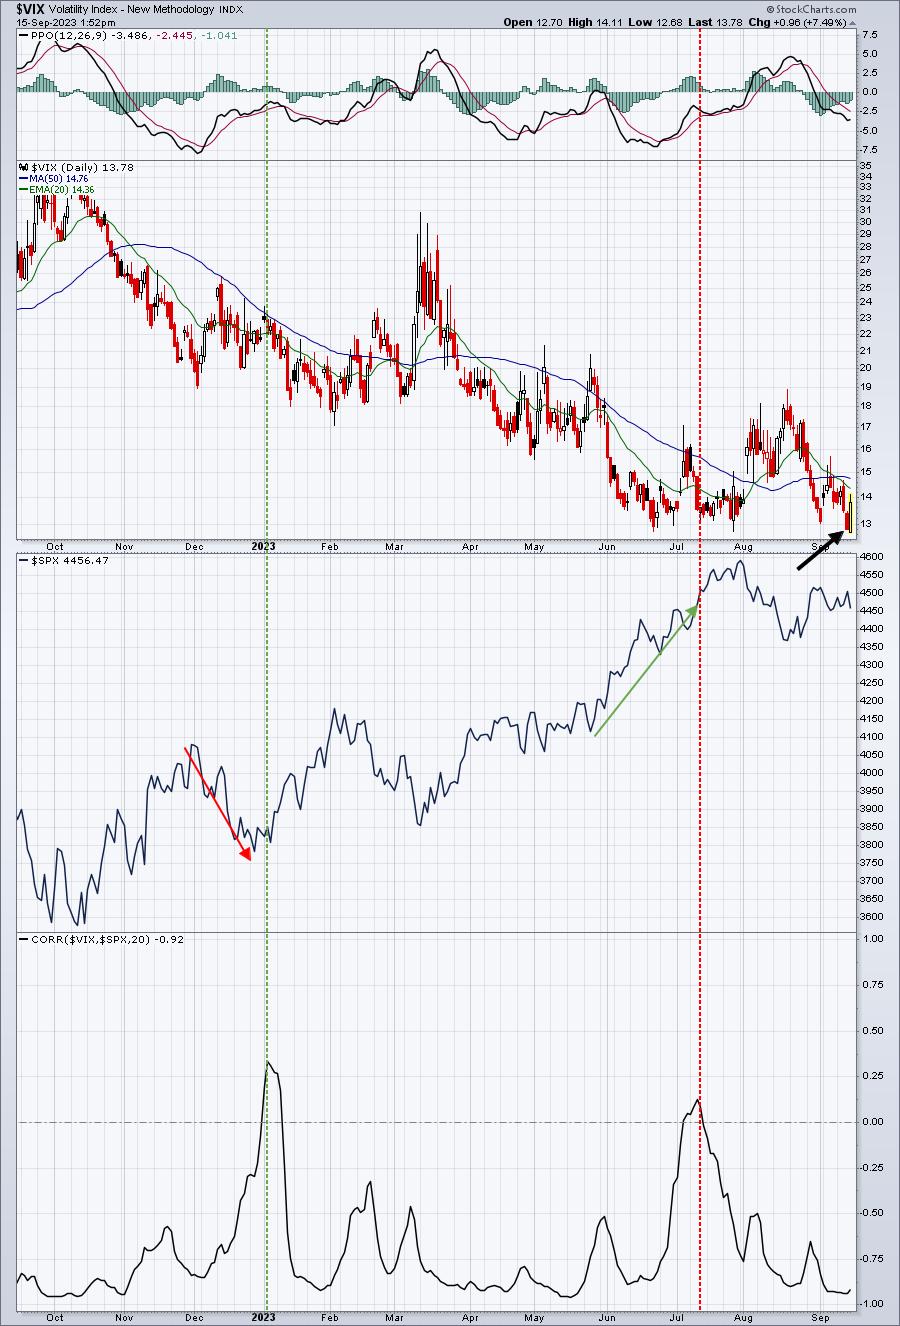
Couple points:
- Note the correlation jumping above zero twice this year. These signals typically suggest a reversal is in order. While the signals don't provide us perfect timing, the January signal suggested a reversal to the upside was imminent. We exploded higher in January. The July signal was more ominous, warning us of a possible downside reversal. You can see that was fairly accurate as we've struggled since.
- The thick black arrow points to the 2023 low close of the VIX. This occurred yesterday, despite the S&P 500 being nearly 100 points below the earlier July high. Usually, market weakness results in a rising VIX. In this case, market makers do not feel the need to raise premiums on options. That's evidence to me that downside action will be limited and a Q4 rally is much more likely.
ChartLists/Strategies
It's very difficult to trade individual stocks right now due to the recent market chop. Also, please keep in mind that the second half of September is a big challenge for traders, especially those on the bullish side. We don't go down EVERY September, but there is a bit of a seasonal pull to the downside, especially during the week from September 20th through September 26th. I have no idea if the Fed meeting might cause short-term selling, but its policy statement will be released on the afternoon of September 20th, which is interesting timing.
Earnings Reports
Here are the key earnings reports for the next two days, featuring stocks with market caps of more than $10 billion. I also include notable companies with market caps below $10 billion. Finally, any portfolio stocks that will be reporting results are highlighted in BOLD. If you decide to hold a stock into earnings, please understand the significant short-term risk that you are taking. Please be sure to check for earnings dates for any companies that you own or are considering owning.
Friday, September 15:
None
Monday, September 18:
None
Economic Reports
September empire state manufacturing index: 1.9 (actual) vs. -10.0 (estimate)
August industrial production: +0.4% (actual) vs. +0.1% (estimate)
August capacity utilization: 79.7% (actual) vs. 79.3% (estimate)
September consumer sentiment: 67.7 (actual) vs. 69.2 (estimate)
Happy trading!
Tom