
EB Daily Market Report - Tuesday, September 19, 2023
ChartLists Updated
The following ChartLists have been updated and are available for viewing/downloading on our website:
- Strong Earnings (SECL)
- Strong Future Earnings (SFECL)
- Raised Guidance (RGCL)
- Bullish Trifecta (BTCL)
- Short Squeeze (SSCL)
Executive Market Summary
- Futures were mixed overnight as most major indices began the day in negative territory
- Small caps showed early leadership, but they too have moved into the red
- Cryptocurrencies continue to bounce after bitcoin ($BTCUSD, +2.13%) held price support recently at 25000
- Volatility ($VIX, +5.21%) is jumping as the Fed announcement gets closer
- Crude oil prices ($WTIC, +0.69%) are above $92 per barrel, but earlier traded above $93 per barrel
- The 10-year treasury yield ($TNX) is up 2 basis points to 4.34%, hovering near major yield resistance established in October 2022 and last month
- All 11 sectors are down today as energy (XLE, -1.35%) leads the way, despite the higher crude price
- Industrials (XLI, -1.06%) is also weak, as transportation stocks ($TRAN, -1.10%) break to a new recent low
- We remain in a very difficult seasonal period and we have the Fed on deck for tomorrow - what could go wrong?
Market Outlook
I don't talk commodities much, but let's look at the following key commodities on a 5-year weekly basis:
Crude Oil ($WTIC)
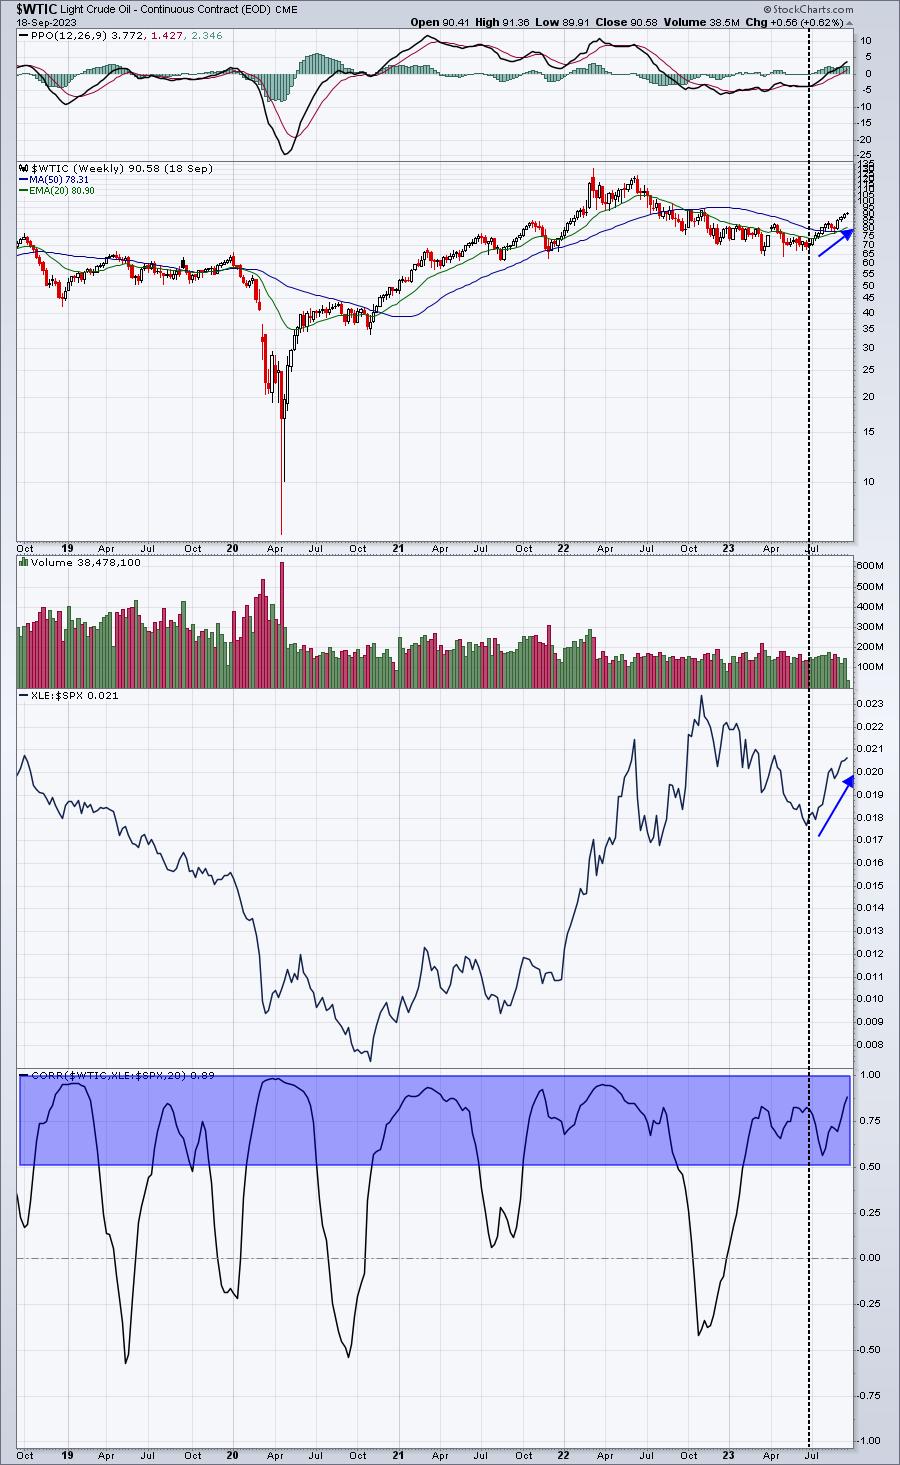
As you might expect, when crude prices rise, the XLE (energy ETF) tends to outperform the benchmark S&P 500. Also, the bottom panel shows you that this positive correlation is generally the case. So if you can figure out the direction of crude oil prices, then you'll have a pretty good idea of whether to overweight or underweight the energy sector. Currently, the price of oil appears to be in a rather strong uptrend, so the XLE makes sense. Just keep in mind that this group can lead or lag bull markets. Many times, there's no rhyme or reason. I've been frustrated over the years trading this group. When I do, I tend to position size smaller. I'd suggest that strategy for ANY area of the market that you struggle trading.
Gold ($GOLD)
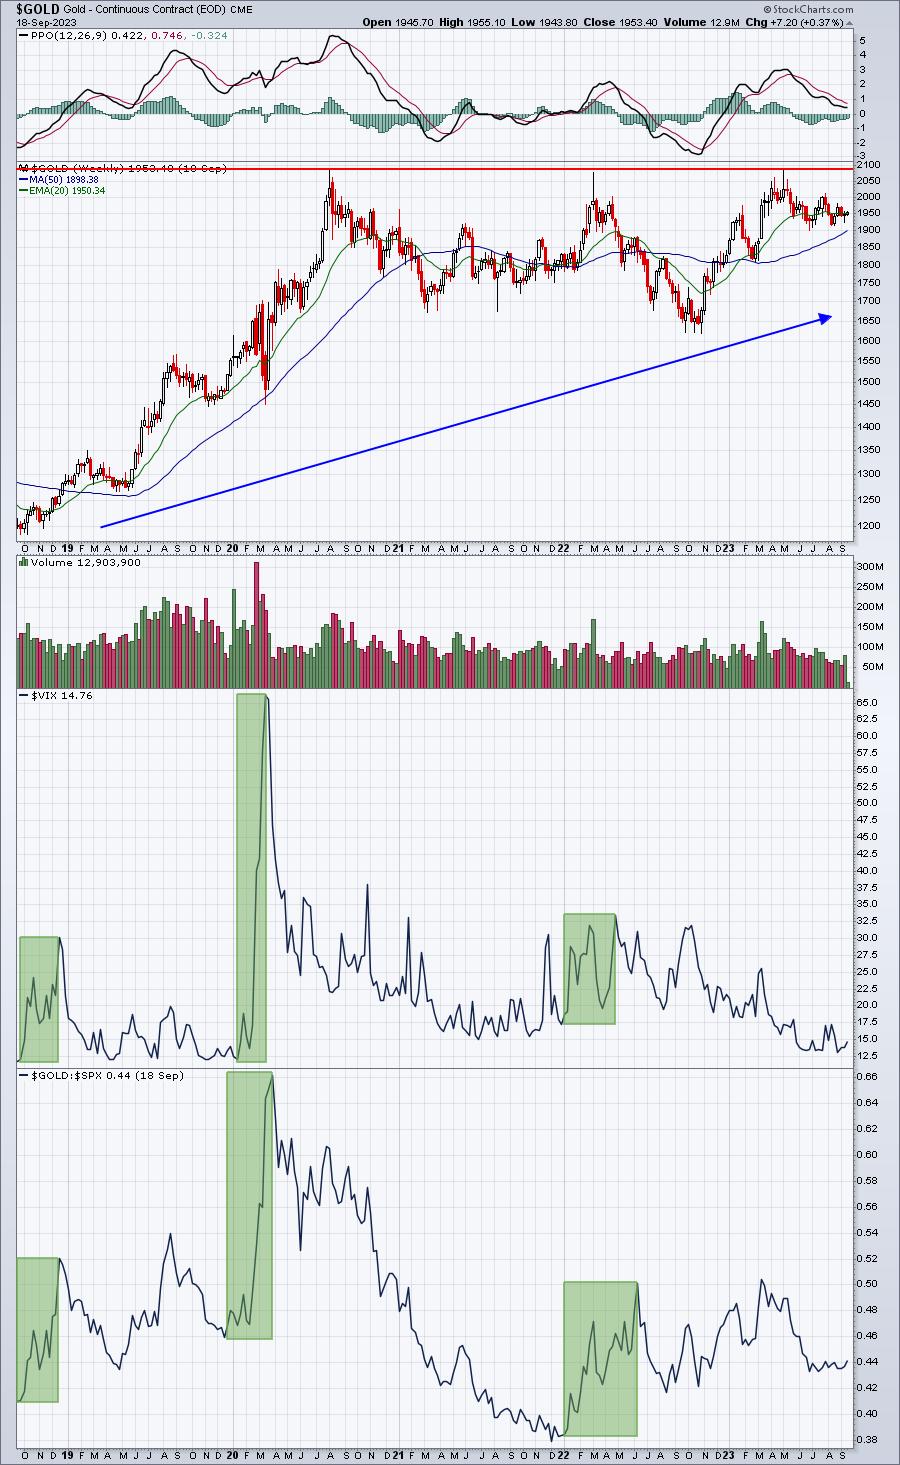
Lots of gold traders point to the overall uptrend of gold over the past several years. That's great, but does it outperform? The answer to that question is - usually NO. I've highlighted in green when we've had significant bouts of volatility (quick rises). THAT is when gold is at its best. Check out those green-shaded areas and I think you'll agree. So as volatility increases, Wall Street firms use gold as a hedge to outperform during periods of market weakness.
Silver ($SILVER)
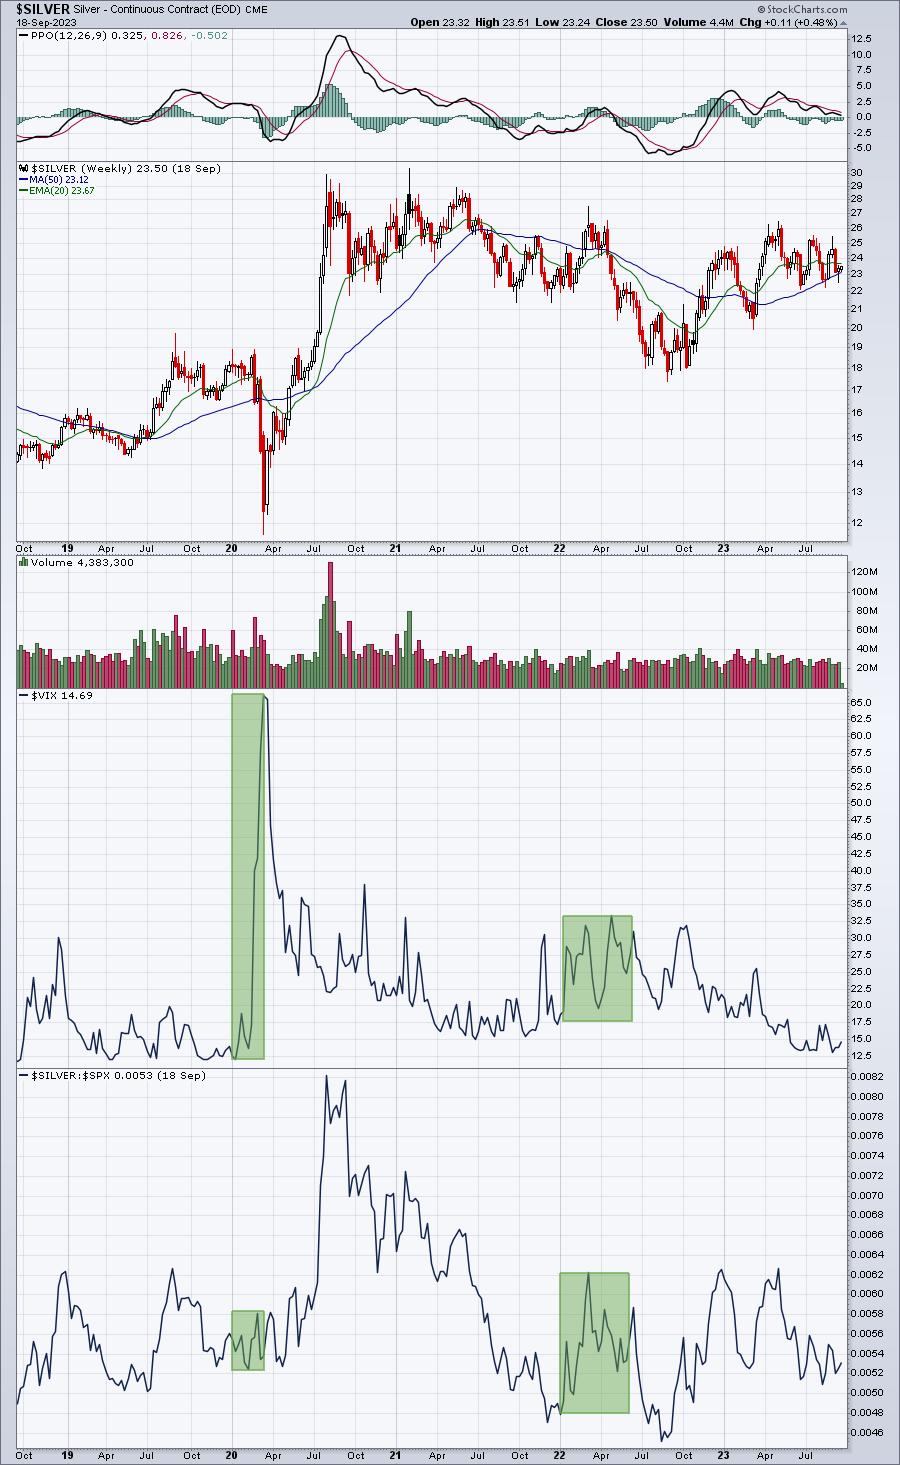
Notice that silver doesn't respond to the volatility like gold. That's because silver is not considered as safe as gold. Silver is more of an industrial metal that's much more closely tied to the economic environment than gold. When I think of industrial metals, copper comes to mind first. Steel and aluminum would be two others.
Copper ($COPPER)
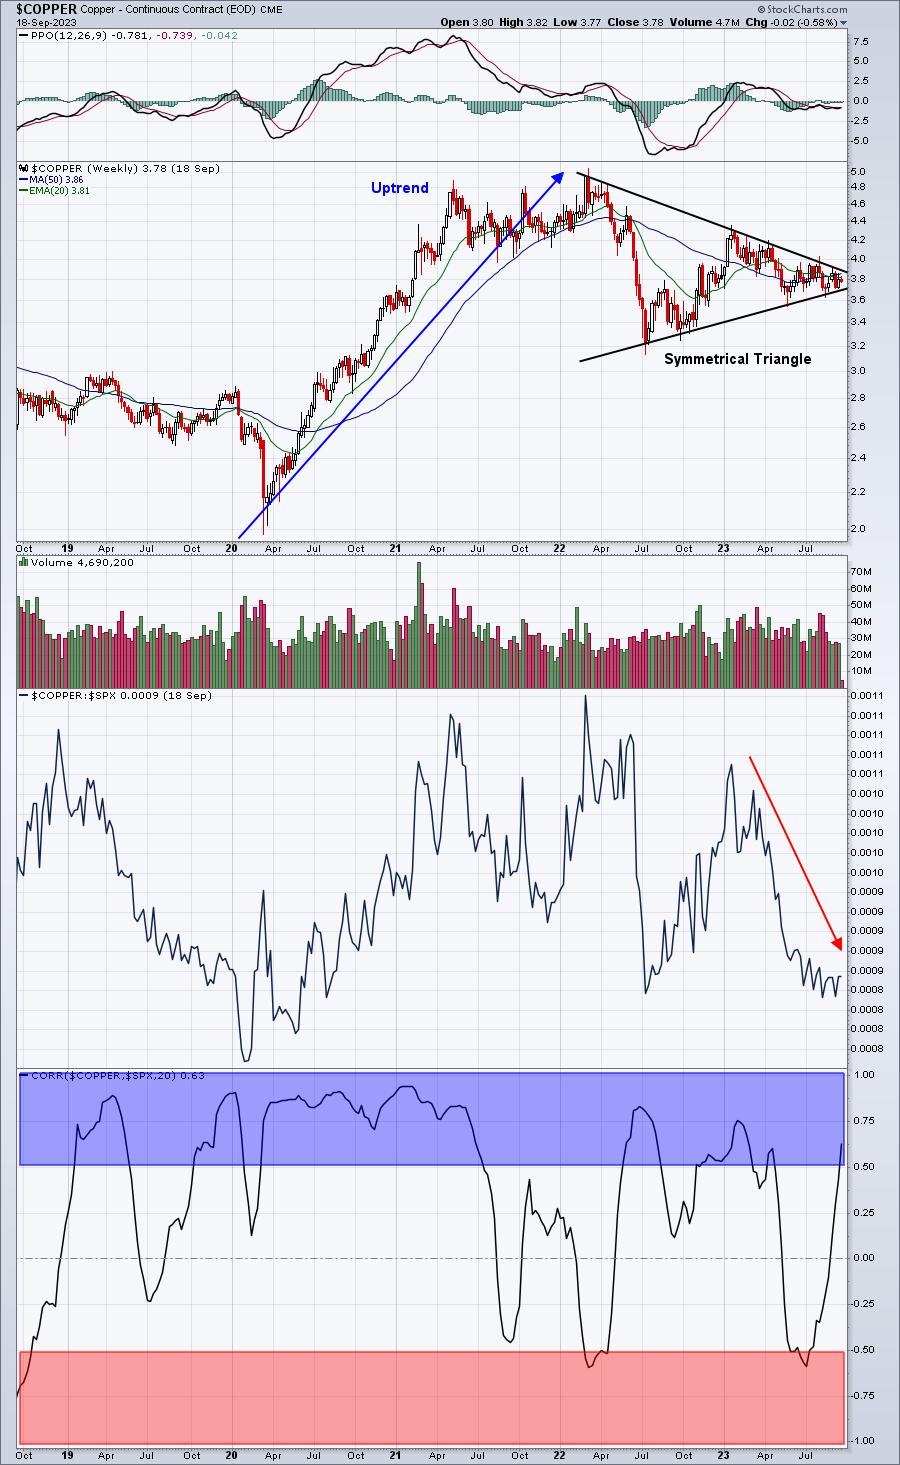
Copper is consolidating in rather bullish fashion as a symmetrical triangle is a continuation pattern that typically breaks in the direction of the prior trend. Clearly, the prior trend was higher, so I'm looking for a directional move on copper that's higher. Recently, we saw a bit of negative, or inverse, correlation between copper prices and the S&P 500, which is unusual. Normally, we see copper follow S&P 500 prices. My opinion is that copper has been weak in 2023, because global demand is not as strong for copper as U.S. demand. Most signs point to the U.S. economy being stronger than most foreign economies. A break to the upside in copper would, therefore, be a signal of improving global economic strength. The opposite would hold true as well.
Sector/Industry Focus
Small caps remain under intense pressure as we work our way through September. I normally don't use the "price labels" feature at StockCharts.com, but it does help to illustrate key price support and resistance levels. Instead of drawing a support/resistance line, I'll simply use this "price labels" feature to highlight:
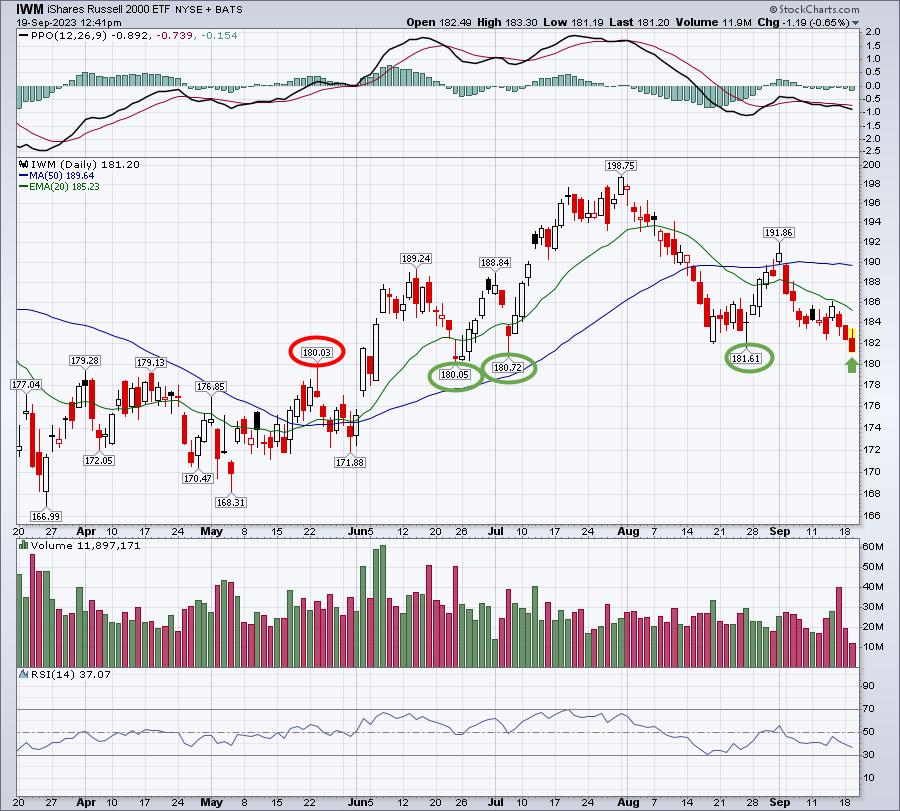
Obviously, we are staring key support directly in the face right now. Many of you, I'm sure, are asking why I've stuck with small caps through this recent downtrend. Trust me, I ask myself the same question every day. But the reason is quite simple. I decided in advance this would be my strategy. Throughout 2023, I've been extremely bullish and it paid off handsomely. I was able to trade mostly the QQQ and IWM, and occasionally juice up my returns with leveraged products in both those areas. As I approached the late summer months, I made the choice to "be cautious" by reducing, then eliminating my use of leveraged ETFs. I did not want to be completely out of the market, because secular bull markets can continue running higher against the worst odds. I'm very bullish and I wanted to make sure I was in IF the trend continued higher. But I also decided it wasn't worth the risk to leverage. That's where I am now. In hindsight, sure I wish I had moved entirely to cash. Unfortunately, none of us can trade with hindsight. We have to make calls in the moment, based on the risks at hand. While I've personally given back some gains, I'm still holding onto many of those gains and I see a market setting up beautifully on the long side, perhaps with leverage soon. I'm trying to remain patient and get through the Fed meeting and maybe the balance of September. THE most important thing, however, is price action. If I see an intraday breakdown, followed by a big afternoon rally, I may decide to grow a bit more aggressive. Right now, though, I'm sticking with the strategy I determined was best several weeks ago.
ChartLists/Strategies
Given the big Fed announcement waiting in the wings, I'd be patient to get a sense of market direction AFTER the meeting before committing additional capital. While sentiment signals like the VIX and equity only put call ratio ($CPCE) suggest a future rebound in equity prices, this is among the WORST seasonal periods of the year, if not THE worst. Investing, in large part, is about managing risk. I'm not sure how you take on individual stock trades right now, on either the long or short side, without taking undue risk. Be careful.
Earnings Reports
Here are the key earnings reports for the next two days, featuring stocks with market caps of more than $10 billion. I also include notable companies with market caps below $10 billion. Finally, any portfolio stocks that will be reporting results are highlighted in BOLD. If you decide to hold a stock into earnings, please understand the significant short-term risk that you are taking. Please be sure to check for earnings dates for any companies that you own or are considering owning.
Tuesday, September 19:
AZO, DAVA, APOG
Wednesday, September 20:
FDX, GIS, KBH
Economic Reports
FOMC meeting begins
August housing starts: 1,283,000 (actual) vs. 1,435,000 (estimate)
August building permits: 1,543,000 (actual) vs. 1,440,000 (estimate)
Happy trading!
Tom