
EB Daily Market Report - Thursday, September 21, 2023
Executive Market Summary
- Futures were much lower overnight as our major indices felt the wrath of the Fed's latest comments
- We gapped lower at the opening bell, though we remained close to that opening level throughout much of the trading day
- Weakness has picked up in the final hour, however, and most of our key indices are at their session lows right now
- The Fed, as expected, decided to leave the fed funds rate unchanged, but it was their change in the number of expected rate cuts in 2024 that caught many market participants by surprise
- At cboe.com, over the last three half hour equity only put call readings, the ratio has surged to 1.50 - showing extreme pessimism in the market
- Cryptocurrencies and commodities are nearly all lower on the session
- The 10-year treasury yield ($TNX) has spiked 14 basis points to 4.48%, putting further pressure on homebuyers as mortgage rates rise again
- All 11 sectors are lower, led by real estate (XLRE, -3.27%)
- Utilities (XLU, -076%) is showing relative strength, leading all sectors
- FedEx (FDX, +4.94%) is bucking today's selloff and leading all S&P 500 stocks after reporting better-than-expected quarterly results
Market Outlook
If you recall, I spent a great deal of time in 2022 discussing the manipulation that seemed to take place on the QQQ (ETF that tracks the NASDAQ 100). It was a significant reason why I believed the cyclical bear market was ending in June 2022 and an ensuing secular bull market rally was imminent. I've updated my Excel spreadsheet on the QQQ, breaking down its recent performance by times of the day. After the market showed signs of a short-term top in mid-July, the QQQ fell from a close of 385.76 on July 18th to 369.87 at Tuesday's close (September 19th). This was the last close before the Fed announcement yesterday afternoon. I want to highlight how the intraday trading has gone over three periods since that July 18th close:
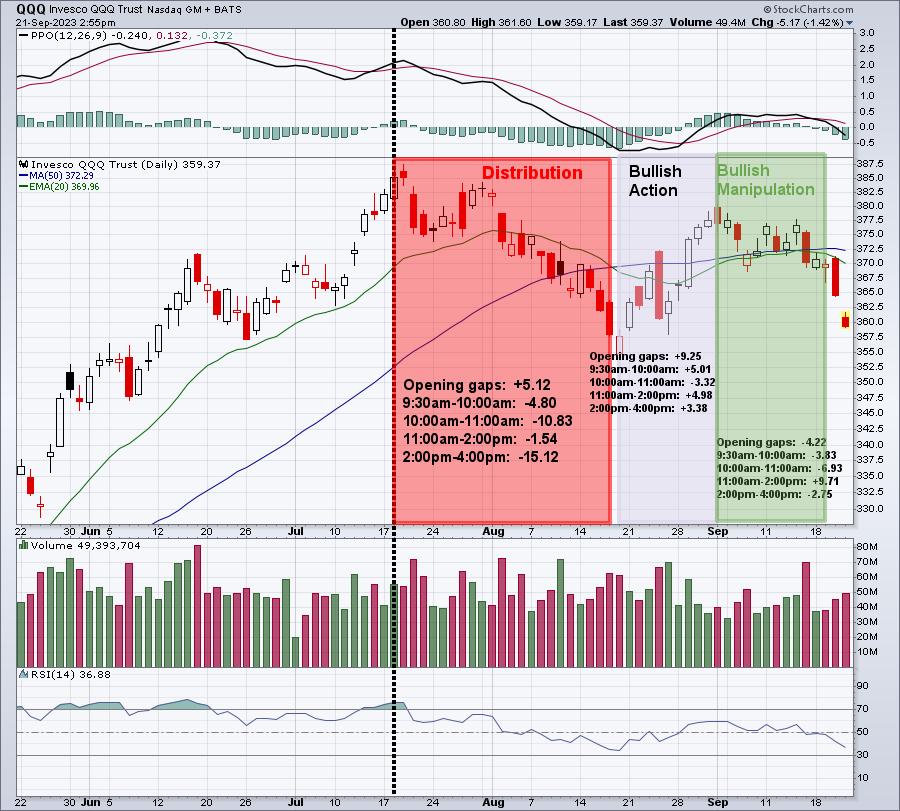
The first highlighted period shows pure distribution through all periods of the trading day. This is clearly bearish action and it was somewhat predicted by the warning signs that I discussed at that time. The August "bounce" was bullish as nearly every time period of the day showed accumulation. Only the 10:00am-11:00am time frame showed selling. And there was really only one large red-filled candle, which indicates selling from open to close. Overall, I'd conclude accumulation took place. The month of September, however, has seen another downturn, fairly typical of this calendar month. The intraday trading, though, is somewhat reminiscent of what we saw in May and June 2022, helping to signal a significant market bottom. The net trading from all the days in September after 11:00am shows a gain of nearly 7 bucks. This occurred during a period when the QQQ fell 8 bucks. So between opening gaps and market action in the first 90 minutes, the QQQ tumbled 15 bucks, but buyers were ready in the afternoon action.
But before I declare a bull's victory, we need to recall what happened in August/September 2022. Fed Chief Powell made the infamous declaration of "more pain ahead" during his Jackson Hole speech. The stock market cratered for roughly 7-8 weeks, before finally bottoming on October 13th. I've deliberately left the last two days alone on the above chart. I see a gap down this morning, but so far two rather ugly candles. Has Powell done it again? I don't believe so, but I'm not making assumptions this early. Let's see how the next few days play out, possibly all the way through September 30th, and let's reassess. Until then, I'd remain cautious U.S. equities - whatever that means to each of you.
Sector/Industry Focus
We've seen a few technical breakdowns of late, but there aren't too many more important than this one:
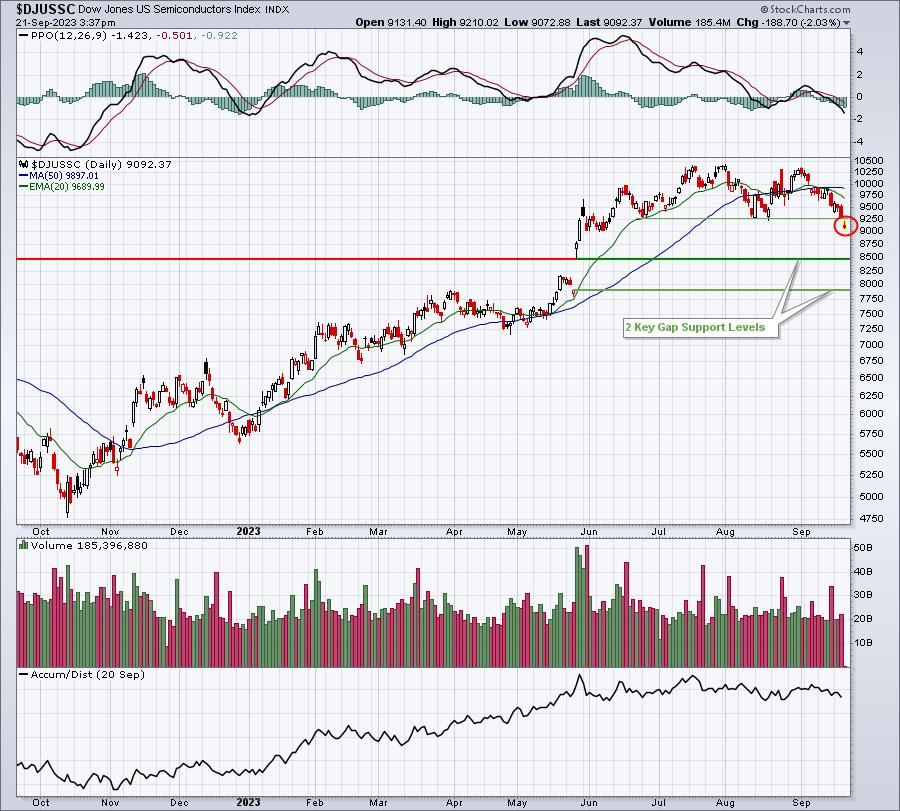
Semiconductors ($DJUSSC) could find support near 9000 based on the lows from early June. If that doesn't hold, however, I see two key gap support levels as possible targets for this very influential industry group.
ChartLists/Strategies
There's really not a whole lot to do right now from a bullish perspective. Signals continue to point to a solid rebound down the road, but there are no short-term signs that suggest this selling is over.
Personally, I was stopped out on UPWK at the opening bell and my second entry into RCL triggered just after the opening bell today. I'm holding onto RCL unless we see a close beneath 94.
Earnings Reports
Here are the key earnings reports for the next two days, featuring stocks with market caps of more than $10 billion. I also include notable companies with market caps below $10 billion. Finally, any portfolio stocks that will be reporting results are highlighted in BOLD. If you decide to hold a stock into earnings, please understand the significant short-term risk that you are taking. Please be sure to check for earnings dates for any companies that you own or are considering owning.
Thursday, September 21:
DRI, FDS
Friday, September 22:
None
Economic Reports
Initial jobless claims: 201,000 (actual) vs. 225,000 (estimate)
Philadelphia Fed manufacturing index: -13.5 (actual) vs. +0.5 (estimate)
August existing home sales: 4,040,000 (actual) vs. 4,100,000 (estimate)
August leading indicators: -0.4% (actual) vs. -0.3% (estimate)
Happy trading!
Tom