
EB Daily Market Report - Friday, September 22, 2023
Executive Market Summary
- Futures were up slightly overnight and we began the day in positive territory
- After nice early morning action, we've seen much more negative action this afternoon, with small caps trailing slightly on a relative basis
- The 10-year treasury yield ($TNX) has dropped roughly 4 basis points to 4.44%
- Crude oil ($WTIC, +0.67%) has risen back above $90 per barrel after closing just beneath it yesterday
- Sector performance is quite mixed with energy (XLE, +0.46%) leading, taking its cue from crude oil
- Meanwhile, the autos ($DJUSAU, -3.08%) and recreational services ($DJUSRQ, -2.67%) groups are applying pressure to discretionary stocks (XLY, -0.73%), today's worst-performing sector
- One key group that's rebounding today is semiconductors ($DJUSSC, +1.59%), but the chart warns of further downside
- Barring a miraculous final hour rally, it appears breaks of the 20-week EMA on nearly every major index today will lead to more selling early next week
Market Outlook
There is a TON of negativity being spewed in the news once again. We're all hearing from the perma-bears too. Apparently, they've come out of hibernation. Bearish headlines draw anywhere from 3 to 5 times the number of clicks that bullish headlines draw. I'm hearing the dreaded "Market Crash" much, much more. I just laugh. There have been 5 of what I would call "crashes" in my lifetime - 1974, 1987, 2001-2002, 2008, and 2020. That's an average of 1 every 12 years. But there are perma-bears who try to call one every year. Peter Schiff is one that comes to mind. I'm sure he'll be parading on CNBC soon, if he hasn't already. Perma-bears are easy to spot too. Every time the stock market moves higher, they double down, never admitting defeat. One day (roughly every 12 years), they're right and claim to be heroes.
Feel free to listen to the headlines, if you'd like. But I'm telling you that listening to the crazy bears will challenge you mentally. I don't mind unbiased analysts that turn bearish. It's the perma guys and gals that I ignore.
I'd encourage you to consider PERSPECTIVE. In mid-July, I discussed warning signs, all short-term, and how we COULD have a difficult summer. I certainly didn't guarantee it, just simply suggested that the short-term risks had increased. I pointed out that the S&P 500 could see a retest of 4305, which was my worst-case scenario. Well, we're almost there:
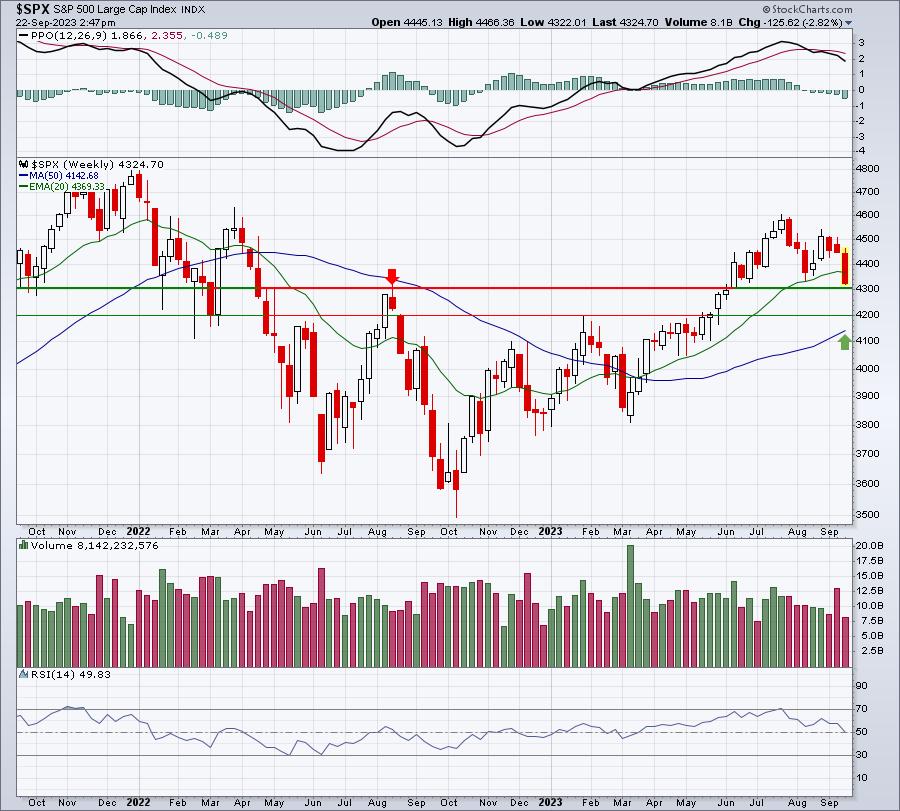
My line in the sand is 4300 support. If the S&P 500 closes below that number, I'll be 100% cash and wait for my next opportunity. It could be the next day, next week, or next month. While I remain 100% convinced that we remain in a secular bull market, everyone must have a line in the sand for no other reason than to avoid a devastating loss. Right now, the S&P 500 is down 6-7% since its recent high at 4600.
Also, my "under the surface" signals do not support further downside. The QQQ:SPY, XLY:XLP, IWF:IWD, $DJUSGL:$DJUSVL, $DJUSGM:$DJUSVM, and $DJUSGS:$DJUSVS ratios are ALL higher than they were at the August low. That just simply means that while the S&P 500 has moved below the 4335 low in August, money HAS NOT rotated out of key growth stocks. If anything, I could argue that the big Wall Street firms are using this drop as one more opportunity to load up their portfolios before another Q4 surge.
Time will tell, but I'll be watching it every day.
Sector/Industry Focus
I've received several questions about which areas of the market to follow to help identify a turn back to the upside in the IWM, which is a small cap ETF that tracks the Russell 2000. According to fidelity.com, the IWM has the following sector exposure:
- Industrials: 17.12%
- Financials: 15.83%
- Health care: 15.25%
- Information Technology: 13.58%
- Consumer Discretionary: 10.74%
- Energy: 7.65%
- Real Estate: 6.10%
- Materials: 4.55%
- Consumer Staples: 3.55%
- Utilities: 2.85%
- Communication Services: 2.55%
Because industrials represent the largest area of investment in the IWM, one member asked if we should be following the XLI. That answer is NO. The XLI is a LARGE CAP industrials ETF. It would make much more sense to follow an ETF like the PSCI, which holds roughly 100 SMALL CAP industrial names.
In fact, you can see from the chart below that there's a very strong positive correlation between the IWM and many of the Invesco S&P SmallCap sector funds:
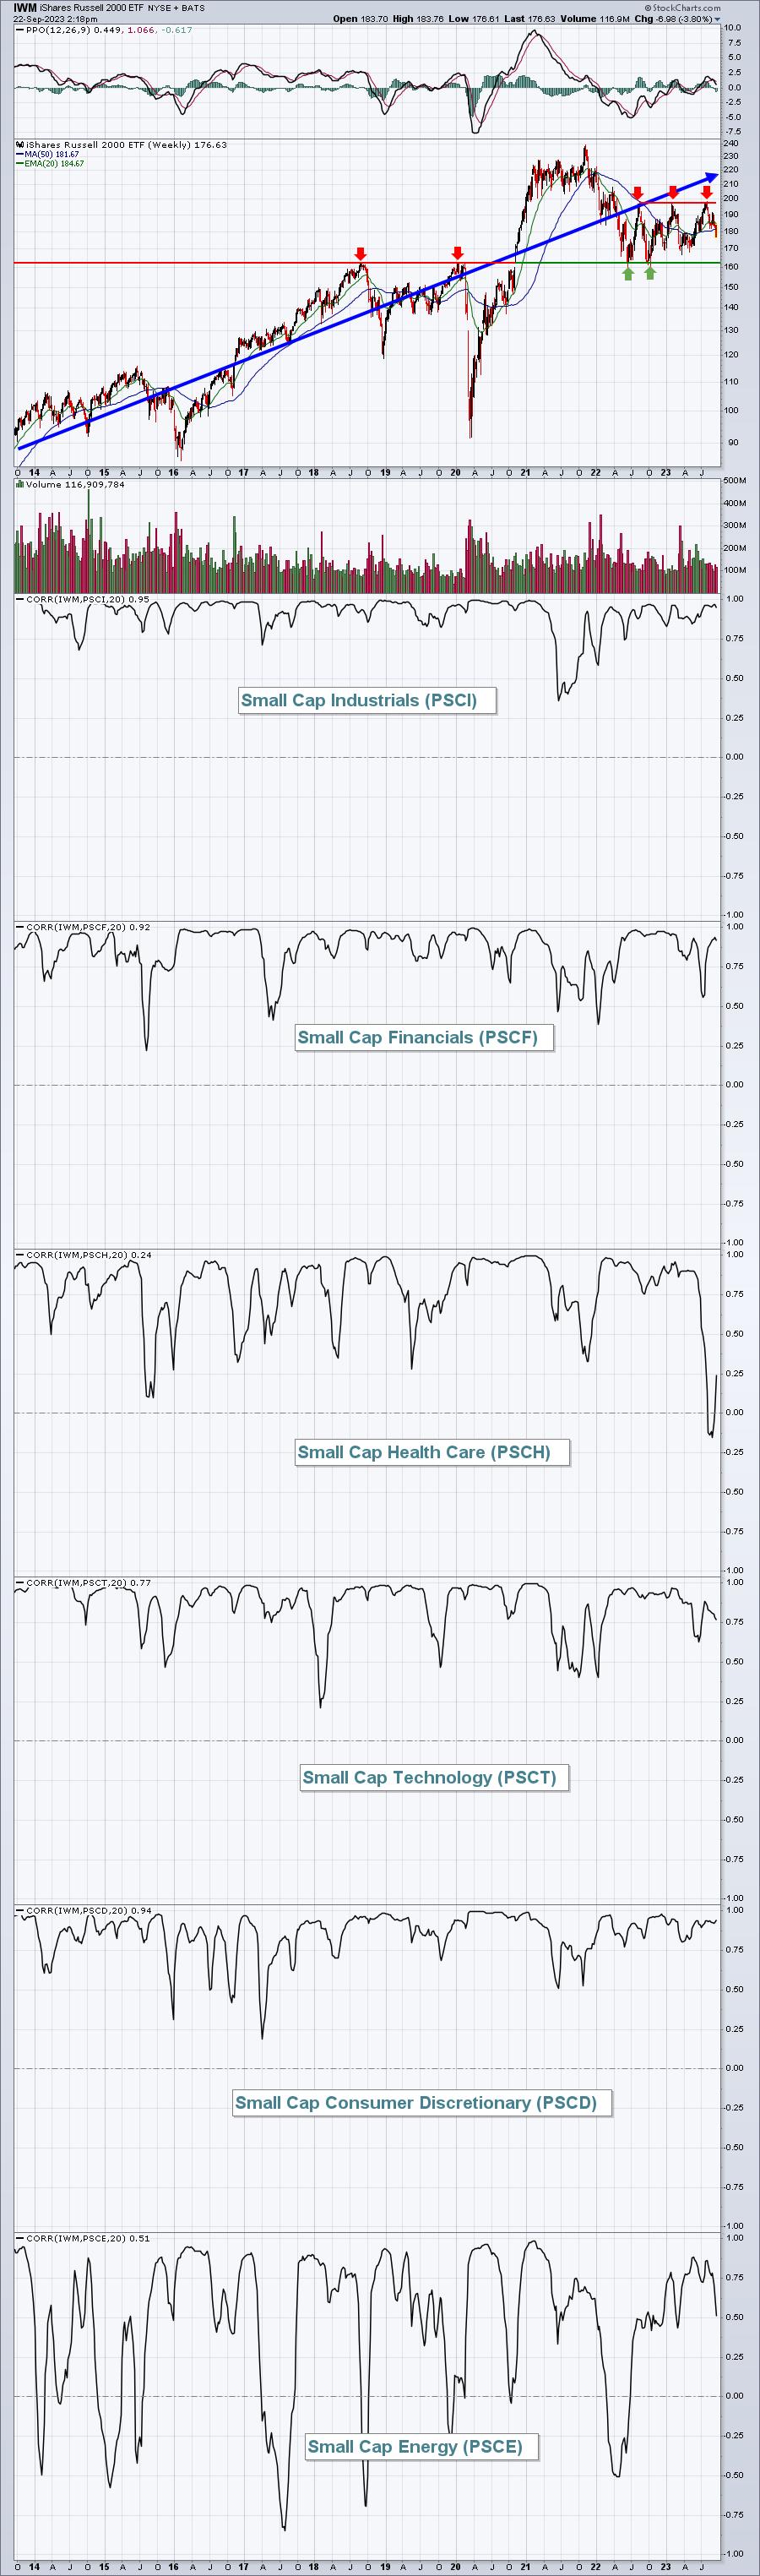
The correlation between the IWM and PSCE (small cap energy) is mixed, but all of the others are quite strong.
ChartLists/Strategies
I reviewed my own trading account and have lost on my last 7 individual stock trades. It's certainly a reminder for me that swing trading in a choppy, seasonally weak period is usually a waste of time and effort. The best way to make money the past two months has been to short. Unfortunately, my strategy is NOT to short during what I believe is a secular bull market. In hindsight, my two biggest regrets were (1) not being more in cash as that was certainly an option I considered back in July, and (2) being more evenly balanced between QQQ, SPY, and IWM. I've ridden this out mostly with the IWM, which has easily been the weakest of these 3 index ETFs. It was a calculated risk for me that hasn't paid off the past month or two.
Earnings Reports
Here are the key earnings reports for the next two days, featuring stocks with market caps of more than $10 billion. I also include notable companies with market caps below $10 billion. Finally, any portfolio stocks that will be reporting results are highlighted in BOLD. If you decide to hold a stock into earnings, please understand the significant short-term risk that you are taking. Please be sure to check for earnings dates for any companies that you own or are considering owning.
Friday, September 22:
None
Monday, September 25:
THO
Economic Reports
None
Happy trading!
Tom