
EB Daily Market Report - Special Report - Tuesday, September 26, 2023
I wanted to provide today's DMR much earlier than usual as we're currently trading at a level that violates key price support and I don't want to wait and see where we are at later this afternoon. The way that the stock market is currently trading, I believe we need to see capitulation. This can come in a few different forms, but usually it's a gap lower, followed by very heavy intraday selling, before a strong afternoon reversal. It's best if it comes on well-above average volume. A bottom doesn't have to form like this, but these types of bottoms provide me the most confidence that a bottom has, in fact, formed.
First, let's look at the S&P 500 chart, because its support at 4305 is what I'm watching most closely:
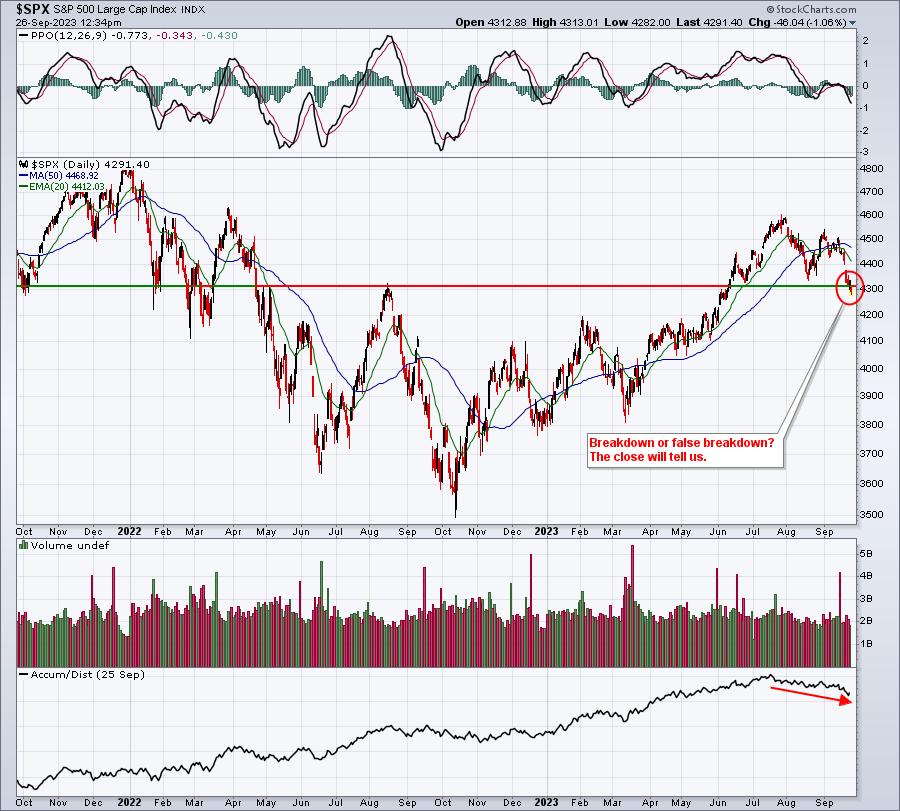
Today's close could make me VERY BULLISH or much less bullish. A close somewhere just beneath 4305 would leave me somewhat neutral. If we're significantly below 4305 intraday, but finish 5-10 points beneath this key level, would it be horribly bearish? Not really. But if we finish today on our lows, then the character of the chart turns more bearish, in my opinion. It would still be subject to a possible rapid rebound, because of where we stand with the 5-day SMA of the equity only put call ratio ($CPCE), but trading would become much more dangerous and the bears would be in control - until proven otherwise. A further, panicked drop could even send the 5-day SMA of the CPCE up to .90 or higher. During this type of decline, market makers who provide liquidity, sometimes go on "vacation", allowing prices to decline rapidly until capitulation occurs. That's the point where market makers say "enough is enough" and they deploy their capital.
Whenever we have a major support or resistance level being tested, I like to review the performance of sectors, industries, and key relative ratios. Are they breaking down to confirm the S&P 500? Or are they sending us a different message from below the surface?
What I'm most concerned about is if this selling episode is similar to the Fed's last gaffe at Jackson Hole in August 2022. If you recall, we had already begun to weaken slightly, but it was the August 25th massacre (huge red candle) and the distribution that followed that worries me about the current situation. Is Wall Street sending another message that they do not trust Fed Chief Powell? So let's look at this a couple different ways.
First, the following is a 1-week analysis of sector performance, followed by the best and worst performing industries over this period. In other words, AFTER the Fed's latest policy statement and Powell's never-ending changes to interest rates and inflation, where has the money been rotating? We are now trading our 5th day since that latest Fed announcement, so looking at the 1-week performance makes good common sense to me:
Sectors
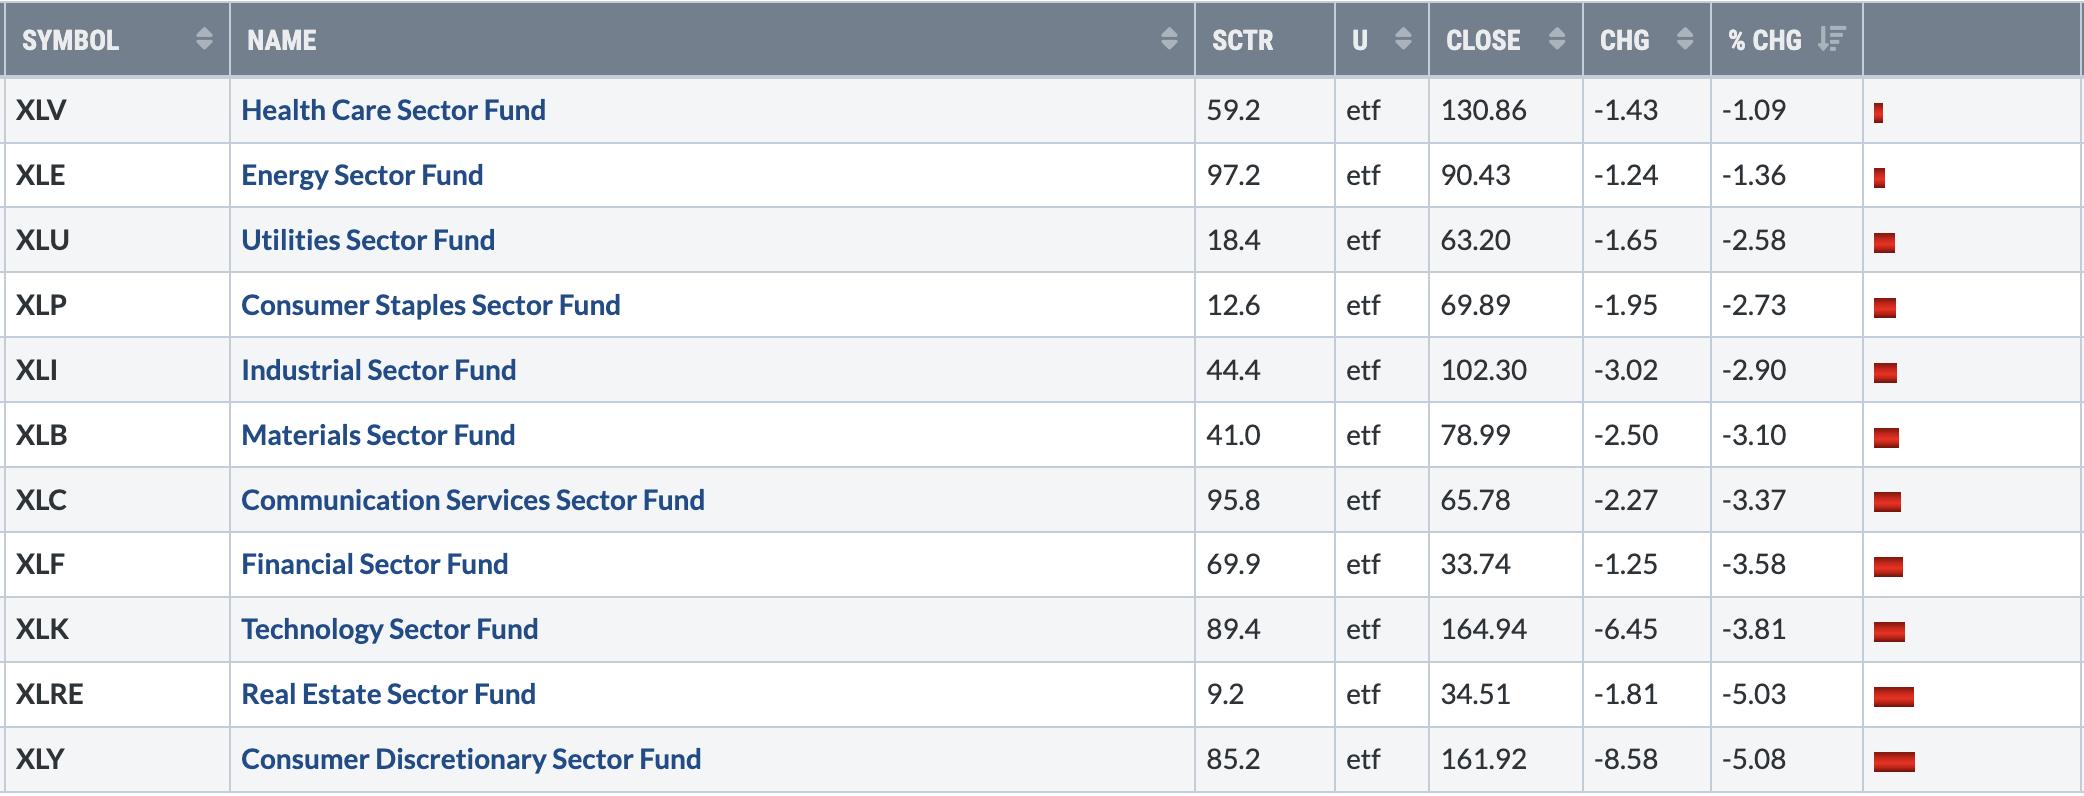
All 11 sectors have been lower and the aggressive groups are leading to the downside. This is normal, however, as profit taking usually results in the best relative-performing sectors underperforming when the market moves lower. What will be EXTREMELY IMPORTANT is which sectors lead during the next rebound. If we continue to see poor relative performance in the XLK, XLY, and XLC during a period of market strength, that would be a very difficult signal to ignore. It very likely could lead to what we saw in Q4 2022 - leadership by financials and industrials and lack of support from the NASDAQ.
Top Industry Groups
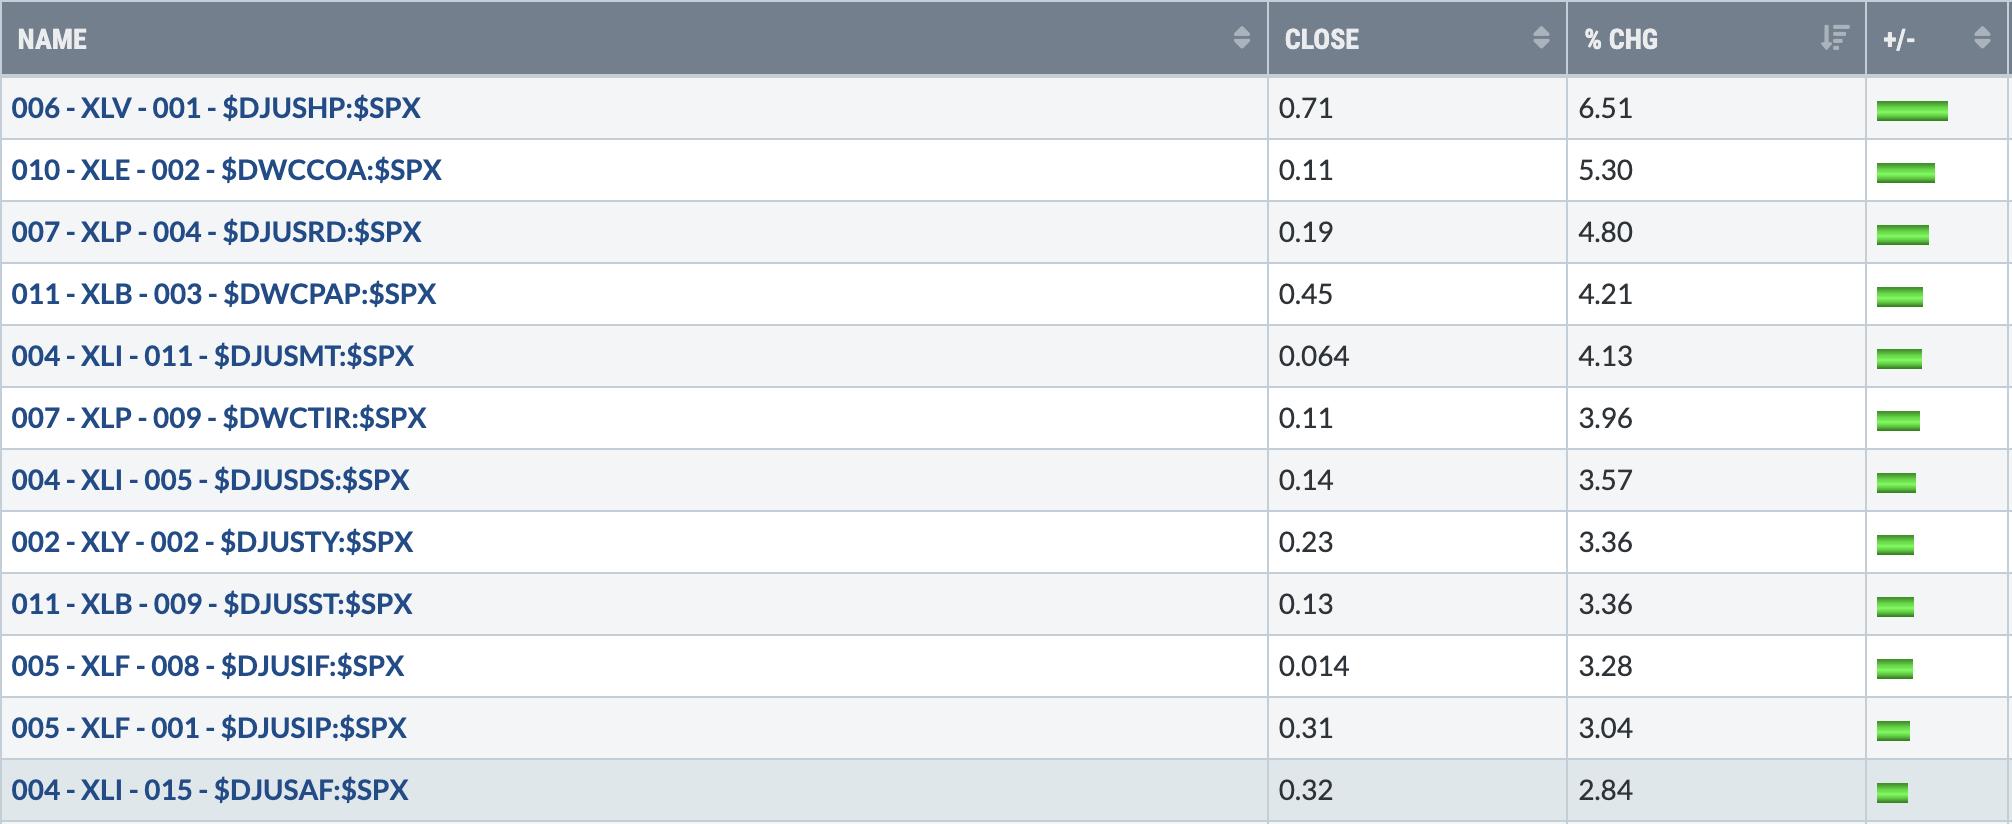
These are the Top 12 industry groups over the past week. Health care providers ($DJUSHP) were mentioned in the Weekly Market Report three weeks ago as a group that could benefit from rotation as it was testing a very important trendline. It's bounced ever since. Another interesting piece of information is that the industrials (XLI) and financials (XLF) claimed 5 of these top 12 spots. I've been expecting rotation into these two sectors as they love Q4. That rotation may well be underway. There are NO groups from technology (XLK) or communication services (XLC), however, and only one from consumer discretionary (XLY). Again, this isn't problematic when the stock market sells off, but that absolutely needs to change on a market rebound.
Bottom Industry Groups
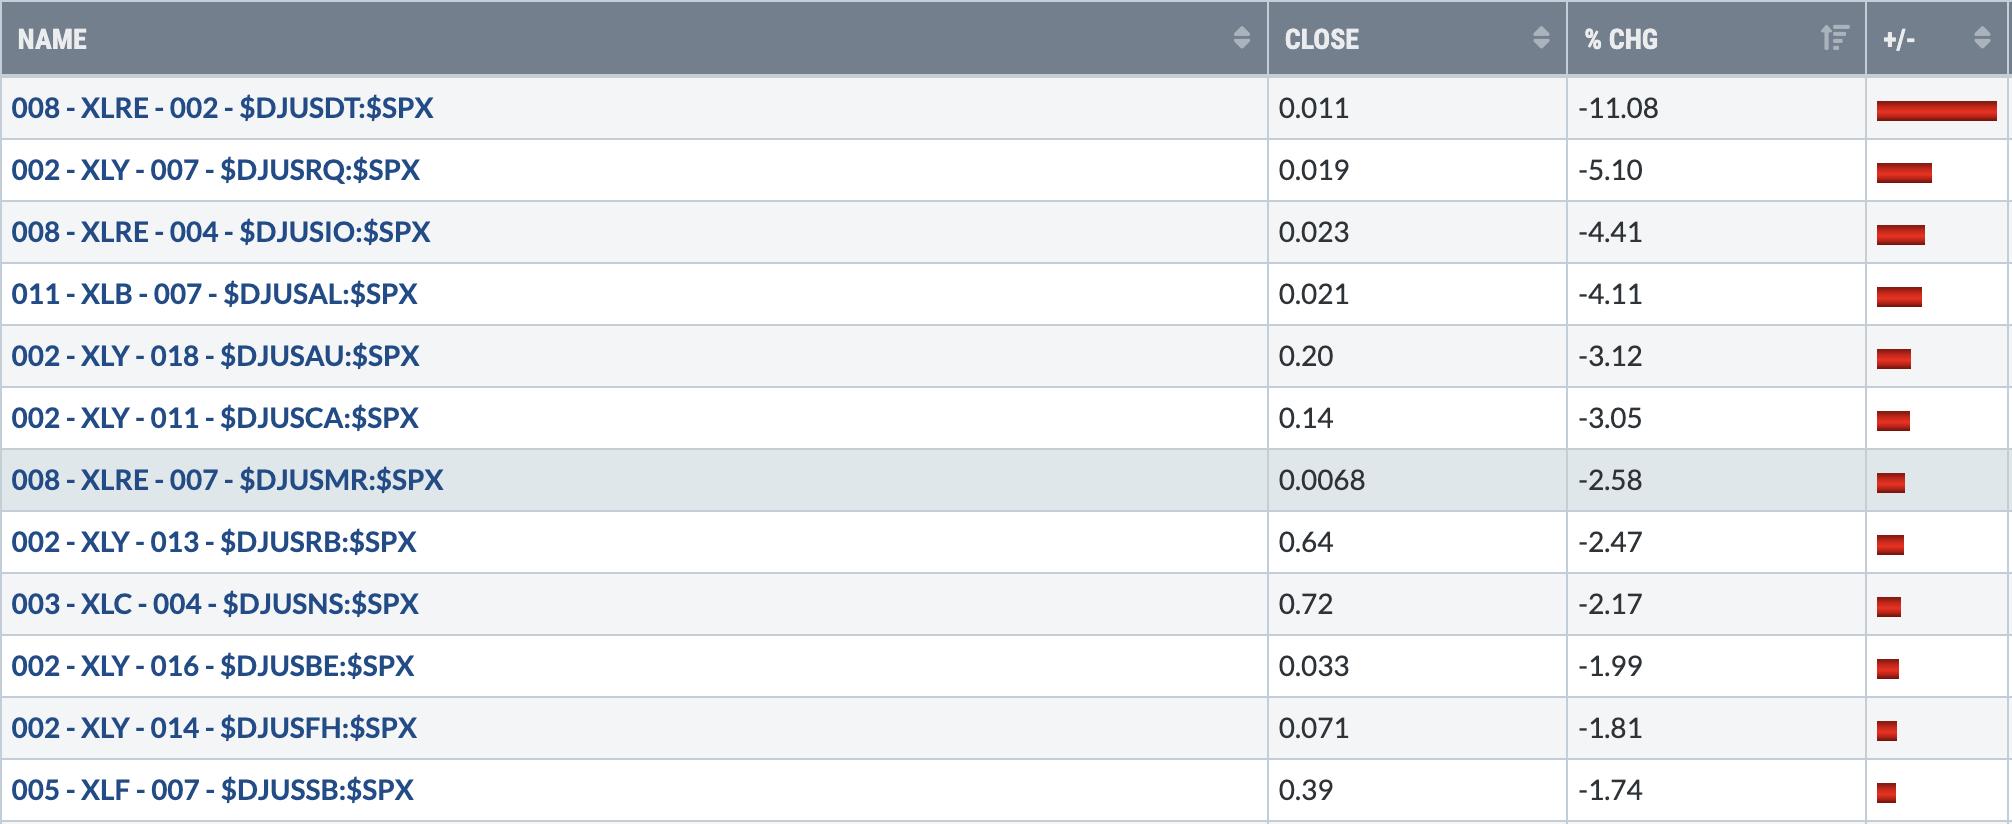
Real estate (XLRE) obviously remains incredibly weak, with three industry groups in the top 7 spots. The thing that stands out to me the most is that 6 discretionary industry groups are in the Bottom 12 groups. This performance COULD suggest the stock market is beginning to price in a higher chance of a recession. Once again, we'll need to see if this list changes on a rebound. Does money rotate right back into discretionary or does it weaken further vs. consumer staples stocks? Everyone should know by now that I love the XLY:XLP ratio as it's my favorite intermarket relationship to determine the sustainability of an S&P 500 advance - either higher or lower. If the S&P 500 rebounds and this ratio continues falling, that would be a problem we'd need to address. Here's how the XLY:XLP ratio currently looks, on both a closing basis (includes gaps) and intraday basis (excludes gaps and focuses ONLY on what happens AFTER the opening bell to the close):
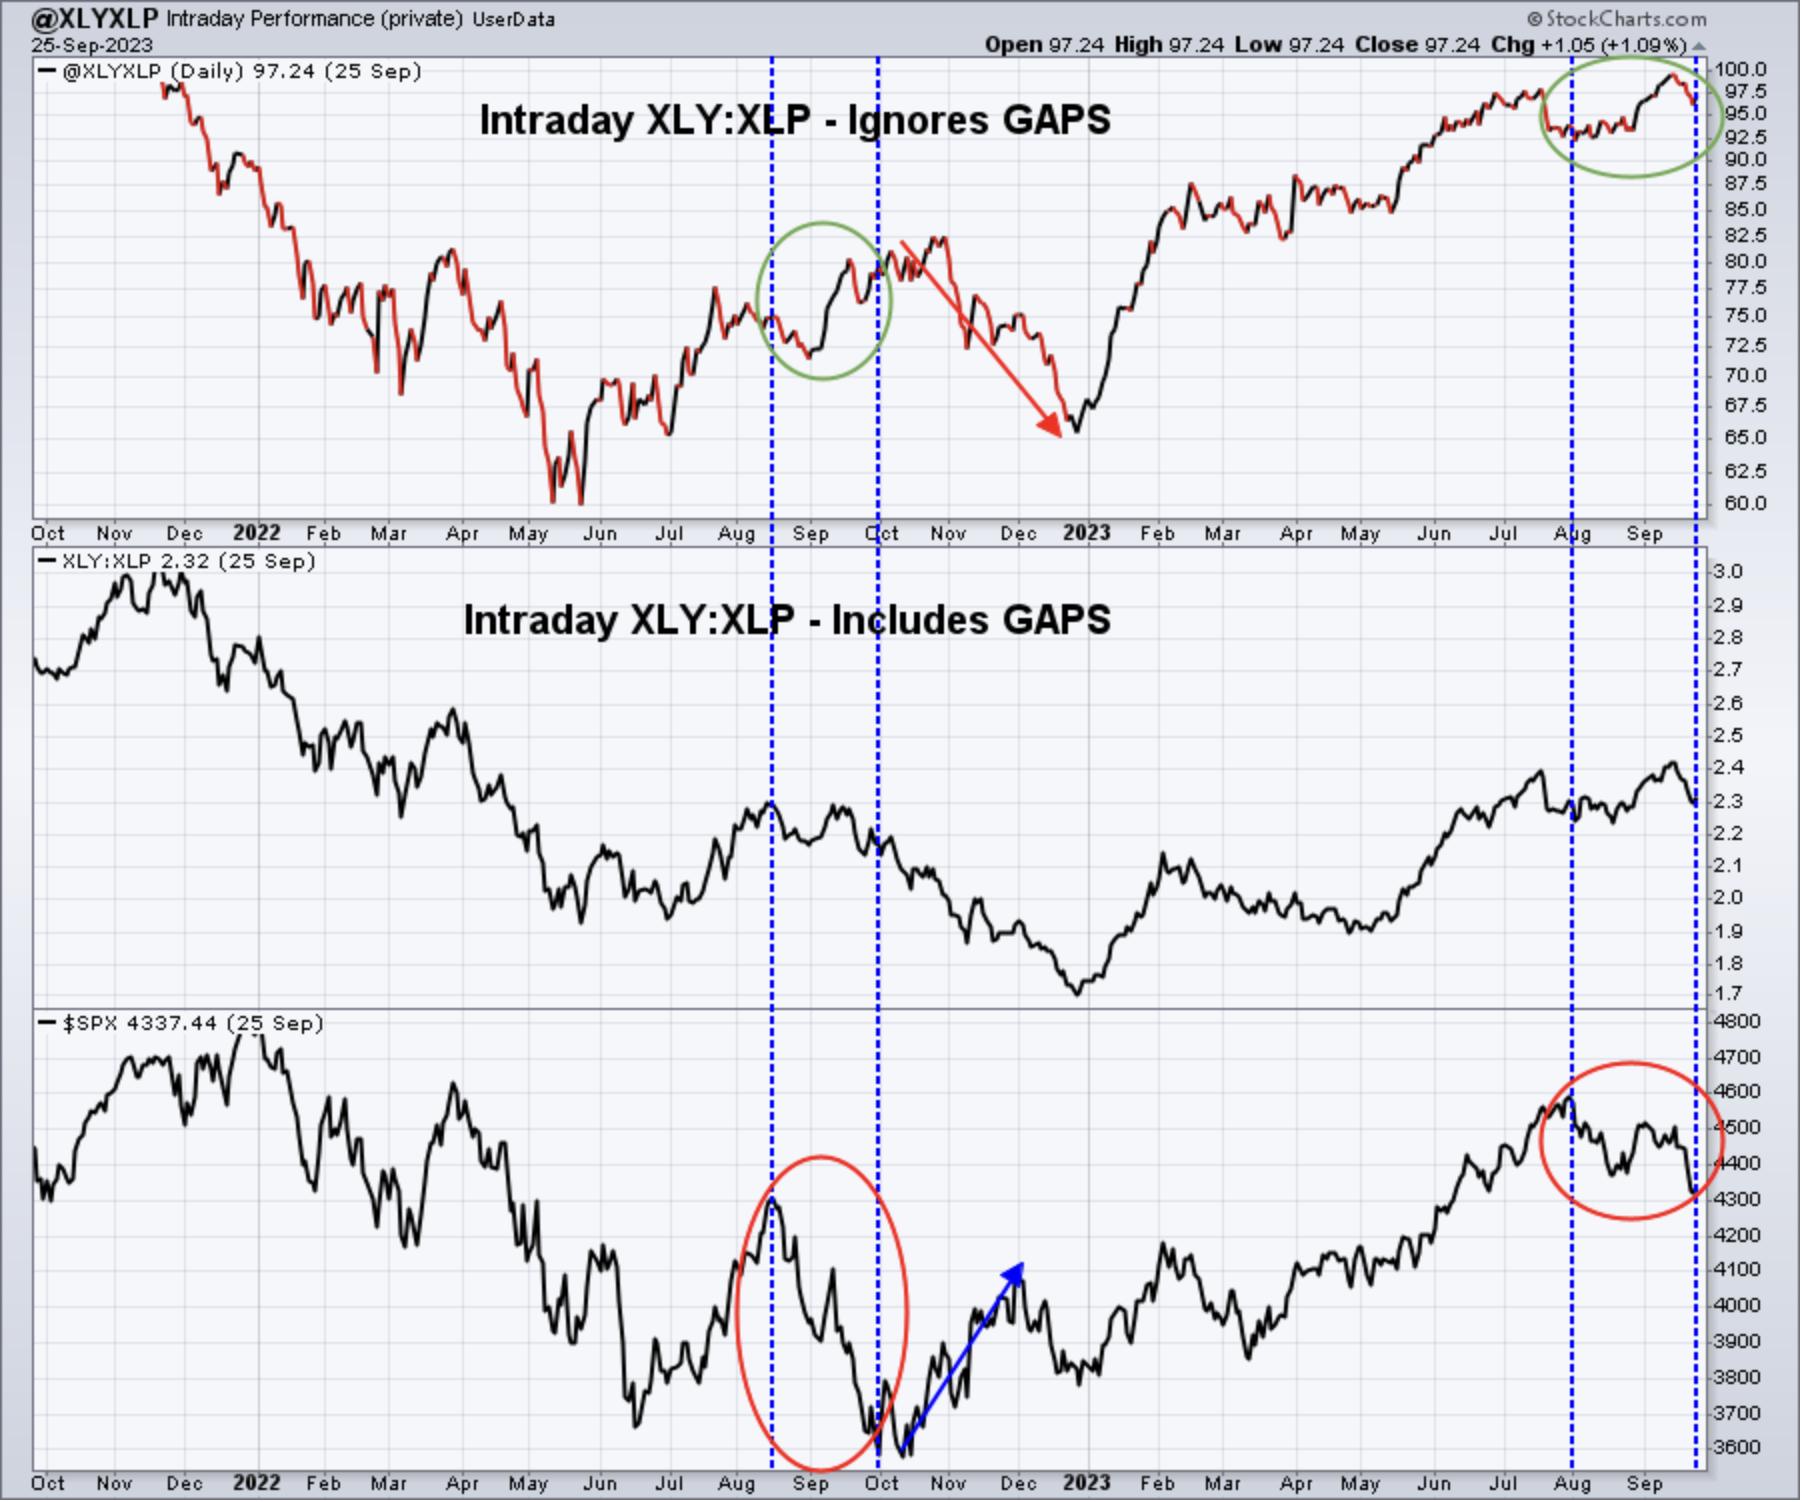
I highlighted how everything set up last August and how things are setting up right now. Notice that after the Fed Chief Powell spoke in August, the S&P 500 declined, but during its ensuing rally, the XLY:XLP ratio declined. That was an indication that money was rotating away from growth and we saw financials and industrials lead into year end, before passing the baton back to the NASDAQ, led by the XLK, XLY, and XLC. We could very well be setting up similarly.
If that money does eventually rotate into the XLI and XLF, that would be very beneficial to the IWM. Check out the IWM's performance relative to the QQQ during Q4 2022:
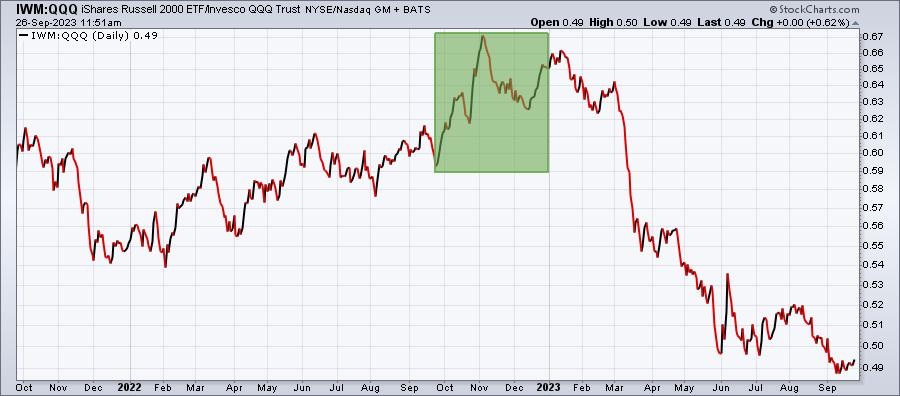
The IWM's outperformance in Q4 2022 was rather significant. You can also see how the IWM was completely left behind in 2023, though.
Where does this leave us? Well, if I'm being honest, mostly confused. I see a couple of bearish signals - intraday breakdown on S&P 500 and a very weak AD line. But I also see signs that we should be buying, namely the extreme put call readings, major price support on the S&P 500 at 4305 (that becomes MUCH stronger if we rally this afternoon), and intermarket relationships (ratios) that do not really support further downside action. I try to put puzzle pieces together to provide a market outlook. I remain bullish as of this moment, but a swoon to the downside this afternoon would turn me quite defensive.
I would say this. For those that are conservative, I suggested to wait, AT A MINIMUM, for us to see a daily higher high and higher low to print. We haven't seen that yet. In fact, yesterday's high on the IWM was 177.03. This morning, the high was 177.02. In order to reverse a trend, this is one thing that MUST happen. For those that are much more aggressive, using this weakness to establish a position in a leveraged ETF makes a lot of sense. Just be prepared to jump back out as necessary. The S&P 500's support is 4305. If the S&P 500 rallies this afternoon to move back above 4305, taking on the SSO, which is a 2x leveraged long ETF that tracks the S&P 500 could represent a VERY solid reward-to-risk entry. Any move on the S&P 500 in future days below today's low would be the signal to move back to the sidelines.
I began moving some of my IWM into the 3x leveraged long TNA yesterday morning. I will add more if I see a bullish reversal today. If we finish weak today, my plan is to exit the TNA I bought yesterday and probably sell my remaining IWM to move into a much larger cash position. Industrials (XLI) have shown relative strength during this latest downturn, so I'll likely hold onto this one a bit longer - at least that's the current plan.
Bottom Line
First, U.S. equities are at a critical inflection point. Get the direction right from here and you can make a lot of money (or save a lot of money by moving into cash during a selloff). Get the direction wrong and it could be painful, especially if you remain 100% invested. It all boils down to your risk profile and tolerance. I continue to be very bullish into Q4 and into 2024. However, it would be difficult to ignore a key breakdown in the S&P 500 at 4305 at today's close. It would be the first real gut punch from the bears since the October 2022 low.
Second, the bearish seasonal period from July 17th close to September 26th close ends at today's close. Q4 right up to the middle of January is the absolute BEST seasonal period. Will it be that easy this year, with stocks turning right on historical cue? We'll all find out soon enough.
Happy trading!
Tom