
EB Daily Market Report - Wednesday, September 27, 2023
Executive Market Summary
- Futures were up overnight and we began the day firmly in positive territory
- We saw the IWM small cap ETF continue to push higher, while our other major indices faltered
- The IWM:QQQ ratio set a 3-week relative high, suggesting that expected Q4 rotation to small caps might just be underway
- Cryptos are flat today, but many commodities are getting hit hard; gold ($GOLD, -1.28%) is down $24 to $1895 per ounce, threatening to close below $1900 for the first time since March
- Crude oil ($WTIC, +3.83%) is surging to its highest level since August 2022, closing in on $94 per barrel
- Energy (XLE, +2.68%) and industrials (XLI, +0.71%) are leading today's attempted recovery
- Utilities (XLU, -1.61%) are again weak, this time with the 10-year treasury yield ($TNX) falling with yet another TNX surge higher to 4.63%, up 7 basis points after being down 6 basis points this morning
- Generac (GNRC, +6.45%), a building materials & fixtures company ($DJUSBD, +1.21%), is leading the S&P 500's attempted recovery
Market Outlook
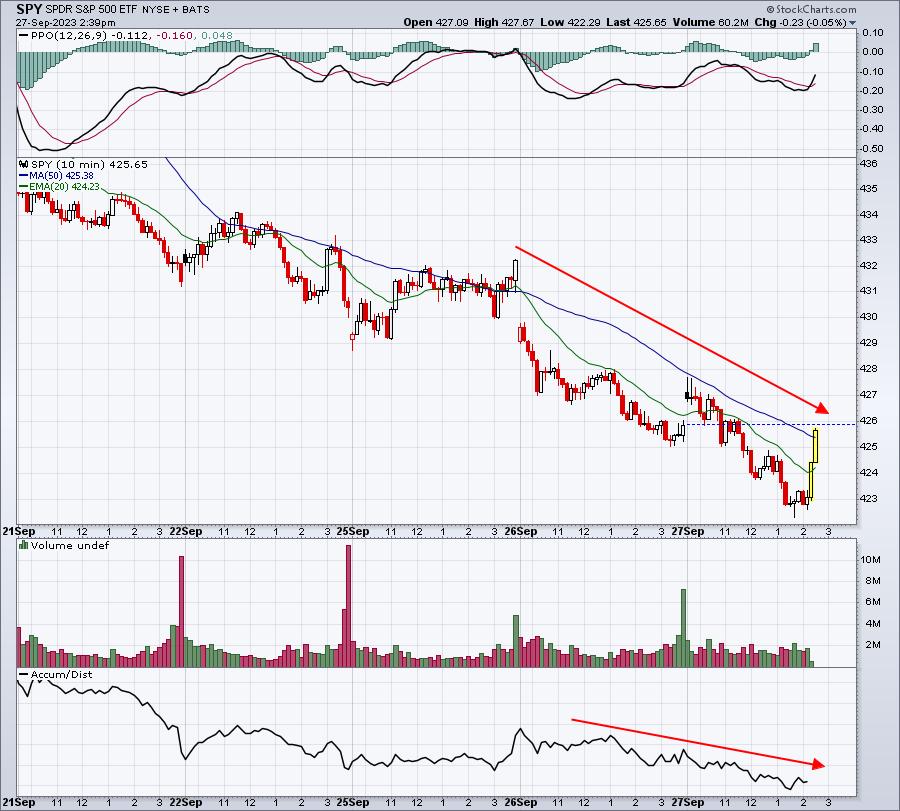
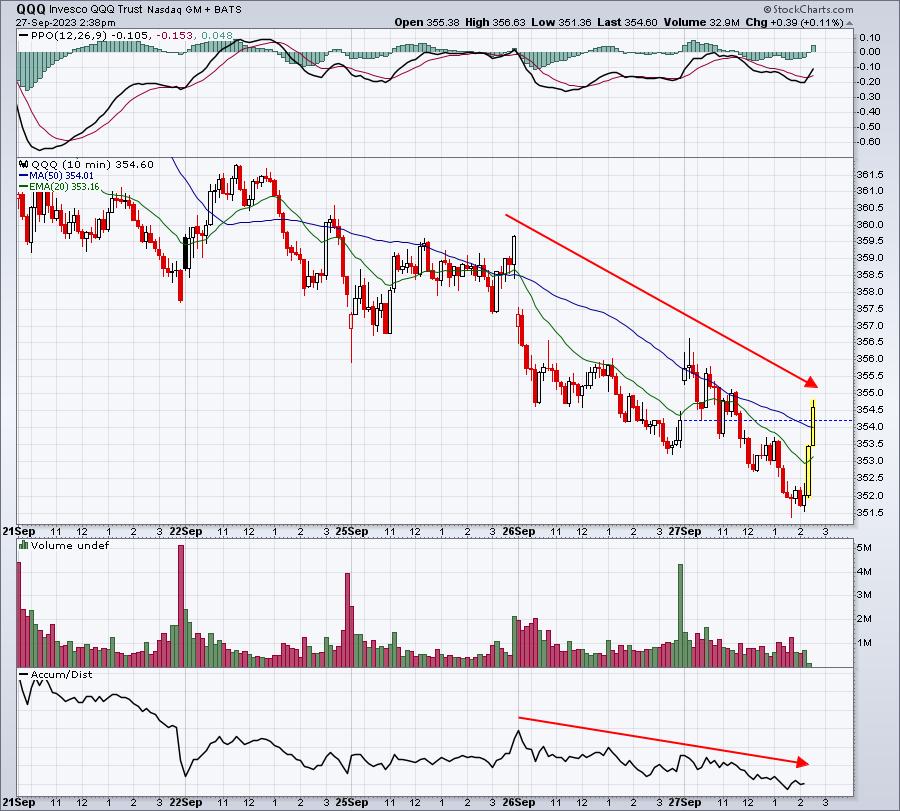
The AD lines continue to push lower on nearly all of our major indices and sectors. However, I could argue that positive action is taking place throughout the trading day. I generally do not look at AD lines on intraday charts, but I do find the recent AD strength in the IWM coinciding with the recent relative strength in the IWM vs. the QQQ quite interesting. Let's take a look at a few charts and I'll explain:
SPY - Intraday AD lines:
QQQ - Intraday AD lines:
IWM - Intraday AD lines:
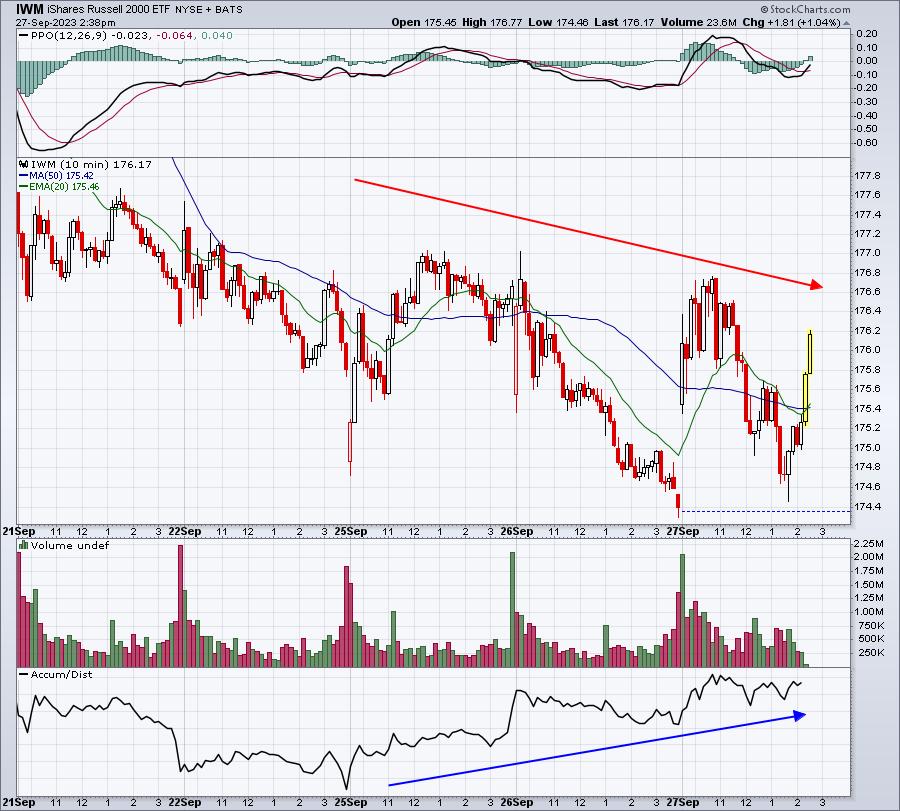
The intraday action on the IWM is very different from the SPY and QQQ. When volume occurs intraday, we see fairly strong action, but then the IWM has been dropping on lesser volume. Honestly, I don't know if this is a signal to trust, but if so, it's absolutely a bullish signal. When we broke today's downtrend line on the IWM, I took another chance on the TNA. If we see more selling into the close, then I'll very likely be out again, licking my intraday trading wounds. Clearly, the less risky option is to avoid leverage and stick entirely with the IWM (or SPY/QQQ if you prefer those indices).
IWM vs. QQQ:
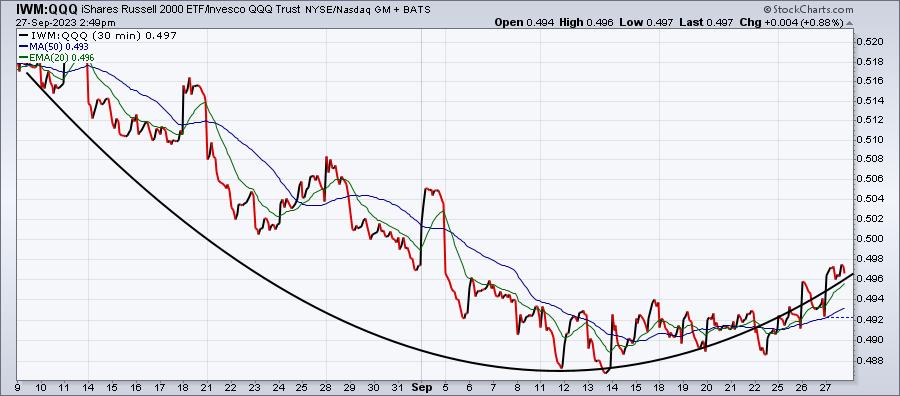
Is this the start of relative outperformance by the IWM vs. the QQQ? It's a good question, but the rounded bottom certainly suggests the possibility.
Sector/Industry Focus
The Volatility Index ($VIX) nearly reached 20. The perfect scenario of a bottom, in my opinion, would be the VIX shooting above 20 intraday, but closing beneath it. And that may still happen. But, if nothing else, just be aware that a VIX top near 20 very well could mark a significant bottom in the S&P 500. Here's the chart:
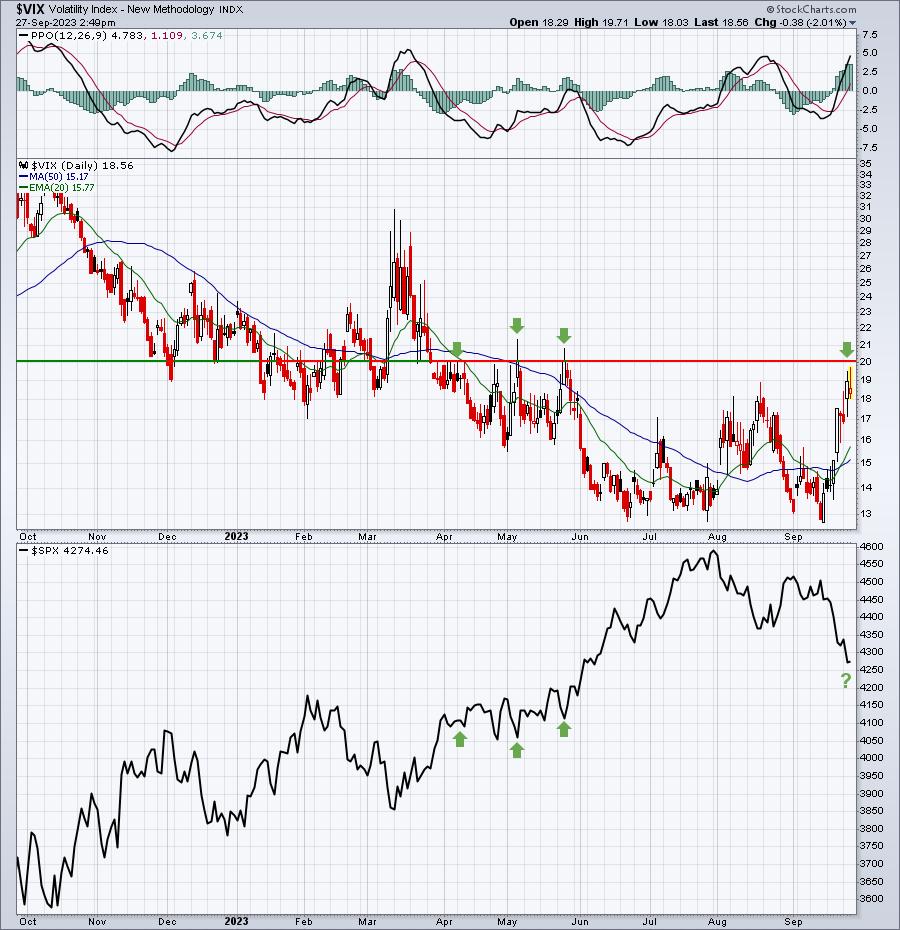
The VIX and S&P 500 generally move in opposite directions. When the VIX tops, it historically has coincided with S&P 500 bottoms. That's what we're looking for now. Did today's tail to the upside, along with yesterday's tail, mark the S&P 500 bottom. Only time will tell, but the 20 level is very important as you can see from the above chart.
ChartLists/Strategies
I discussed during today's live trading room that, if I wasn't working on EB "stuff" and trading 100% full-time, I'd sit on my hands today, looking for a possible market reversal to ride back to the upside. Further downside is certainly possible, especially since 4305 price support was broken at the close yesterday. However, none of my "below the surface" signals, other than possibly daily AD lines, suggest the market will continue to fall. As a result, I'm only looking to go long, which I did earlier this afternoon. It was very risky as the major indices could return to session lows by the close. But that intraday AD line on the IWM tells me that where there's been volume of late, there's been buying. Again, we'll see if this signal pans out.
Earnings Reports
Here are the key earnings reports for the next two days, featuring stocks with market caps of more than $10 billion. I also include notable companies with market caps below $10 billion. Finally, any portfolio stocks that will be reporting results are highlighted in BOLD. If you decide to hold a stock into earnings, please understand the significant short-term risk that you are taking. Please be sure to check for earnings dates for any companies that you own or are considering owning.
Wednesday, September 27:
None
Thursday, September 28:
THO
Economic Reports
August durable goods: +0.2% (actual) vs. -0.3% (estimate)
August durable goods ex-transports: +0.4% (actual) vs. +0.2% (estimate)
Happy trading!
Tom