
EB Daily Market Report - Friday, September 29, 2023
Executive Market Summary
- Futures were solid overnight and our major indices gapped higher; unfortunately, that early strength has fizzle and now I'm watching to see if that earlier strength is rekindled into the close
- As I'm writing this, we have just under an hour to stage a comeback
- After touching 4.69%, the 10-year treasury yield ($TNX) has fallen back 12 basis points to 4.57%; it was at 4.51% earlier today, though, so mixed signals from the bond market
- Volatility ($VIX, -1.09%) tumbled this morning to below 16, but it has bounced back above 17 with today's intraday weakness
- Crude oil ($WTIC, -1.13%) has dropped back towards $90 per barrel after piercing $94 just yesterday
- Energy (XLE, -1.76%) is today's worst-performing sector, suffering from the sudden drop lower in crude
- Meanwhile, two of the top groups today are consumer discretionary (XLY, +0.61%) and technology (XLK, +0.47%)
- Over the past 3 months, defensive sectors have traded worse than aggressive sectors; this isn't the usual recipe for Wall Street preparing for a further drop ahead
- After a miserable last 4-5 months, Nike (NKE, +7.06%) is the top-performing stock in the S&P 500 today after reporting EPS well ahead of expectations (.94 vs. .75), though revenues fell slightly shy of expectations
Market Outlook
Today's gap up and subsequent selling certainly isn't providing a great look, but remember that an uptrend on a daily chart is usually measured by its daily lows holding. Higher highs and higher lows is what we want to see and, right now, that's what we have. Clearly, it's not overly convincing, but the trend remains in play. Here's the S&P 500:
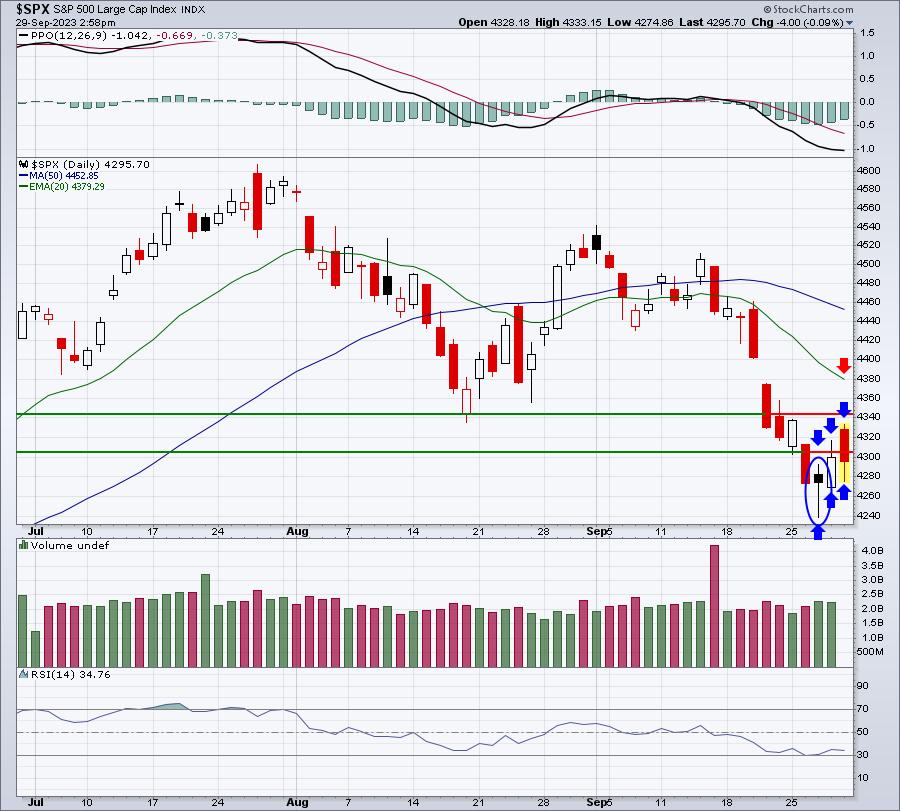
Couple points. First, the blue arrows highlight the higher highs and higher lows currently in play, despite much intraday weakness. I'd like to see a strong finish today to keep the upward momentum strong. We did have a hammer print on Wednesday, and we are now in a more bullish historical period.
There are key price resistance levels (horizontal lines above) at 4305 and 4340, but I believe, from a trend-following perspective, that the 20-day EMA (red arrow) is very important. A move back through argues AGAINST a downtrend and FOR further sideways consolidation that could include more short-term strength.
Sector/Industry Focus
Utilities (XLU) have now reached a very important support level. I'd expect a bounce in this defensive sector from this level:
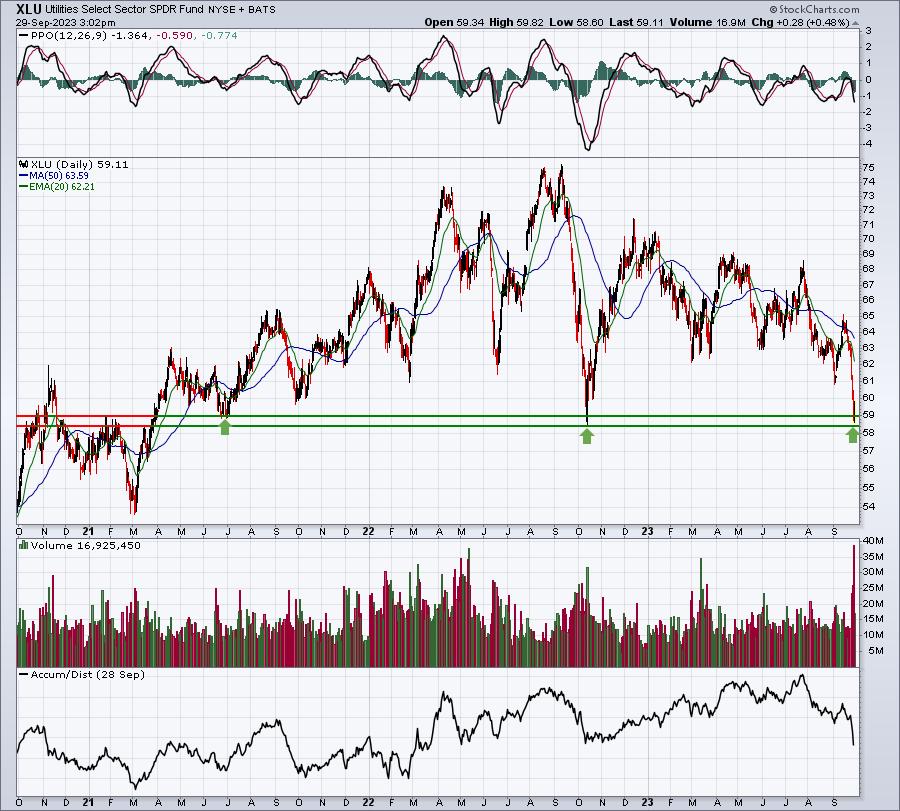
Since early 2021, EVERY trip down beneath 59 on the XLU has been met with strong buying. Do we bounce again?
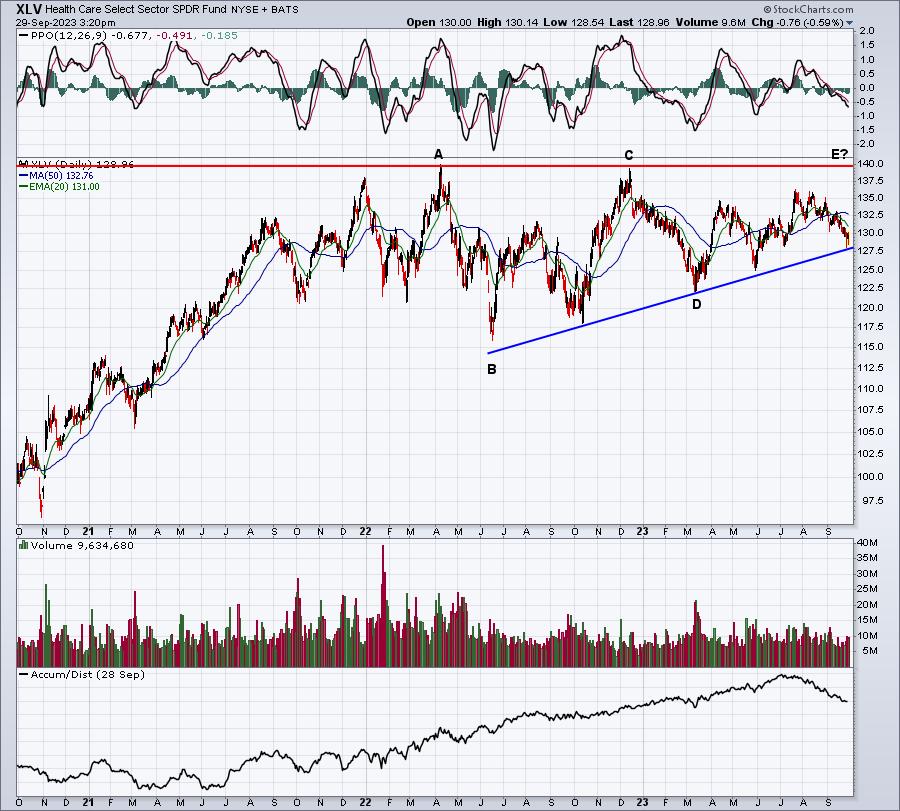
Meanwhile, another defensive sector - health care (XLV) - is testing a rather important uptrend line in a very bullish ascending triangle pattern. These A-B-C-D-E patterns do not execute until the overhead price resistance is broken. That's Point E and that would occur if the XLV can ultimately clear 140. The pattern falls apart, however, if the uptrend line fails to provide support. Check this out:
ChartLists/Strategies
I continue to sit on my hands when it comes to individual stocks. I much prefer ETFs, because of the risk with the VIX still elevated. I am still sticking with the market on the long side right now, especially if we continue to see higher highs and higher lows. I am also in the leveraged TNA, which tracks the Russell 2000 at a 3 to 1 clip. I also have the TQQQ, the highly-leveraged ETF that tracks the QQQ. Basically, I still expect to see a short-term rally. There are no guarantees and the basic ETFs like QQQ, SPY, and IWM probably make much more sense for most investors, if you believe like I do that we'll see higher prices ahead in Q4. I admittedly take on higher risk via leveraged ETFs like the TQQQ and TNA, but they should not be considered by most.
Earnings Reports
Here are the key earnings reports for the next two days, featuring stocks with market caps of more than $10 billion. I also include notable companies with market caps below $10 billion. Finally, any portfolio stocks that will be reporting results are highlighted in BOLD. If you decide to hold a stock into earnings, please understand the significant short-term risk that you are taking. Please be sure to check for earnings dates for any companies that you own or are considering owning.
Friday, September 29:
CCL
Monday, October 2:
None
Economic Reports
August personal income: +0.4% (actual) vs. +0.4% (estimate)
August personal spending: +0.4% (actual) vs. +0.5% (estimate)
August Core PCE price index: +0.1% (actual) vs. +0.2% (estimate)
September Chicago PMI: 44.1 (actual) vs. 47.9 (estimate)
September consumer sentiment: 68.1 (actual) vs. 67.7 (estimate)
Happy trading!
Tom