
EB Daily Market Report - Wednesday, October 4, 2023
Executive Market Summary
- Futures turned green overnight and we saw gaps to the upside at the opening bell
- Small caps remained weak and trailed, especially this morning
- All of our major indices are strengthening, however, into the close, which is a short-term positive
- Most commodities are lower, led by a HUGE decline in crude oil ($WTIC, -5.07%), which is now below $85 per barrel
- The 10-year treasury yield ($TNX) has dropped 7 basis points to 4.73%, aiding U.S. equities
- Energy (XLE, -3.47%) is very weak due to the drop in crude, but our more aggressive sectors are rebounding nicely
- Consumer discretionary (XLY, +2.07%) and technology (XLK, +1.36%) are leading all other sectors higher
- Automobiles ($DJUSAU, +5.18%), led by Tesla (TSLA, +6.02%), are having an exceptional day
- As you might expect, energy names litter the S&P 500 laggards today, led by Schlumberger (SLB, -5.42%)
Market Outlook
I continue to look for capitulation, which I define as a high volume selloff and reversal. It might be a bit more complicated than that, looking at options, rotation, and the like, but the basic capitulation involves a big selling period, followed by a big buying period - many times in the same day. I still haven't seen that, although the IWM looked like it might reverse off this morning's heavy volume selling. We still have another hour left, so maybe that still happens, but it certainly doesn't feel like capitulation to me right now.
Another possible bottom to look for would be an island cluster reversal. Check out the NASDAQ 100 ($NDX) as a possibility:
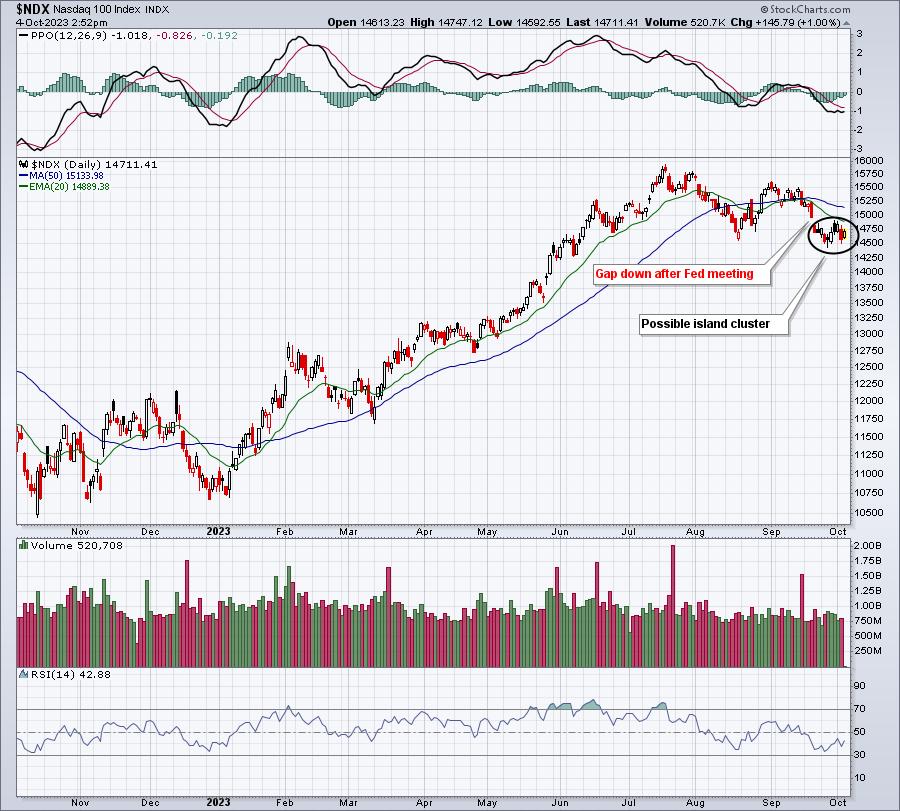
I've personally moved back into the market today, but not 100%. I'm in about 50%, spread around the SPY, QQQ, and IWM. I'd like to get past the Friday jobs report before committing 100%. I moved out of my positions yesterday, because I didn't want to get caught up in a big gap open to the downside.
So far, so good. But let's see what happens through the jobs report.
Sector/Industry Focus
I like to see the number of intraday equity puts escalate as a potential sign of capitulation. Retail traders will many times mark a very significant bottom by "piling into" puts at the very bottom of a market decline. Usually, you can see it by studying the half-hour equity only put call readings over at cboe.com. They provide cumulative totals for every half hour and, by doing a little simple math, you can quickly determine the equity only put call ratio by each half hour. The latest reading that I just saw was NUTS. It's the type of half hour reading that we might see at the very bottom of a complete market meltdown. We're not seeing a meltdown right now. In fact, our major indices are either up for the day or slightly lower. There's been no reason today to see panicked put option buying. Yet the latest half hour equity only put call reading was 7.71, if you do the math - CRAZY!
I'm not sure what to make of it, but I wanted to make all of you aware that the pc ratio today is going to SOAR. But it's not from retail traders panicking. It's much more likely that professionals are hedging. We'll have to keep this in mind when evaluating the equity only put call ratio on StockCharts.com.
ChartLists/Strategies
I haven't focused on individual stocks much recently, because I've felt the downside risk was too great, especially as Volatility ($VIX) rose after the latest Fed meeting and policy statement. I still don't feel great about trading individual stocks, but I do believe we're getting very close to a bottom in the market. So it's probably not a bad time to consider stocks that have been holding up fairly well and show an approaching support level that could present a solid reward-to-risk trading opportunity.
I'll focus on stocks with SCTRs above 95 that are on both our Strong Earnings and Raised Guidance ChartLists:
LII:
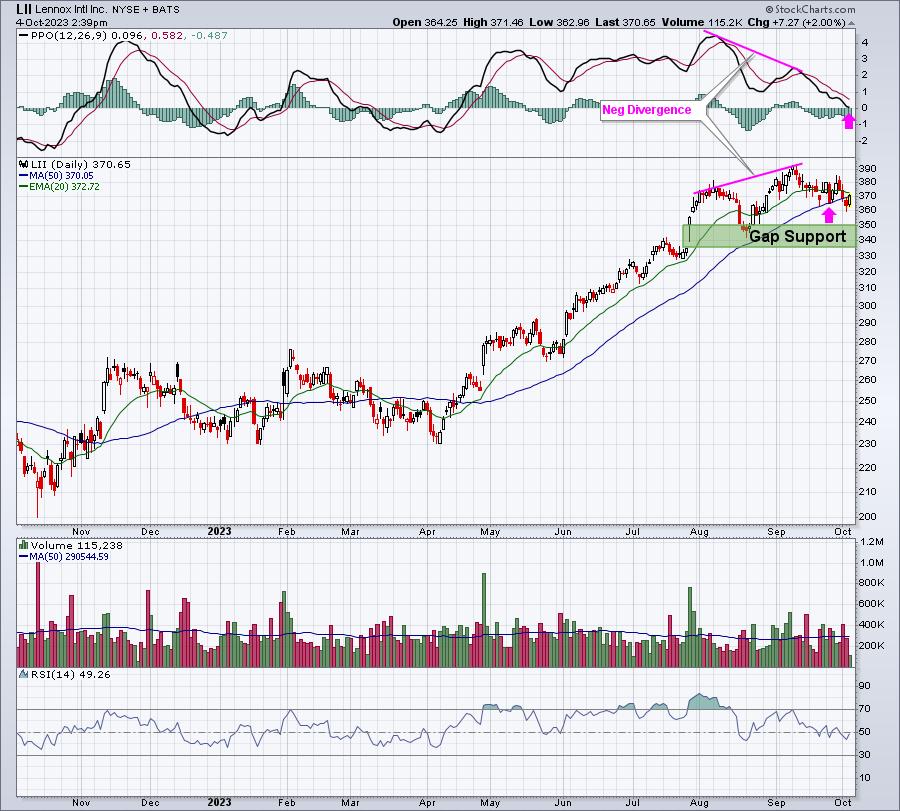
LII is in a very nice uptrend, but it's pulled back to test its 50-day SMA and PPO centerline AFTER we saw a negative divergence print. It's also worth noting that its 20-week EMA (not shown above) is roughly 345. There's a major gap support from 335-350. If LII pulls back further, its reward-to-risk only improves. And it absolutely LOVES the calendar month of November (October ain't bad either). LII has risen during the month of November for the past 15 years. Currently, the solid technical view on LII, combined with upcoming strong seasonality, suggests this would be a stock to keep on your radar.
Earnings Reports
Here are the key earnings reports for the next two days, featuring stocks with market caps of more than $10 billion. I also include notable companies with market caps below $10 billion. Finally, any portfolio stocks that will be reporting results are highlighted in BOLD. If you decide to hold a stock into earnings, please understand the significant short-term risk that you are taking. Please be sure to check for earnings dates for any companies that you own or are considering owning.
Wednesday, October 4:
RPM, AYI, HELE, TLRY
Thursday, October 5:
STZ, LW, CAG, LEVI, AEHR
Economic Reports
September ADP employment report: 89,000 (actual) vs. 150,000 (estimate)
August factory orders: +1.2% (actual) vs. +0.2% (estimate)
September ISM services index: 53.6 (actual) vs. 53.5 (estimate)
Happy trading!
Tom