
EB Weekly Market Report - Monday, October 9, 2023
Note:
I tested one change, which was to eliminate Excel images from being posted on the EB Weekly Market Report and simply post text. It appeared to help in terms of the presentation on both Yahoo and gmail email accounts. Our final product should result in a "scroll-free" report and we hope to have this final product complete by the end of the month. In the meantime, feel free to let us know if today's presentation helped for those of you having to scroll considerably in recent weeks to read text. You can reach us at "[email protected]". Thanks!
Weekly Market Recap
Major Indices
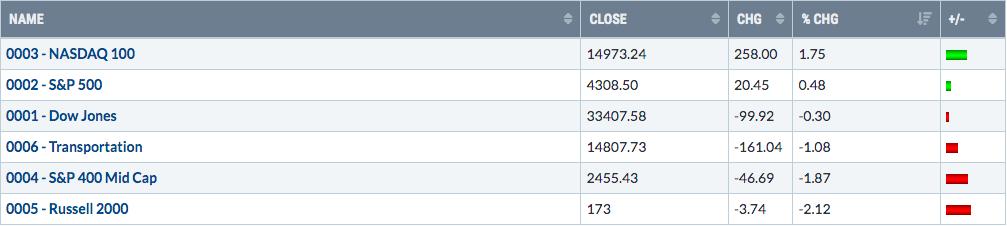
The NASDAQ 100 ($NDX) was easily last week's best-performing index, nearly clearing the psychological 15000 level in the process. There were short-term technical positives, however, as Friday's close did clear the 20-day EMA. That's a signal that we remain in a sideways, consolidation period. We also managed to close slightly above gap resistance at 14969:
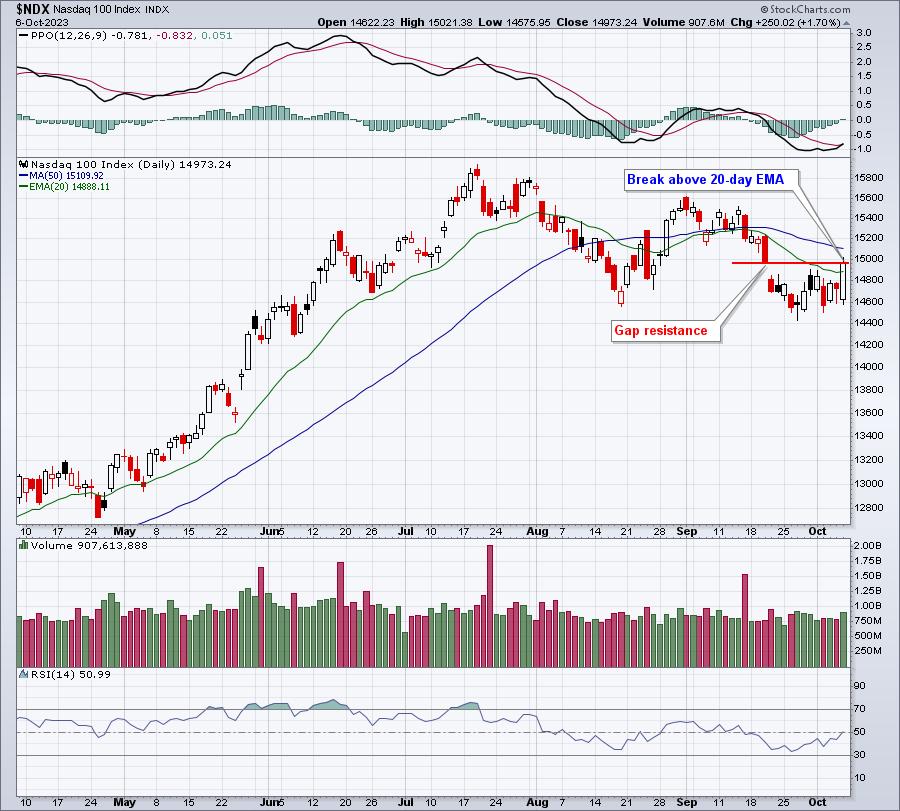
I also liked to see the uptick in volume to accompany Friday's strength.
The Russell 2000 (IWM) was last week's weakest index, but it may have a printed a reversing candle similar to the candles that printed at the March 2023 and October 2022 lows:
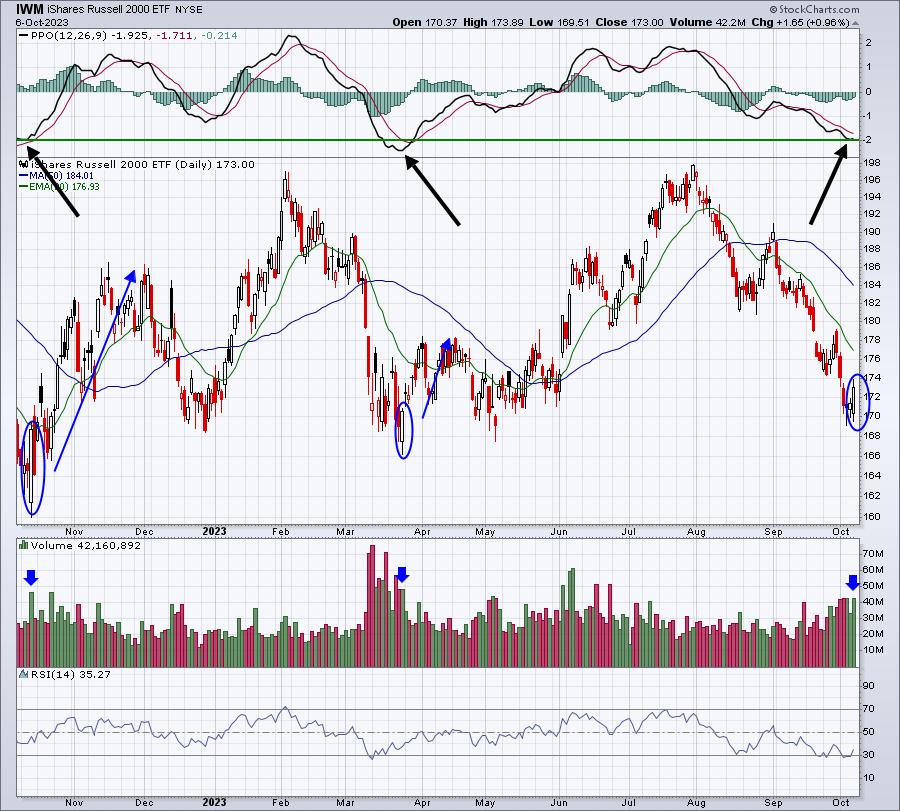
In the past, the IWM has risen off of lengthy hollow candles on volume above 40 million shares. That's exactly what we saw on Friday - a significant hollow candle and 42 million shares traded.
Next week should be very interesting.
Sectors
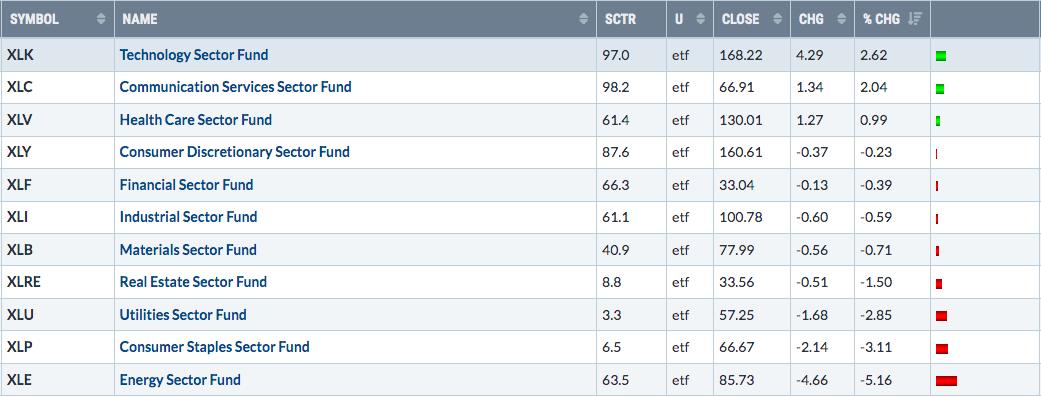
As I pointed out at the beginning of today's WMR, we didn't exactly have a great week. We saw mostly a narrow pocket of strength in the NASDAQ 100. Well, when we look at the sector strength last week, it really helps to clear things up. With the exception of health care (XLV), the other sectors in the Top 6 were all aggressive sectors. I love to see leadership from technology (XLC), communication services (XLC), and consumer discretionary (XLY) and they finished last week in the 1st, 2nd, and 4th spots, respectively, on the sector leaderboard. Under the surface, rotation has been favoring these aggressive areas since the last Fed meeting - something rarely discussed in mainstream media.
Top 10 Industries Last Week
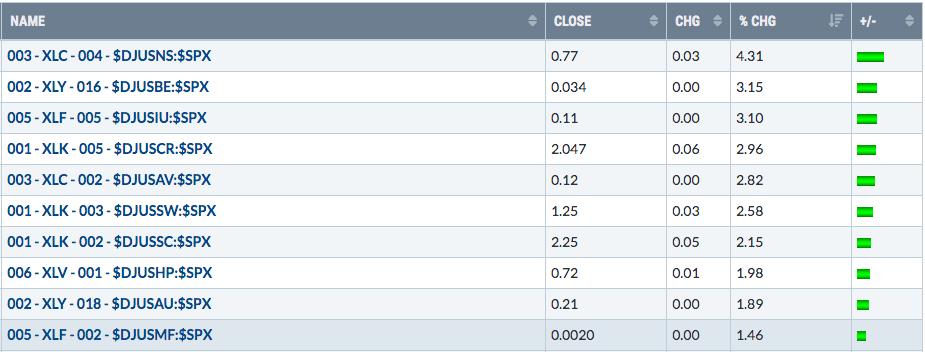
Are you ready for this? Internet stocks ($DJUSNS) are on the verge of breaking to a fresh new 52-week high and currently reside in a very bullish A-B-C-D-E ascending triangle continuation pattern:
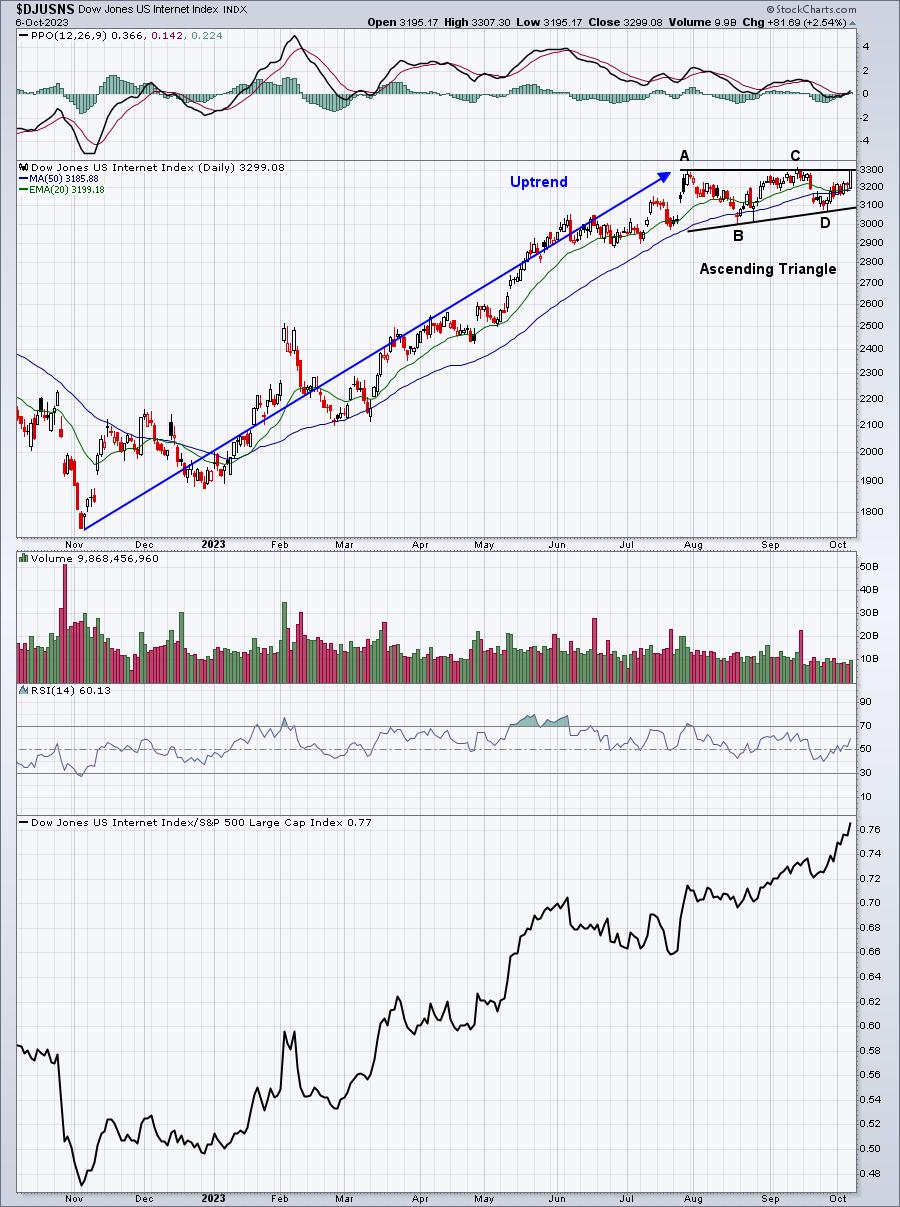
The only thing missing is E, the breakout.
Bottom 10 Industries Last Week
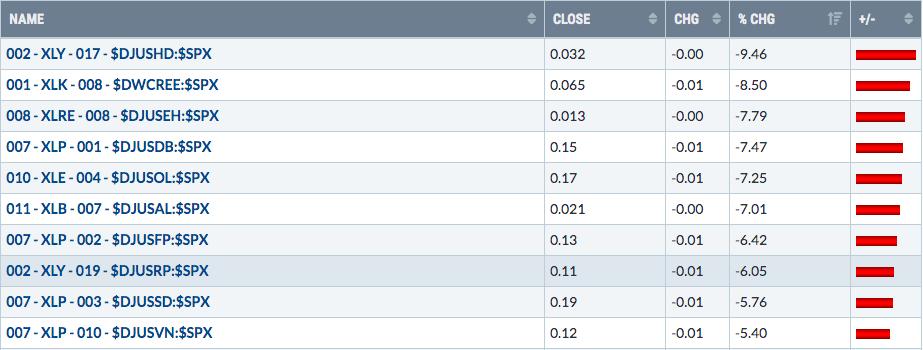
For two of these groups, I expect to see significant recoveries, perhaps starting with next week. Check out these two charts:
$DWCREE:
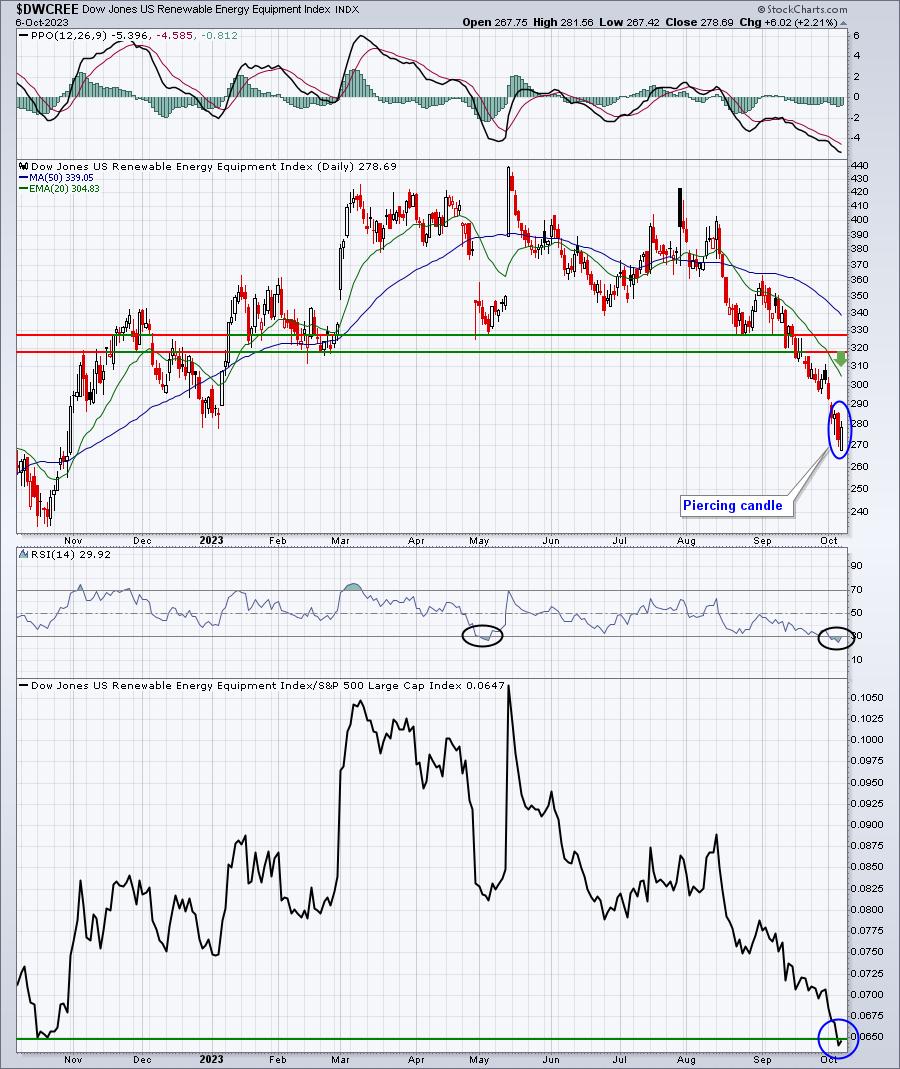
I liked the reversing, piercing candle that printed on Friday. Renewable energy stocks are incredibly oversold we their relative strength actually moved just beneath the October 2022 relative low. On any bounce to the upside, first watch the 20-day EMA as key resistance. Beyond that, price resistance between 318-328 is the next key overhead level.
$DJUSSD:
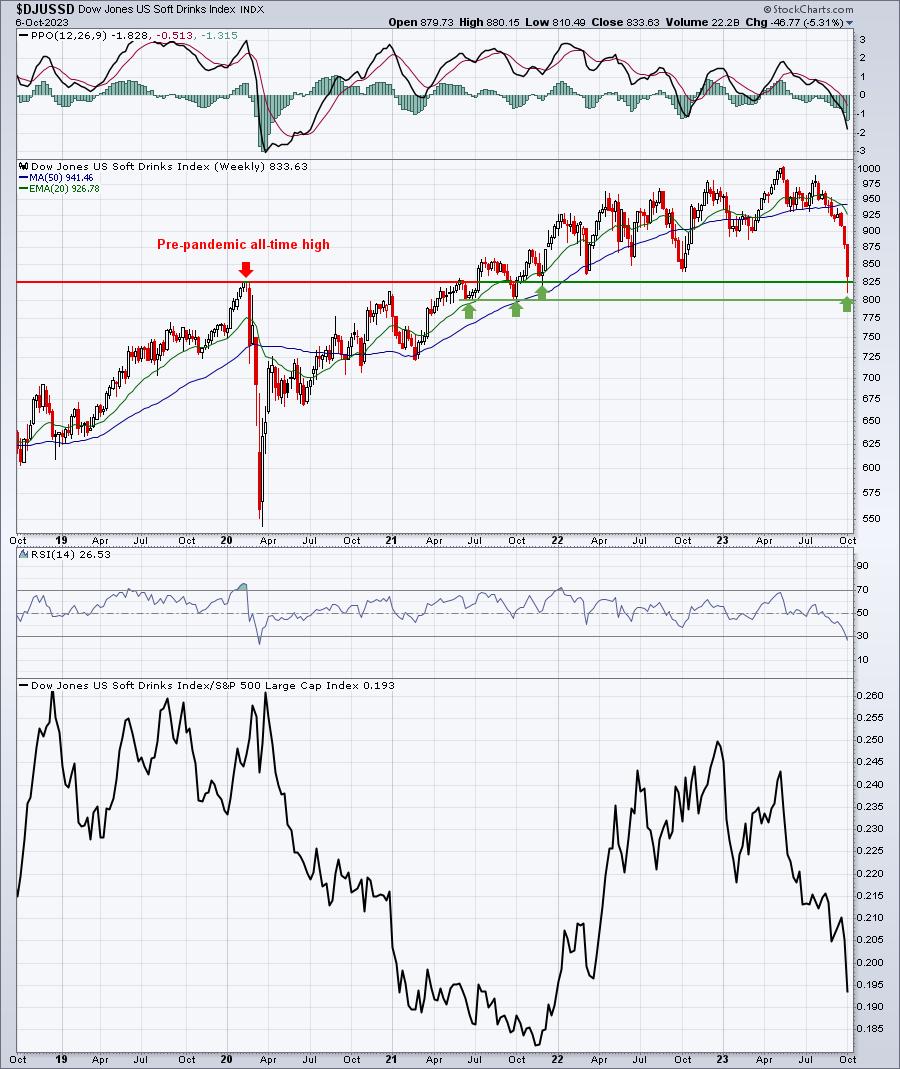
The pre-pandemic all-time high was roughly 825. That level has generally provided excellent support over the past 2-3 years. We tested it again on Friday before reversing.
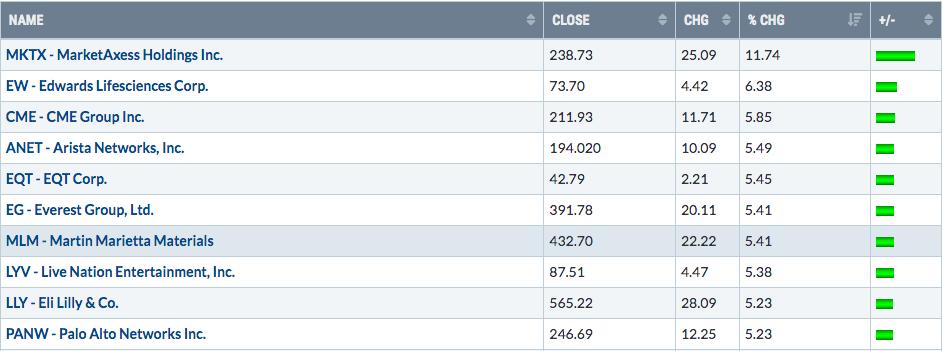
Top 10 Stocks - S&P 500/NASDAQ 100
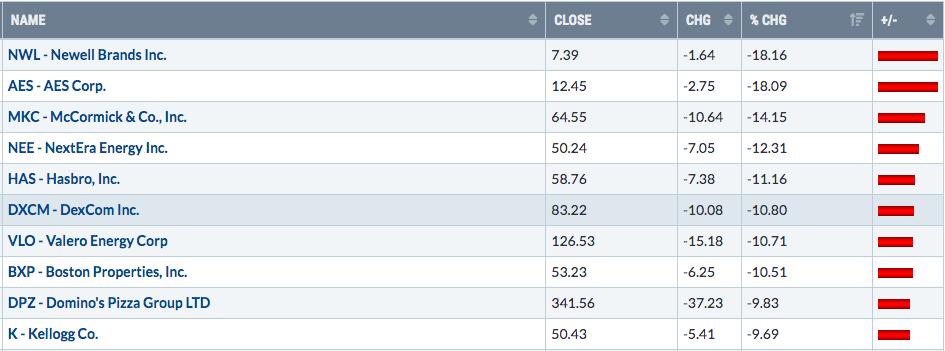
Bottom 10 Stocks - S&P 500/NASDAQ 100
Major Indices
Let's start with a daily chart of the NASDAQ 100 ($NDX), which was the first major index to be able to close back above its 20-day EMA:
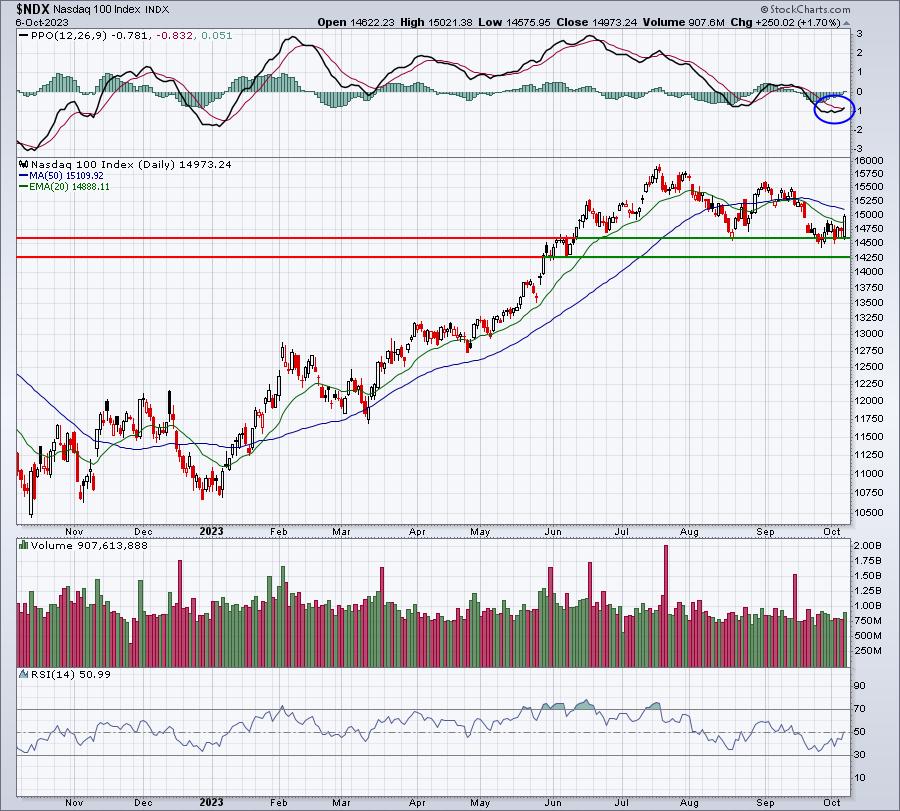
I like the PPO beginning to turn back higher, but there's plenty of technical work to do here, and even more so on our other major indices. While I'm seeing "beneath the surface" signals that suggest we're going higher, price action on the major indices still must do more to confirm that.
Shorter-term, we've definitely seen improvement on all of our 60-minute charts. Instead of downtrending beneath the 20-hour EMA and 50-hour SMA, we find ourselves starting an uptrend above them - except for the small cap IWM. It still has a bit of work to do:
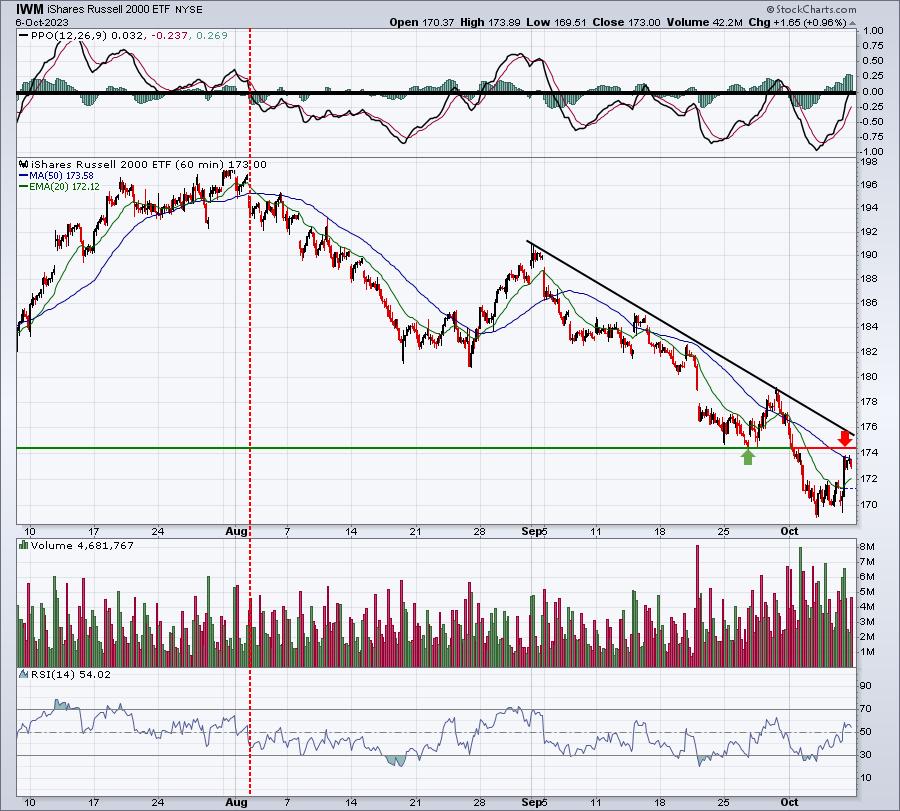
The hourly PPO just broke above its centerline and we haven't seen much of that since the beginning of August. Is it the start of a bigger move higher? Or is this just another small cap tease, before dropping to new lows again. I suspect it's the former, but there's not doubt that small caps have been lagging badly.
Intermarket Relationships
We definitely want to take a look at the User-Defined Indexes (UDI) that I've been tracking, as we saw a couple breakouts that suggest the market is turning much more bullish.
Consumer discretionary vs. Consumer staples (XLY:XLP):
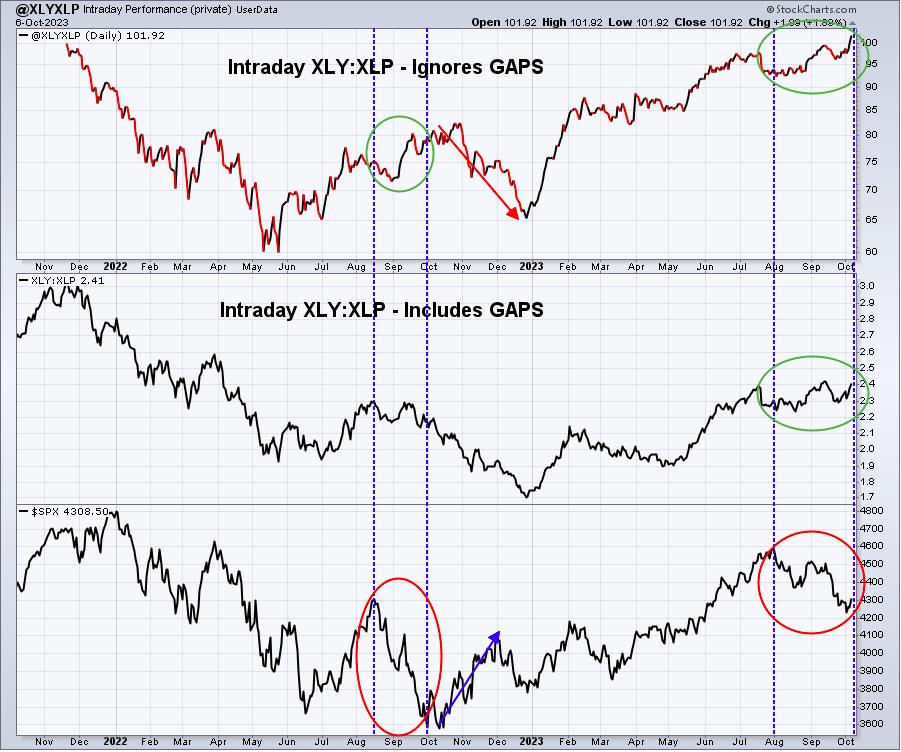
I suspect the S&P 500 is prepping for a significant move higher during the balance of Q4. Money rotating decisively into discretionary stocks (from staples) throughout the trading day (ignoring gaps), which is what the top part of this chart shows, is NOT a signal of an upcoming recession. This chart would have to change considerably before I'll believe that line of thinking. What I'm still very undecided on is whether areas like technology (XLK) continue to provide leadership during the remainder of Q4. That brings me to my other UDI, the QQQ vs. the SPY.
NASDAQ 100 vs. S&P 500 (QQQ:SPY)
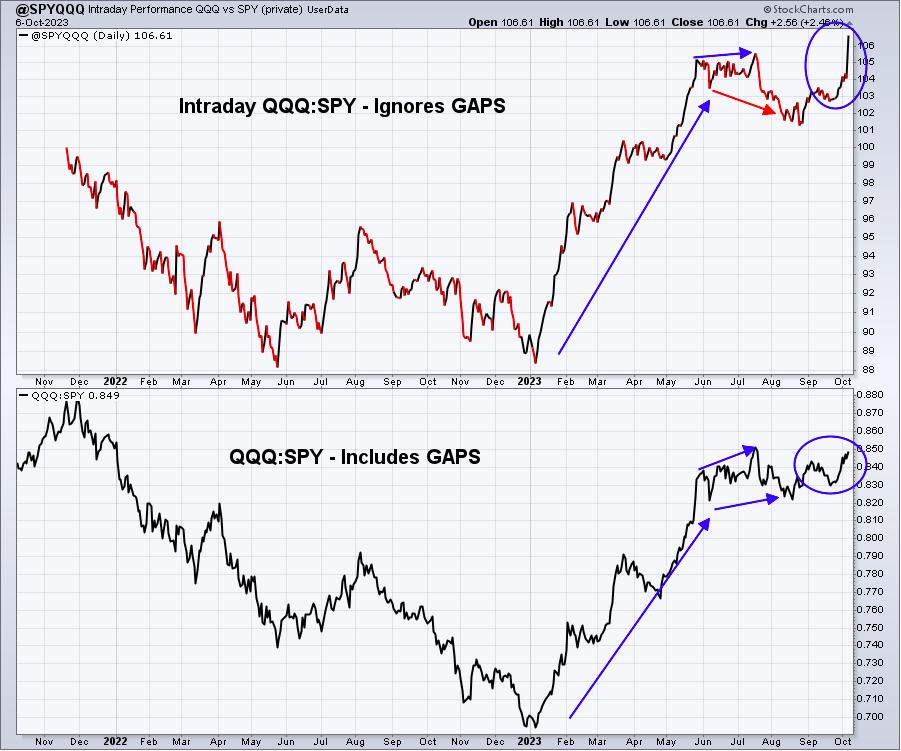
I have to admit this ratio absolutely scorched higher on Friday, breaking out in the process. The intraday ratio remains stronger than the daily ratio that includes gaps. In other words, it's not yet painting a signal that money will rotate from our more aggressive sectors like the XLK, XLY, and XLC, and into more value-oriented sectors like XLI and XLF. Historically, we generally see the latter. But that really hasn't materialized in Q4 2023. It's something I'll continue to monitor closely from week to week.
Sentiment
Last week, I said that I would find it difficult to believe that we'd see significant downside action with still so much negativity (high put call ratio) among retail options traders. After falling slightly to open the week, the S&P 500 traded mostly sideways until the Friday jobs report. The numbers supported the Fed's "higher rates for longer" discussion from its latest meeting. Yet traders poured into stocks, especially the more aggressive areas. The equity only put call ratio ($CPCE) still remains elevated and that should help provide a big lift to the bulls as they try to continue the bullish momentum late last week:
You can see from history what happens when options traders are stubbornly pessimistic. It usually doesn't end well for them.
Inflation
CPI and PPI coming up this week. We've now seen 3 monthly CPI readings below .30 and the annualized reading based on those 3 readings is 2.4%.
Trade Setups
Let me first recap all stocks that have been mentioned here since I began writing the Weekly Market Report:
JPM:
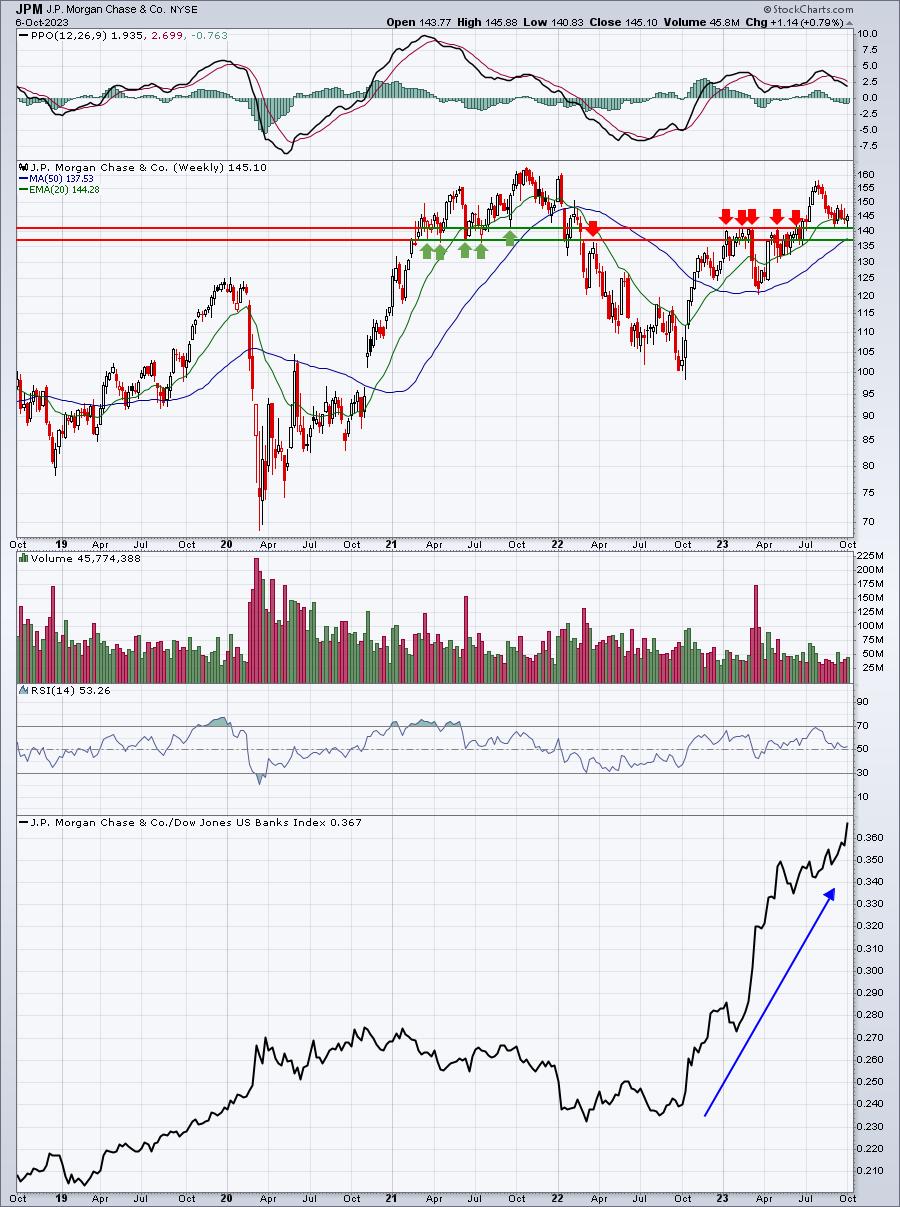
It continues to hold onto the support mentioned several weeks ago.
BA:
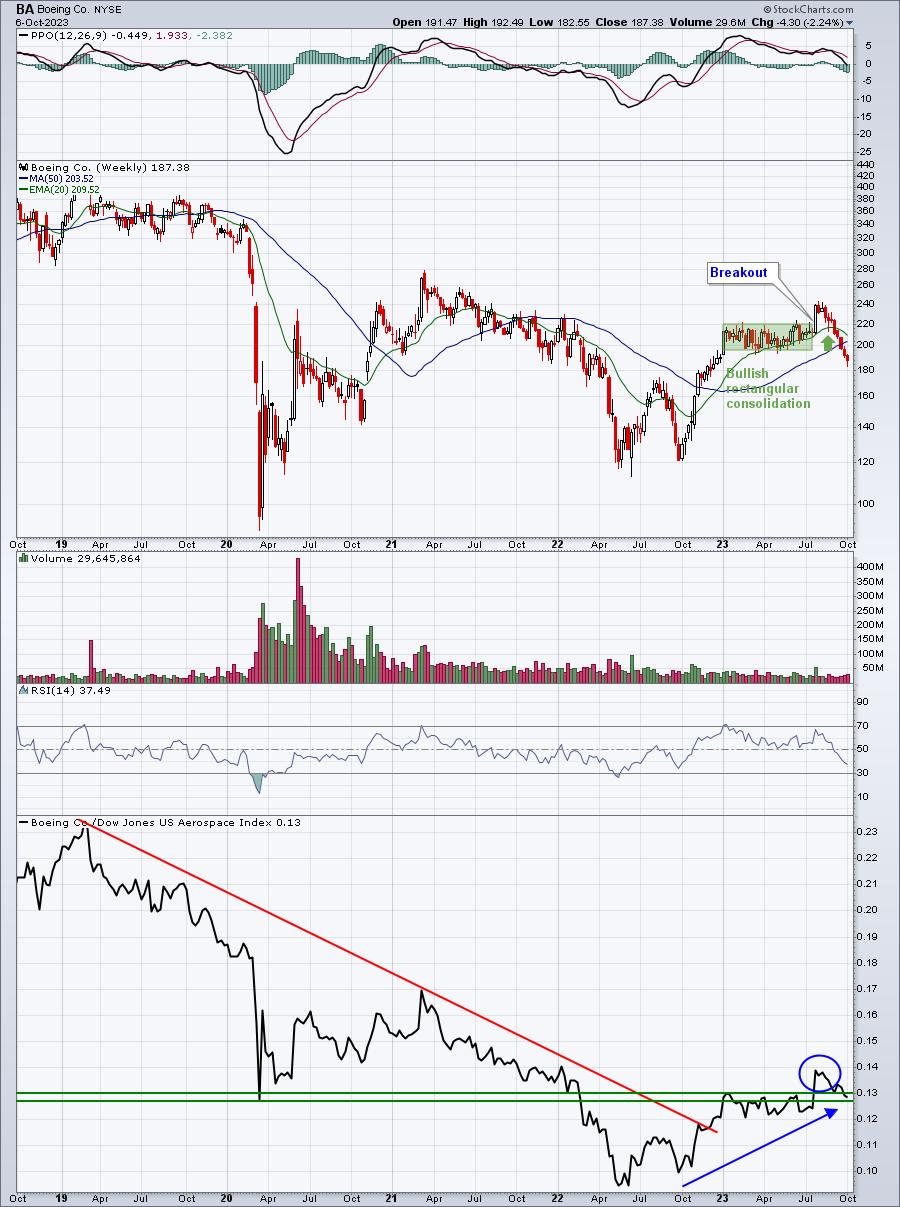
BA has fallen precipitously, right along with the airlines group. The breakdown beneath price support in the 195 area. Last week, I mentioned that I wouldn't blame anyone who has sold and that a trip back above 192 or so might trigger a buy signal. It's important to note that BA remains in a solid uptrend on a relative basis vs. its peers. So, if the group rebounds, expect BA to do likewise.
FFIV:
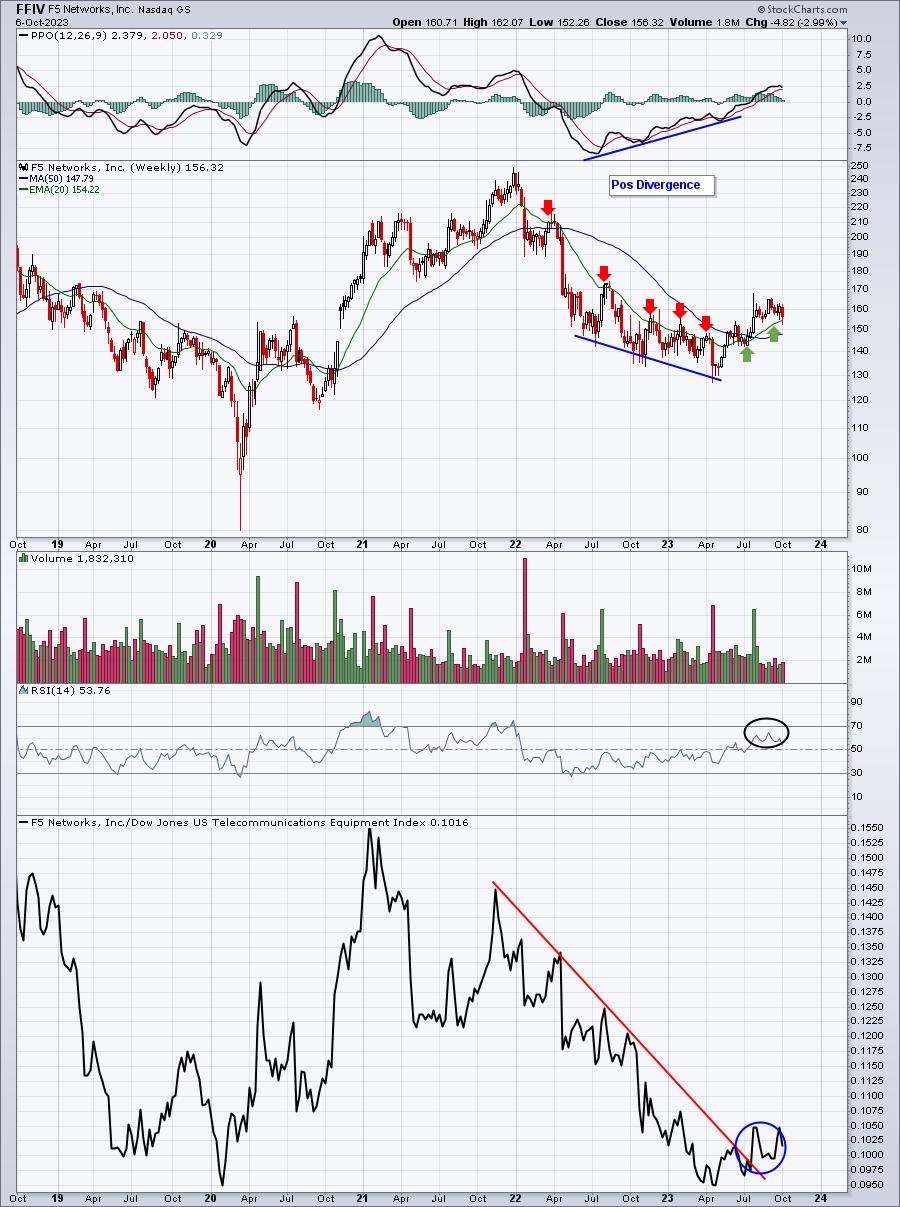
Continues to trend up and has held its rising 20-week EMA.
UPWK:
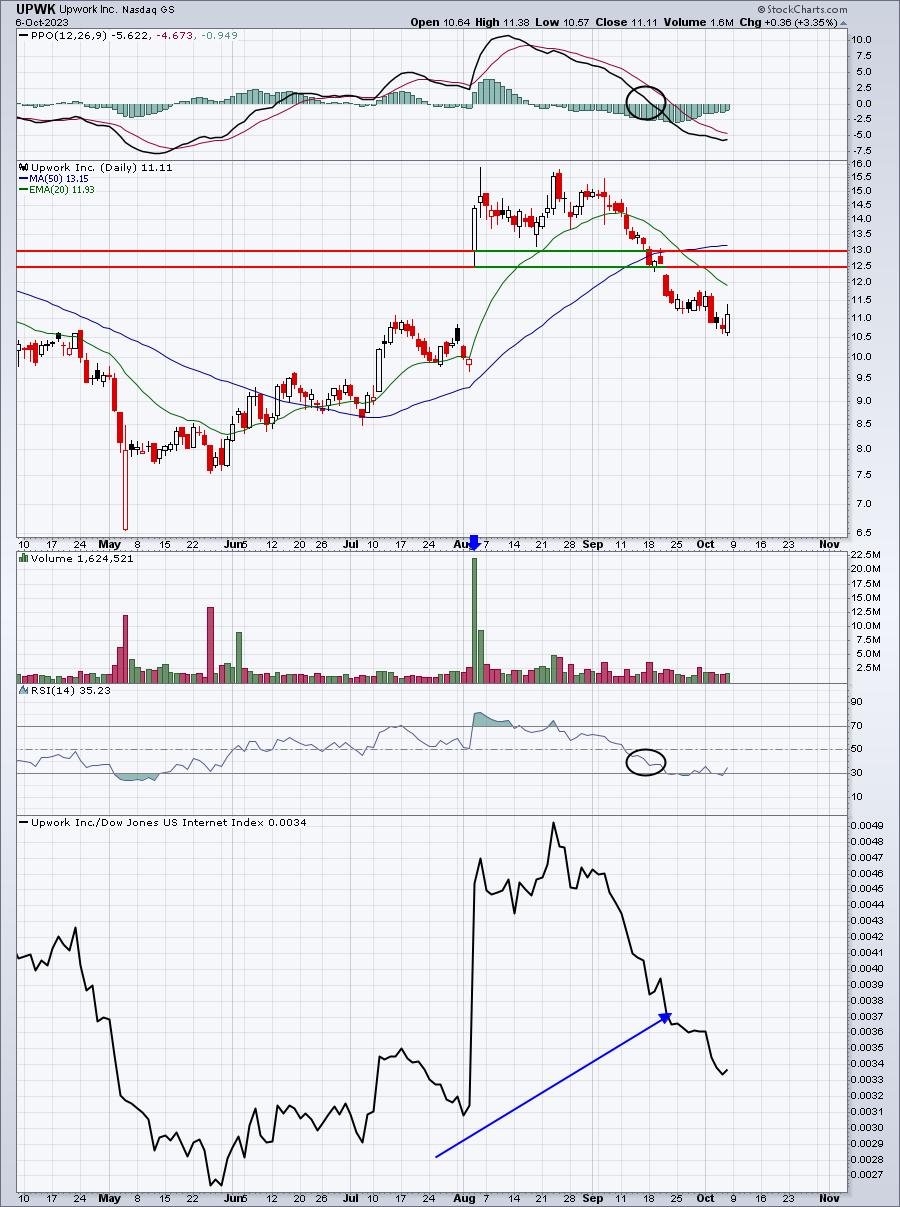
There was a wide area between the top of gap support and the bottom of gap support. UPWK was originally provided as a trade setup, expecting the top of gap support to hold. Two key levels of price support were provided and they were both lost. UPWK continued moving lower and printed a nice bullish engulfing candle on Friday. It neared the bottom of gap support, but hasn't quite tested it yet. The best entry or re-entry into UPWK resides just below 10.
MA:
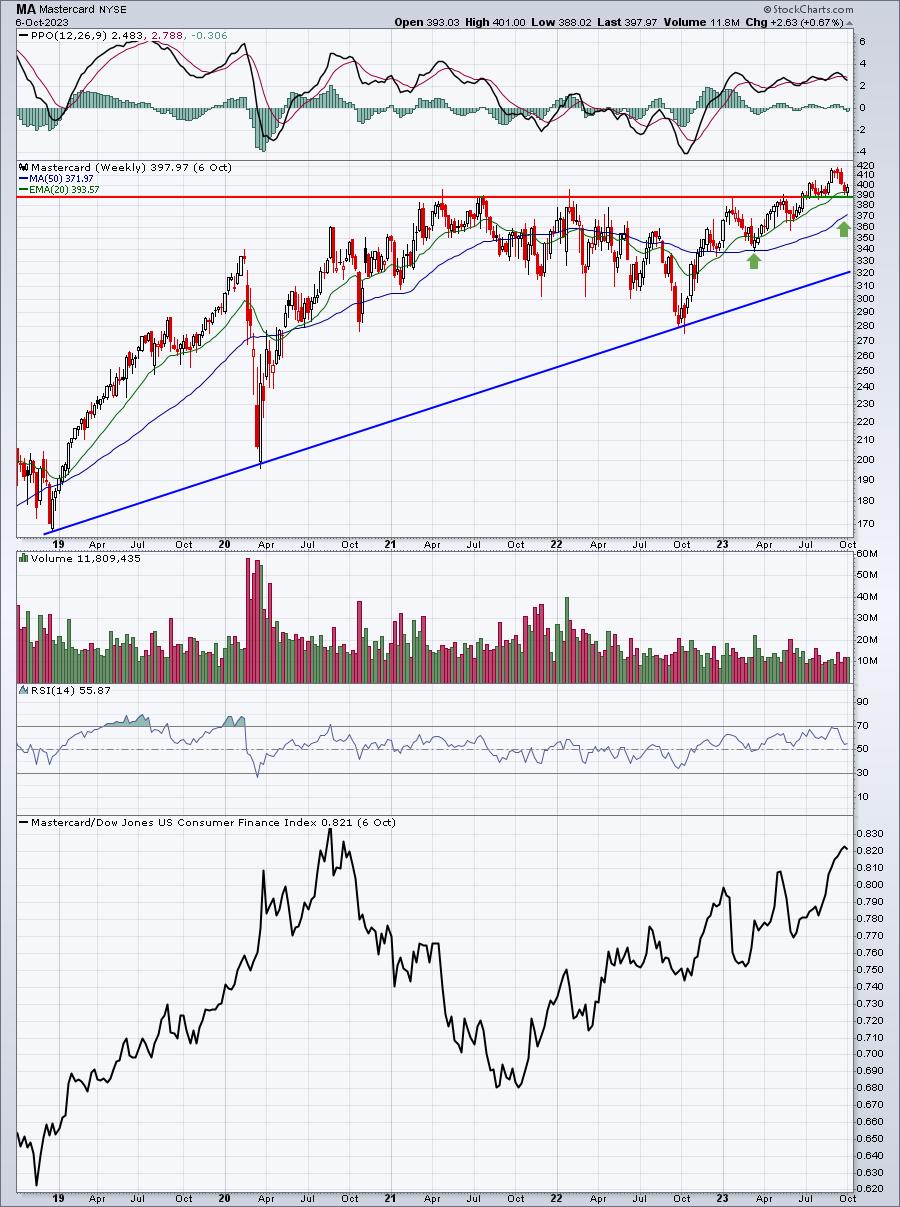
MA is still trading above its rising 20-week EMA and price support near 390.
GS:
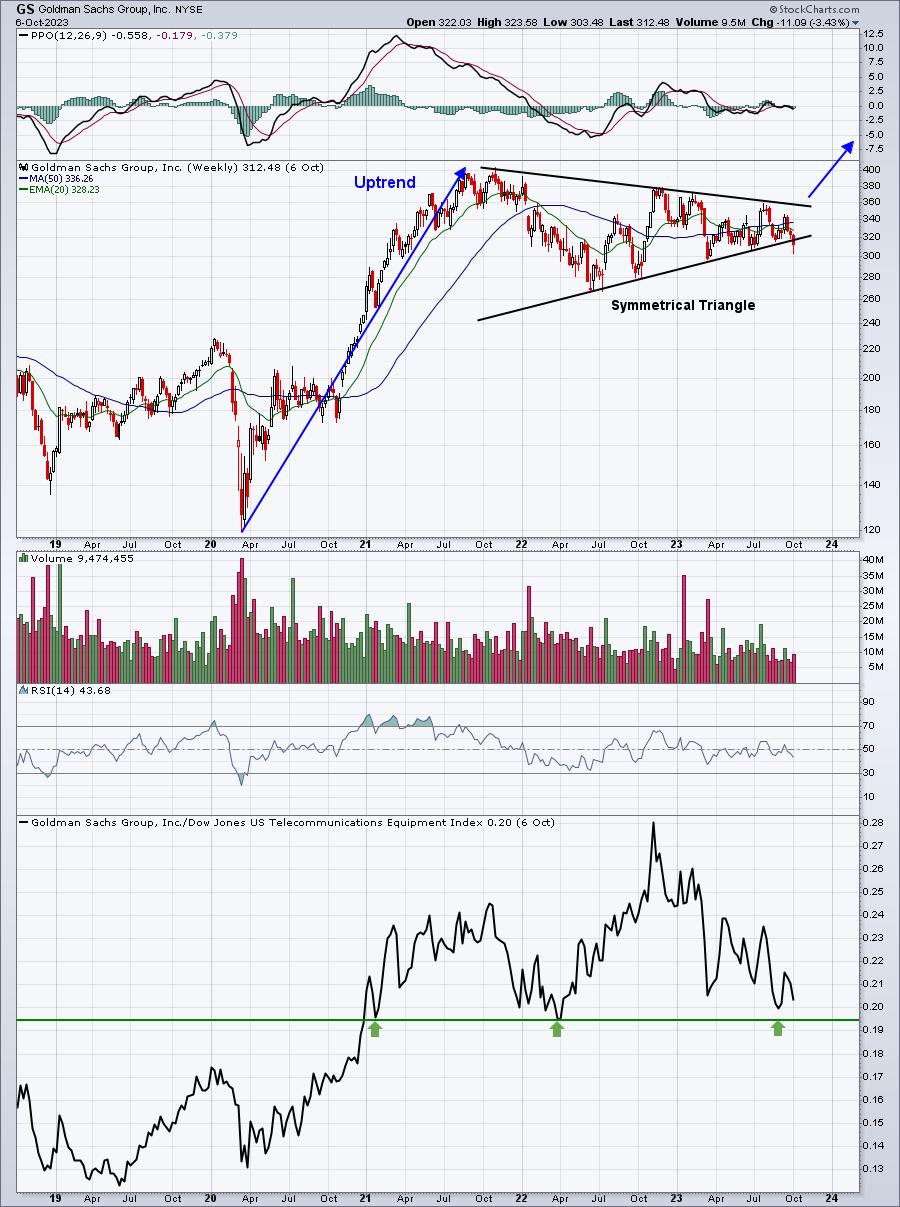
It appears to have broken just beneath that lower uptrend line in the GS channel. However, as I've said many times, trendlines and channel lines are quite subjective and it would be quite simple to just lower that lower trendline to make everything "fit". More importantly, I suggested to watch 310 as key price support. We closed last week at 312, so I'm still fine with GS, but I'd like to see a rally this week.
I don't have any others to add this week. I'd like to get beyond those two inflation reports and check out the early earnings reports coming out.
I want to ALWAYS remind everyone that I am NOT a Registered Investment Advisor (RIA) and am not recommending that anyone buy or sell any securities that I mention. EarningsBeats.com, nor any of its employees, are RIAs. Please consult your financial advisor before buying or selling any securities. The above analysis is for educational purposes only. You are fully responsible for any securities that you buy or sell.
Looking Ahead
Upcoming Earnings
We won't see much in the form of market-moving earnings reports this week. Here are a few interesting companies reporting this week, however, by day and with market cap in parenthesis:
Monday: None
Tuesday: PEP ($220 billion)
Wednesday: None
Thursday: INFY ($73 billion), FAST ($31 billion), DAL ($23 billion)
Friday: UNH ($478 billion), JPM ($415 billion), WFC ($144 billion), BLK ($96 billion), PGR ($83 billion), C ($78 billion), PNC ($48 billion)
Key Economic Reports
The Fed meeting is out of the way, but there's still plenty for us to consider this week:
Monday (Columbus Day): None
Tuesday: None
Wednesday: PPI, FOMC minutes
Thursday: CPI, initial jobless claims
Friday: Consumer sentiment
Historical Data
Each week, I'll provide you the average annualized returns for each calendar day and by index. Here are the historical numbers for this week (I'm not using an Excel image this week, because this has been a big part of our presentation issues in emails):
S&P 500
- October 9: -69.99%
- October 10: +9.89%
- October 11: +24.23%
- October 12: +13.48%
- October 13: +70.66%
NASDAQ
- October 9: -60.07%
- October 10: +12.20%
- October 11: +76.74%
- October 12: +43.56%
- October 13: +136.42%
Russell 2000
- October 9: -164.35%
- October 10: +104.05%
- October 11: +13.68%
- October 12: +29.56%
- October 13: +92.19%
The S&P 500 data dates back to 1950, while the NASDAQ and Russell 2000 information date back to 1971 and 1987, respectively.
History is now providing tailwinds for stocks.
Final Thoughts
We're now into the 2nd week of October and here's what I'm thinking:
- I remain encouraged by the lack of earnings warnings for Q3 and FY2023. I would once again look for most companies reporting earnings to exceed Wall Street consensus estimates.
- Earnings season kicks off this week. Delta Airlines (DAL) will report their quarterly results on Thursday morning before the bell. DAL remains one of the best relative-performing airline ($DJUSAR) stocks, so Wall Street will be paying a bit more attention to this one.
- JP Morgan (JPM) is a bellwether in the banking ($DJUSBK) area, so all eyes will be on that quarterly report on Friday morning.
- Inflation will be on everyone's mind this week as the September PPI and CPI reports will be released on Wednesday and Thursday mornings, respectively.
- Rotation was excellent last week and points to the big Wall Street firms having a "risk-on" mentality, which is quite bullish.
- The 10-year treasury yield ($TNX) printed a high of 4.89% on Friday, just before the September jobs report was released, but then reversed to print a shooting star candle, which COULD have marked a top; this morning, the TNX is up slightly to 4.80%.
- Higher yields should lead to underperforming growth stocks, but that has not been the case at all since the last Fed meeting. This relationship is definitely one to watch, not only this week, but also throughout the balance of Q4.
- Momentum has flipped. Short-term 60-minute charts now show positive PPOs in most areas, a change from what we've seen throughout much of the recent correction.
- The S&P 500 regained 4305 price resistance, though barely as this benchmark closed at 4308 on Friday. Where do we finish this week. Above 4305 will beat the alternative, especially if we can get those two inflation reports behind us and still be above 4305.
- Finally, can the internet group ($DJUSNS) add on to their strong finish last week? The group is in a bullish ascending triangle pattern and a close above 3304 would represent a breakout. We closed at 3299 on Friday and the chart and pattern were shown earlier in this report.
Feedback
I resized some images to hopefully improve the presentation of today's Weekly Market Report and how it appears in your email. If you'd like to share your experience with today's presentation, please send us your comments to "[email protected]". We plan to make the report much more appealing to the eye, so changes today are just the start. Enjoy!
Happy trading!
Tom