
EB Daily Market Report - Wednesday, October 11, 2023
Aggressive Portfolio Note
We are removing CELH from our Aggressive Portfolio and leaving proceeds in cash for now. The current stock price is 164.35.
CELH is showing heavier short interest and it's broken down recently on its chart, losing 25% in less than one month. It's just bounced higher to test its 20-day EMA and we'd rather be safe with this one and use this strength to exit and limit loss. We might replace it, but if we do, we'll announce it right here in the DMR.
Executive Market Summary
- Futures were higher overnight and our major indices gapped higher at the opening bell
- The 10-year treasury yield ($TNX), whose big drop on Tuesday aided the rally in U.S. equities, is down another 6 basis points to 4.59%
- Cryptocurrencies are having a rough session with bitcoin ($BTCUSD, -2.54%) dropping 700 points
- Most commodities are lower as crude oil ($WTIC, -2.45%) drops beneath $84 per barrel; it's worth pointing out that natural gas ($NATGAS, -0.27%) now trades at $3.37 after breaking out above $3.00
- The stock market is clearly mixed with 5 sectors higher and 6 lower; real estate (XLRE, +1.88%) and utilities (XLU, +1.55%) are leading, while energy (XLE, -1.35%) lags
- Internet stocks ($DJUSNS, +1.46%) are not taking a breather and home construction ($DJUSHB, +1.09%) trades back above its 20-day EMA after weeks of trending lower
- A big September CPI report will be released on Thursday morning at 8:30am ET; I believe a better-than-expected number could really lift equities, we'll see
Market Outlook
This morning, the September PPI was released and it showed what it typically shows - volatility with respect to the headline number. The actual number was +0.5% and the market was anticipating +0.3%. If we strip out the volatile food and energy components, however, then Core PPI actually met expectations at +0.3%. To highlight the volatility in headline PPI, check out this chart:
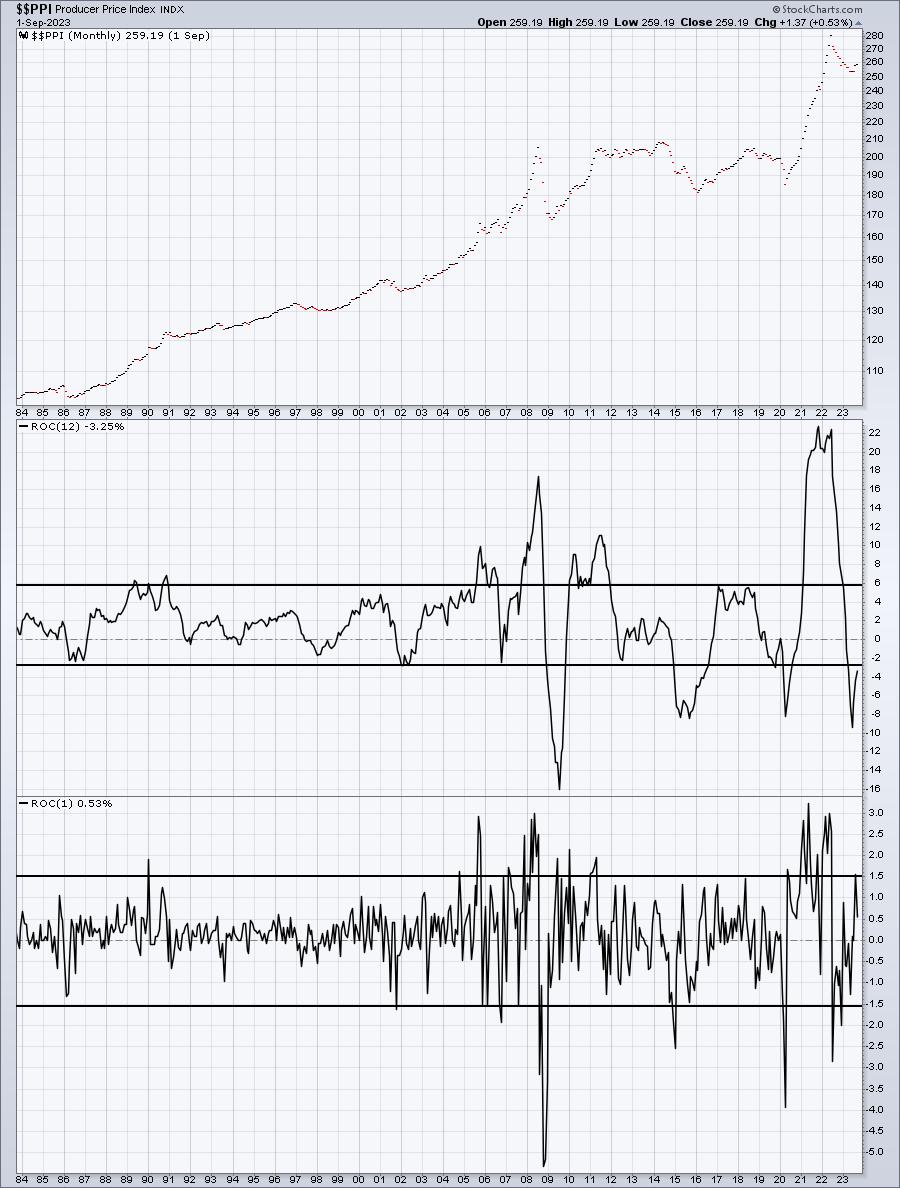
These numbers are all over the place. There's a reason why the Fed sticks with Core data as opposed to headline data that includes the volatile food and energy area. If we just look at 1-month changes (bottom panel), then it's fairly easy to see visually that -1.5% to +1.5% is the "norm". Can you imagine what Fed policy would look like if they were reacting to this data each month?
(By the way, the 12-month ROC, or annual rate of headline PPI, doesn't really correlate with actual information that is released monthly. For instance, the Econoday report of September PPI this morning showed the year over year rate of headline PPI to be +2.2%. In the 12-month ROC panel above, StockCharts shows -3.25%. I don't know why these amounts differ. But I do follow that bottom panel as I've noticed month-to-month changes do agree.
My whole point here is to say that I don't believe Wall Street pays much attention to headline inflation numbers as they're simply way too volatile. Core numbers are much more reliable and meaningful. Tomorrow's inflation report - at the consumer level (CPI) - is the one that the Fed will watch much more closely. Expectations there are that September Core CPI rose 0.3%. I believe any number at or below that level could result in a surge to the upside in U.S. equities. However, if it comes in above expectations, don't be surprised to see at least an initial gap lower.
Sector/Industry Focus
Many times, the stock market simply makes no sense. For instance, given the strong jobs report last week and the Fed's plan for rates to stay higher for longer, you'd think the aggressive growth names would be under intense selling pressure. However, I calculated a 15-day ROC for all industry groups and internet ($DJUSNS) and semiconductors ($DJUSSC) were #1 and #2 of the 104 industry groups. The reason I chose a "15-day ROC" was that the Fed meeting concluded 15 trading days ago. I wanted to see how the stock market had reacted to the Fed's "new information" and the big Wall Street firms collectively said "HOGWASH!" and have been buying these two aggressive areas of the market like their hair was on fire. This is why I follow the charts and not the news.
Meanwhile, I thought I'd feature an industry group that's been trending higher since the Fed - and this one makes much more sense after the stronger-than-expected jobs report:
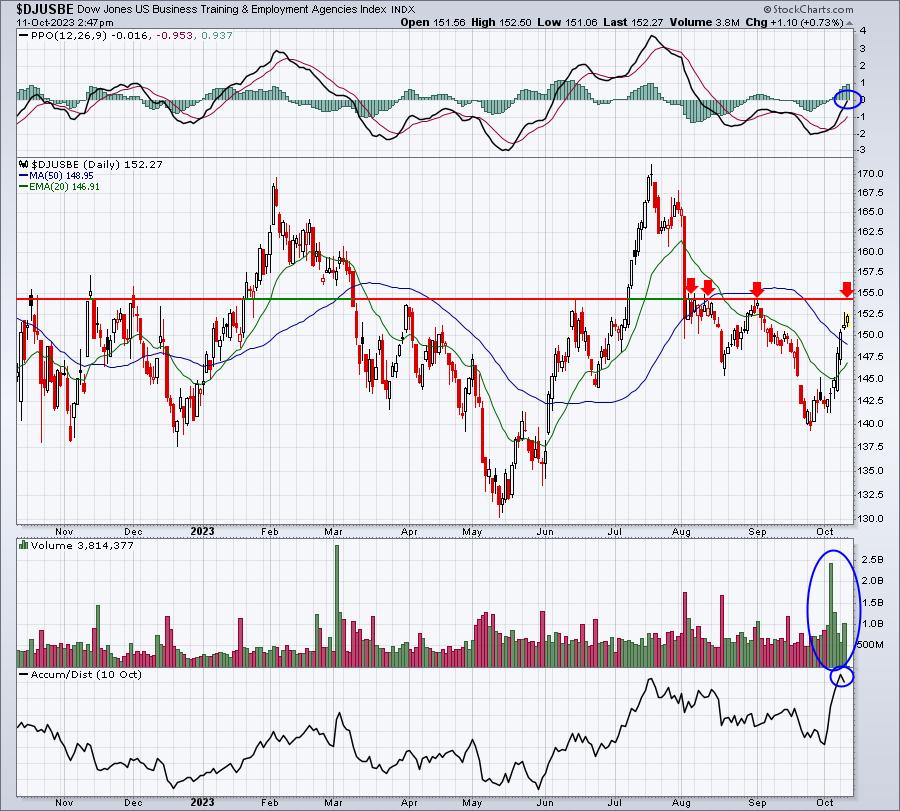
Volume has exploded on this latest move up and the AD line has broken to a new 52-week high. We do still need to clear key price resistance, though, in the 154-155 range. Business training & employment agencies ($DJUSBE) has gained 4.74% since that Fed meeting and appears headed for a breakout above that 155 level, but we do need to see it.
ChartLists/Strategies
If you believe in the renewed strength in business training & employment agencies, you might be interested in a stock within that group, ASGN, Inc. (ASGN), a $4 billion market cap company. I'm watching what appears to be a very nice breakout, in terms of price action:
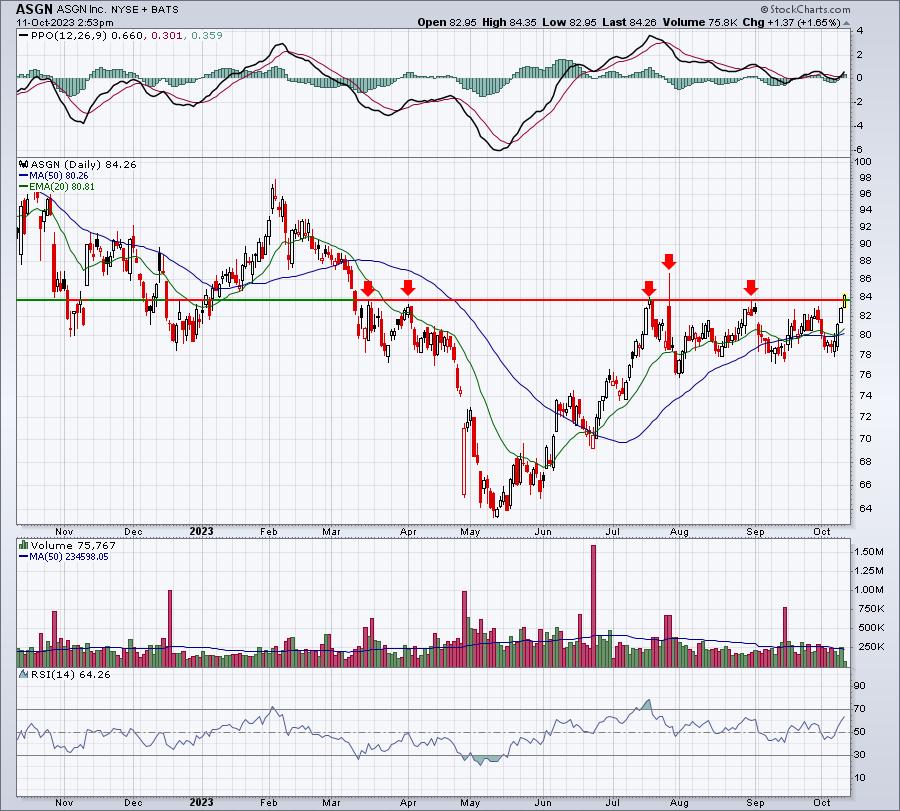
While I do like this price action and, clearly, its peer group has strengthened, I wouldn't take a position from a trading perspective, because there's no volume confirmation. Volume today is actually quite light. If volume picks up into today's close, I'd be much more interested.
Earnings Reports
Here are the key earnings reports for the next two days, featuring stocks with market caps of more than $10 billion. I also include notable companies with market caps below $10 billion. Finally, any portfolio stocks that will be reporting results are highlighted in BOLD. If you decide to hold a stock into earnings, please understand the significant short-term risk that you are taking. Please be sure to check for earnings dates for any companies that you own or are considering owning.
Wednesday, October 11:
WIT
Thursday, October 12:
INFY, FAST, DAL, WBA, DPZ, CMC, SGH
Economic Reports
September PPI: +0.5% (actual) vs. +0.3% (estimate)
September Core PPI: +0.3% (actual) vs. +0.3% (estimate)
FOMC minutes released at 2:00pm ET
Happy trading!
Tom