
EB Daily Market Report - Thursday, October 12, 2023
Friday Schedule
I will be off on Friday and John Hopkins is on a much-deserved European vacation. As a result, there will be no Daily Market Report tomorrow. I will be checking in on the market periodically, however, and if I see anything that needs to be communicated, I'll be sure to quickly pass it along. Otherwise, the Weekly Market Report will be published and sent to members on Sunday or Monday.
Executive Market Summary
- Futures were slightly higher overnight and we opened slightly higher
- Large cap growth-oriented stocks (IWF, -0.77%) were the clear choice in the morning session, but many of those growth stocks have seen significant selling this afternoon
- The 10-year treasury yield ($TNX) is back on the move higher, rising 11 basis points to 4.71% at last check
- The September Core CPI came in at +0.3%, as expected, but selling has nonetheless gripped the market short-term
- Most commodities are lower today, led by copper ($COPPER, -1.04%), which is nearing key price support at $3.55
- 10 of 11 sectors are lower today, with energy (XLE, +0.13%) the lone winner on the session
- Technology (XLK, -0.29%) is the next best sector, which is noteworthy (less bearish) on a turnaround day like today
- Semiconductors ($DJUSSC, +0.15%) were on fire this morning, but have given back the entirety of those gains
- As the TNX rises again, money has once again rotated AWAY from utilities (XLU, -1.91%) and real estate (XLRE, -1.44%); materials (XLB, -1.83%) are also quite weak
Market Outlook
Yesterday, I looked at the headline PPI, showing how volatile it can be and why the Fed pays little attention. So let's look at Core CPI today, which the Fed does pay attention to, now that the September number has been released:
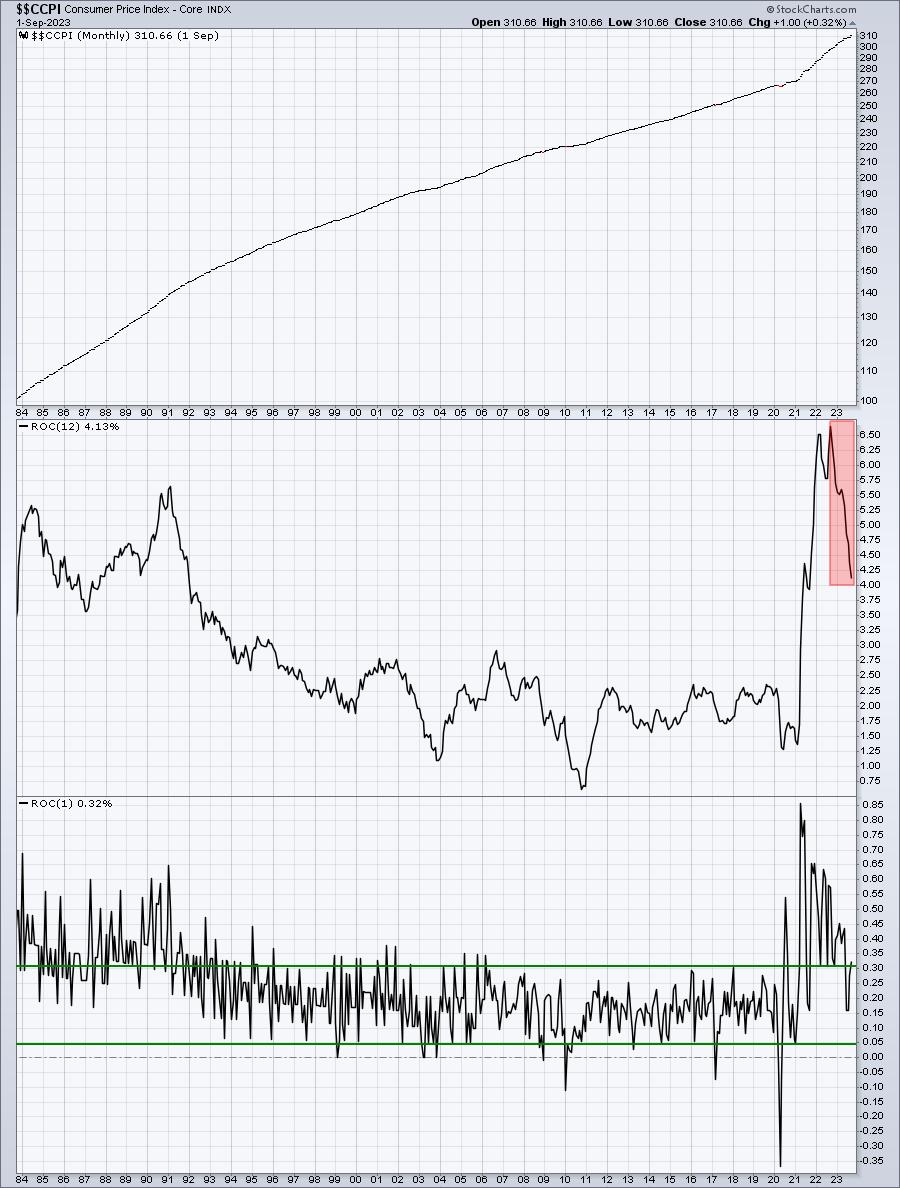
Couple points here. First, note that the annual rate of core CPI fell significantly once again, this time to 4.13%. Remember, a year ago, this annual rate was close to 6.70%. I'd say we've seen a steady decline towards the Fed's target rate of 2.00%, which is what the Fed has said in the past they wanted to see. The monthly change in the Core CPI did rise to +0.32% in September, which is slightly above the "normal range" of +0.05% to +0.30% that we've seen throughout much of the 21st century.
Sector/Industry Focus
One problem that we might be seeing today is the negative divergence that has printed on both the S&P 500 and NASDAQ 100. Check out these two charts:
S&P 500:
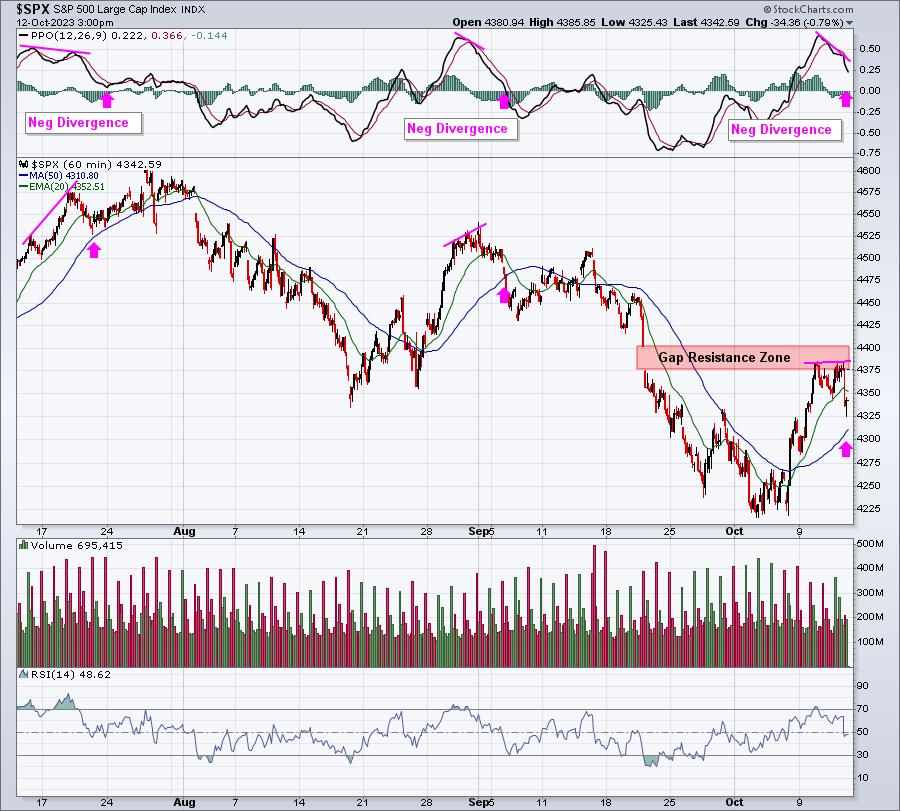
Any time we see a big selloff, we have to clear overhead resistance in various stages. Currently, the S&P 500 must negotiate key gap resistance (red-shaded area), while also dealing with a negative divergence on this hourly chart. Short-term weakness is not all that unusual after these divergences print. The question will be.....which way does the S&P 500 move AFTER this momentum issue has been resolved (pink arrows mark 50-day SMA and/or PPO centerline tests).
NASDAQ 100:
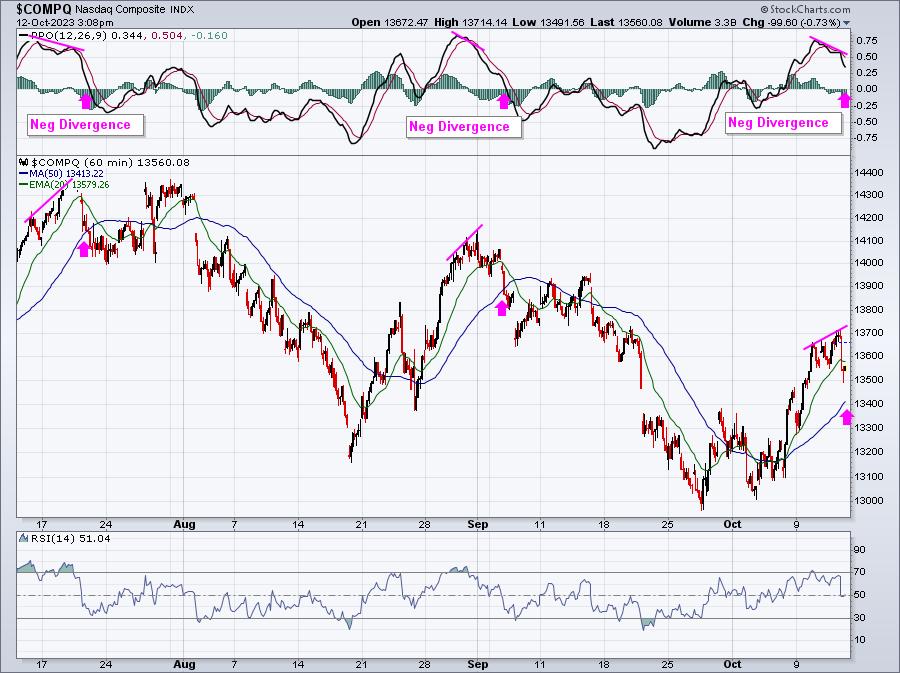
The NDX is in a very similar position, with one exception. That gap resistance was cleared earlier this week. Therefore, we should treat the NDX as the best-performing index currently.
One last thing for today. Let's check out those key intermarket relationships to see how they're holding up:
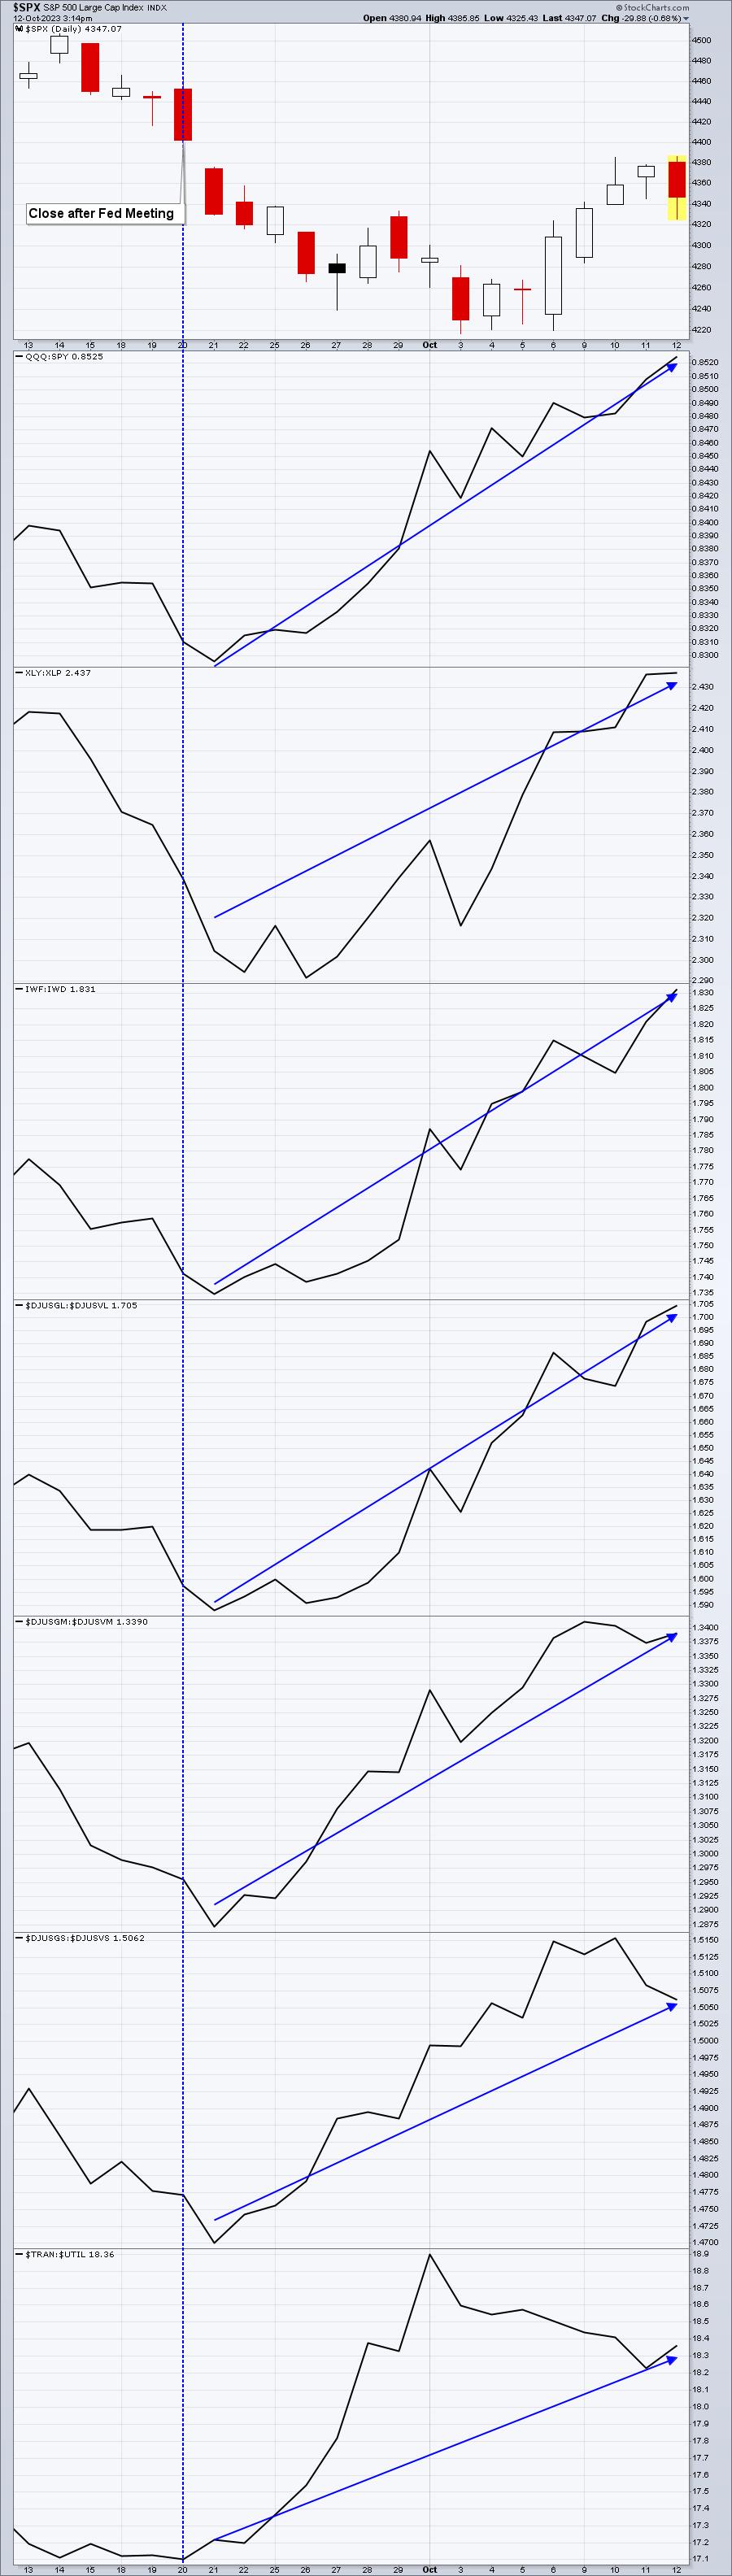
Money is POURING into growth vs. value. Still. I don't make this stuff up, I just share what I see. I'm not expecting this market downturn to last very long.
ChartLists/Strategies
I ran a scan of stocks on our Strong Earnings ChartList (SECL) that are in a rising trend and tested 20-day EMAs earlier today, but are currently trading above that key moving average. Here are the 13 stocks that were returned:
TTI, CRS, RELY, DKNG, BRZE, GIII, TSLA, ALSN, INFA, KKR, OBDC, TXT, CB
I like 2 of these:
BRZE:
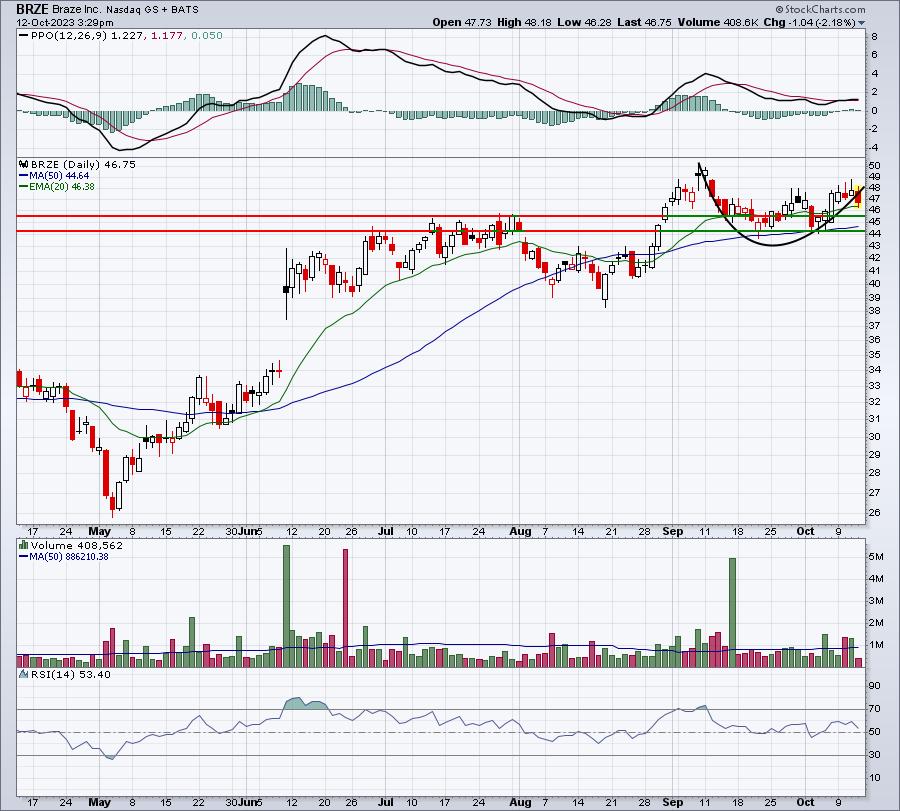
After its recent uptrend, we could be watching a cup form on BRZE. BRZE already reported its quarterly results last month and won't report again until December. Meanwhile, this one's been one of the best software stocks and currently has a SCTR score of 96. The rising 20-day EMA could be used as a CLOSING stop, or if you want to consider giving it more room to the downside, price support resides in the 44.25-45.50 area.
TSLA:
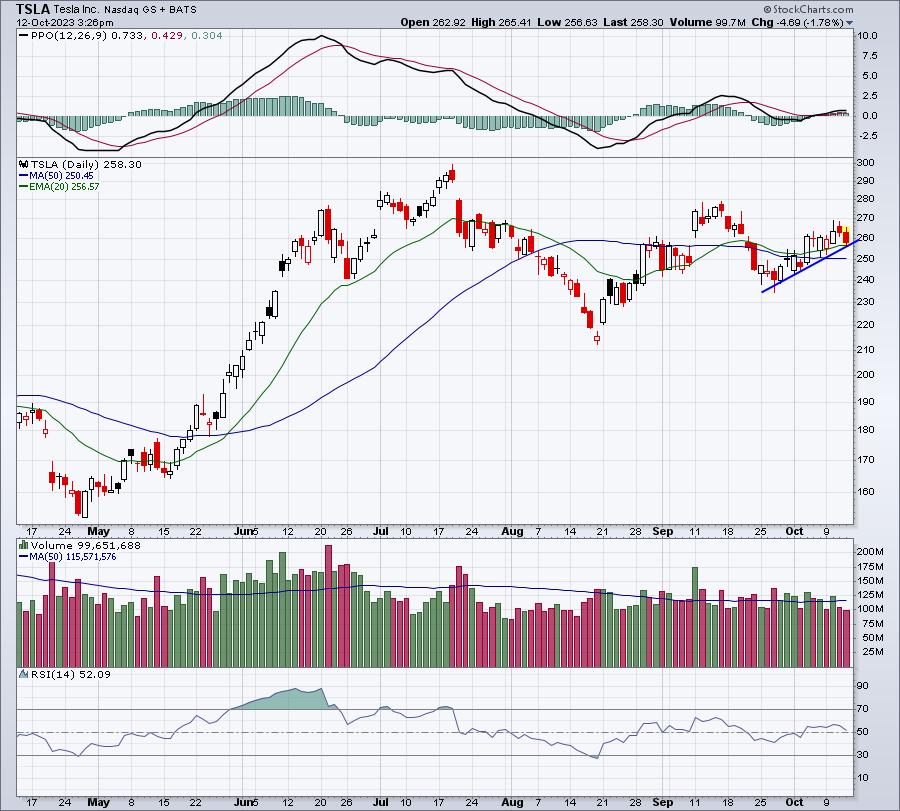
TSLA is trending nicely higher and it's quite typical for TSLA to move higher into its earnings report, which will be released next Wednesday after the market closes. Also, you can keep a tight CLOSING stop at that 20-day EMA, if you want to protect against significant downside.
Earnings Reports
Here are the key earnings reports for the next two days, featuring stocks with market caps of more than $10 billion. I also include notable companies with market caps below $10 billion. Finally, any portfolio stocks that will be reporting results are highlighted in BOLD. If you decide to hold a stock into earnings, please understand the significant short-term risk that you are taking. Please be sure to check for earnings dates for any companies that you own or are considering owning.
Thursday, October 12:
INFY, FAST, DAL, WBA, DPZ, CMC, SGH
Friday, October 13:
UNH, JPM, WFC, BLK, PGR, C, PNC
Economic Reports
September CPI: +0.4% (actual) vs. +0.3% (estimate)
September Core CPI: +0.3% (actual) vs. +0.3% (estimate)
Initial jobless claims: 209,000 (actual) vs. 209,000 (estimate)
Happy trading!
Tom