
EB Weekly Market Report - Monday, October 16, 2023
Weekly Market Recap
Major Indices
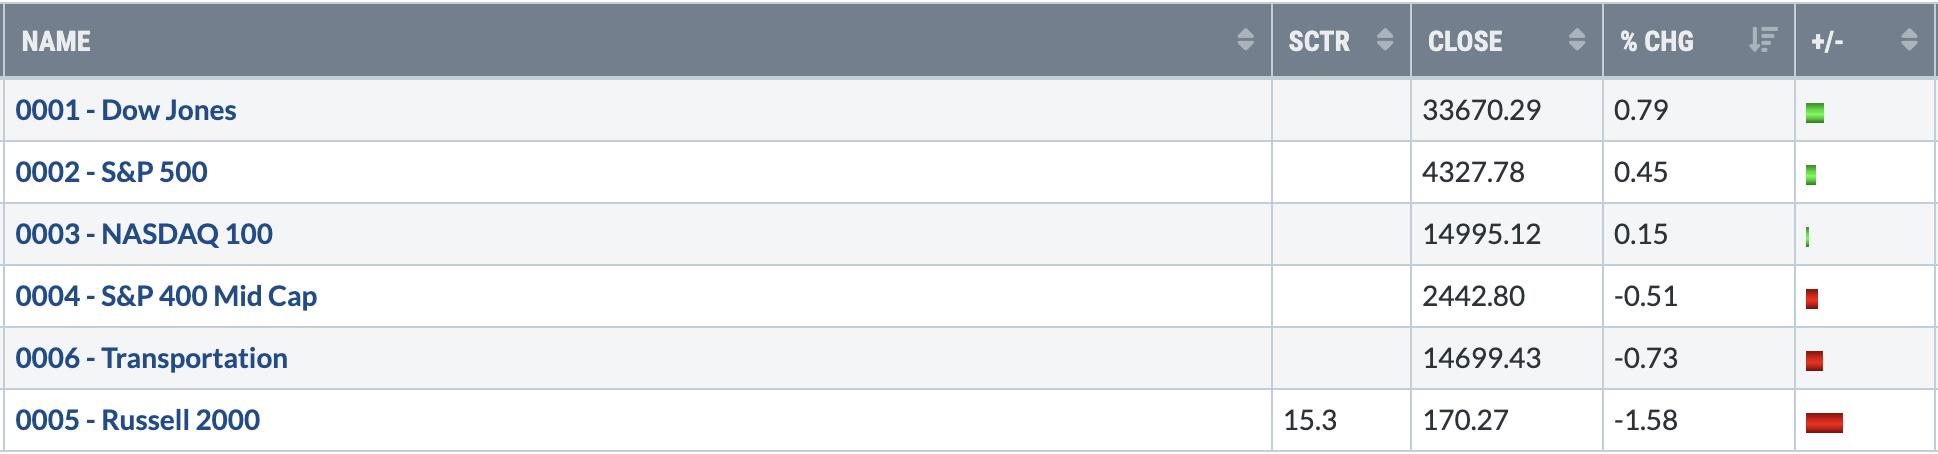
The Dow Jones showed leadership last week, as two of its health care component stocks had superb weeks. Amgen (AMGN, +6.22%) and Unitedhealth Group (UNH, +2.78%) both helped to lift the Dow Jones on a relative basis. Earnings season kicked off and played a role as well as JP Morgan (JPM, +2.00%) beat Wall Street consensus estimates as to both revenues and earnings. The UNH gain also resulted from quarterly performance that exceeded expectations. The Dow Jones has work to do, but here's how it ended last week:
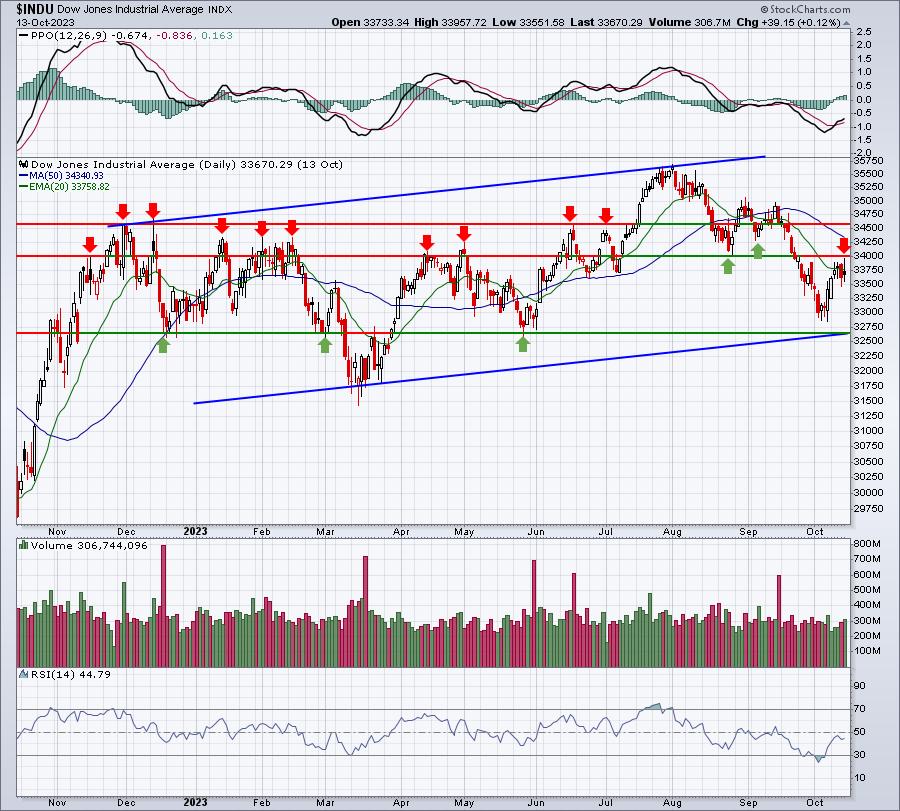
There seems to be a lot going on on this Dow Jones chart, but I'm actually just pointing out key price support and resistance to focus on. 34000-34600 is absolutely a big resistance level right now, because of the sheer number of times it's been tested. To the downside, we've seen 32600-32700 hold as support on 3 separate occasions and that level also coincides with a potential channel (blue parallel lines) based off of the upper trendline.
Many Dow Jones component stocks will be reporting earnings over the next 1-2 weeks, so we'll likely find out which way prices will gravitate.
Sectors
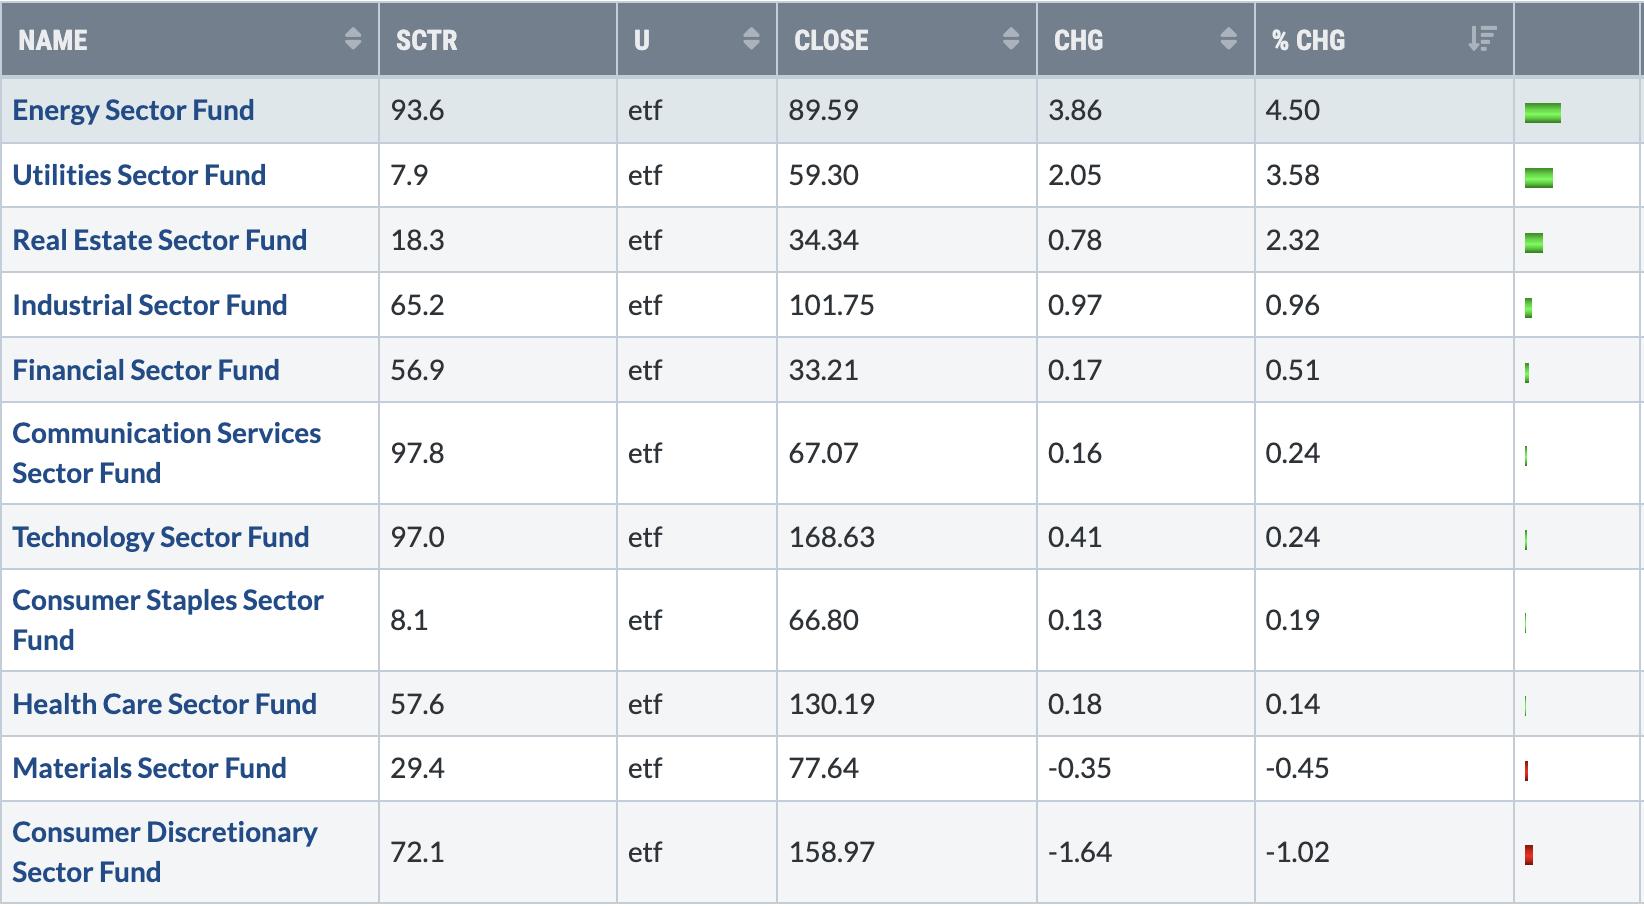
It was actually a very quiet week for most areas of the market that carry the most weight in the S&P 500. Yes, consumer discretionary (XLY) took a hit and was the clear laggard, but otherwise, technology (XLK), communication services (XLC), and health care (XLV) moved mostly in lock step with the S&P 500. These 3 sectors represent 50% of the weighting of the S&P 500. Energy (XLE) was very strong, but it's obviously tied to the price of crude oil ($WTIC), which has been extremely volatile the past 2-3 weeks. Predict the direction of crude oil correctly and the XLE becomes very easy to trade. That's easier said than done.
Top 10 Industries Last Week
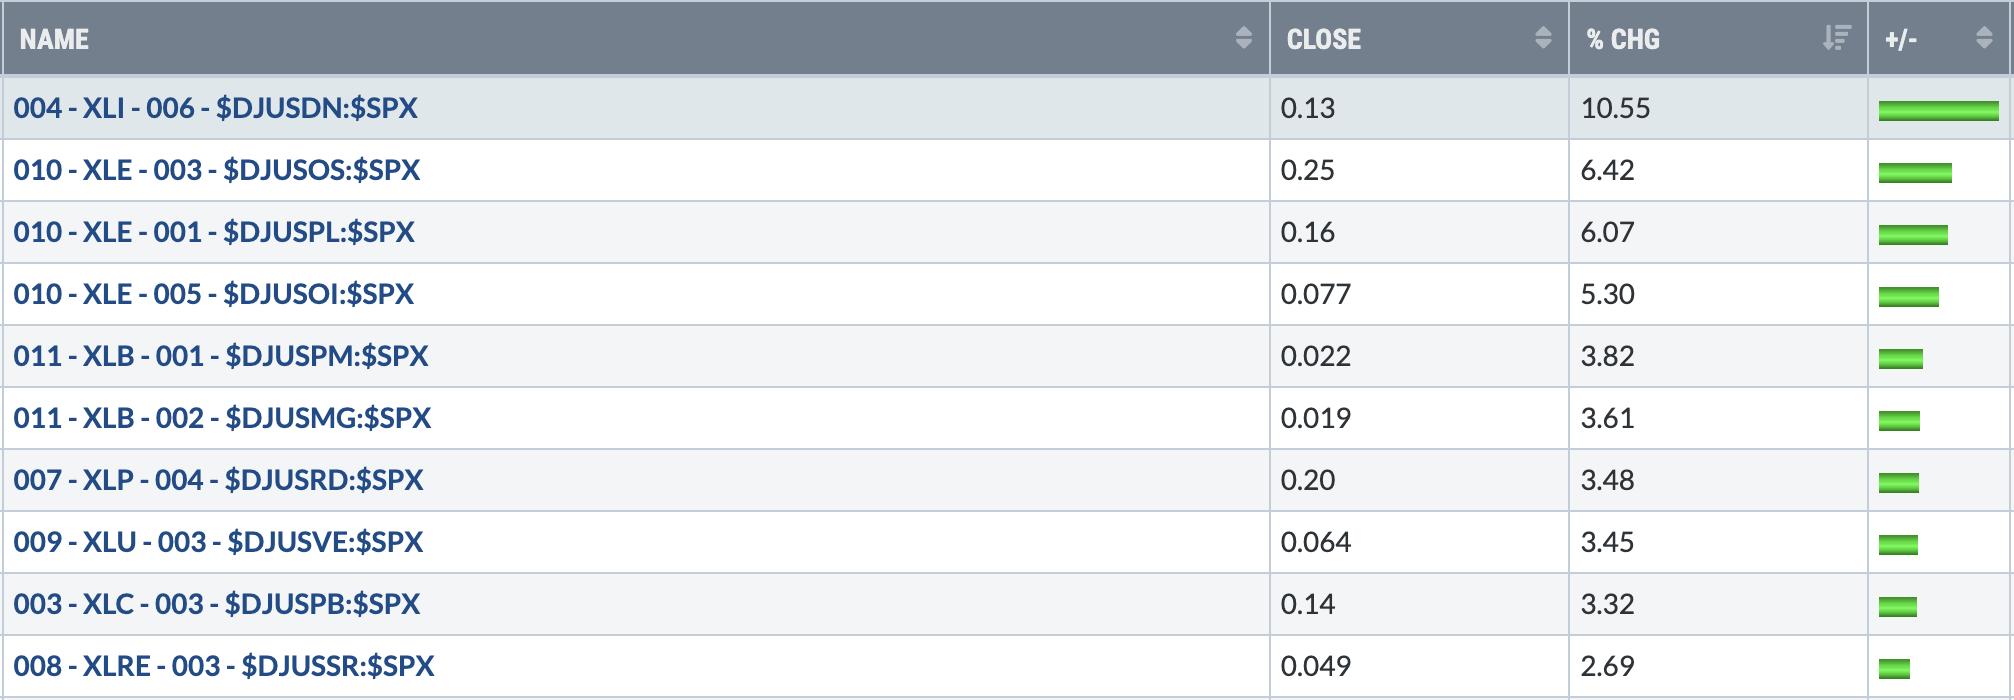
Defense stocks ($DJUSDN) woke up following the Hamas attack on Israel one week ago. That has completely altered the trend and direction of this industry group:
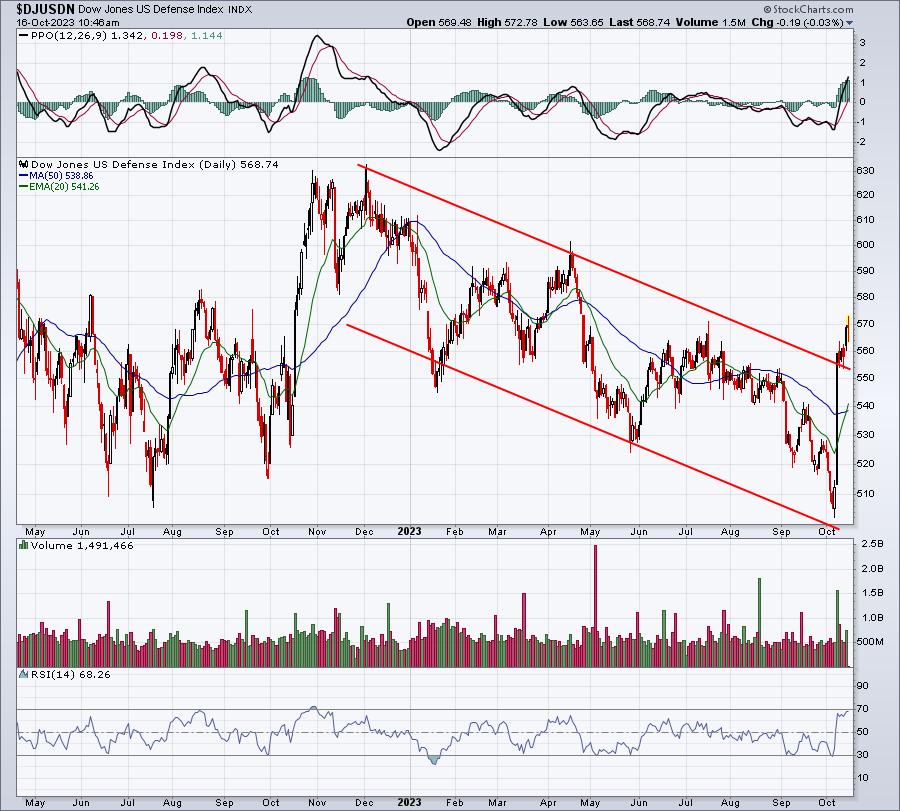
The attack was an obvious reason for the group having such a strong week, but likely not the only reason. The following seasonality chart highlights the October-November strength that defense stocks usually enjoy:
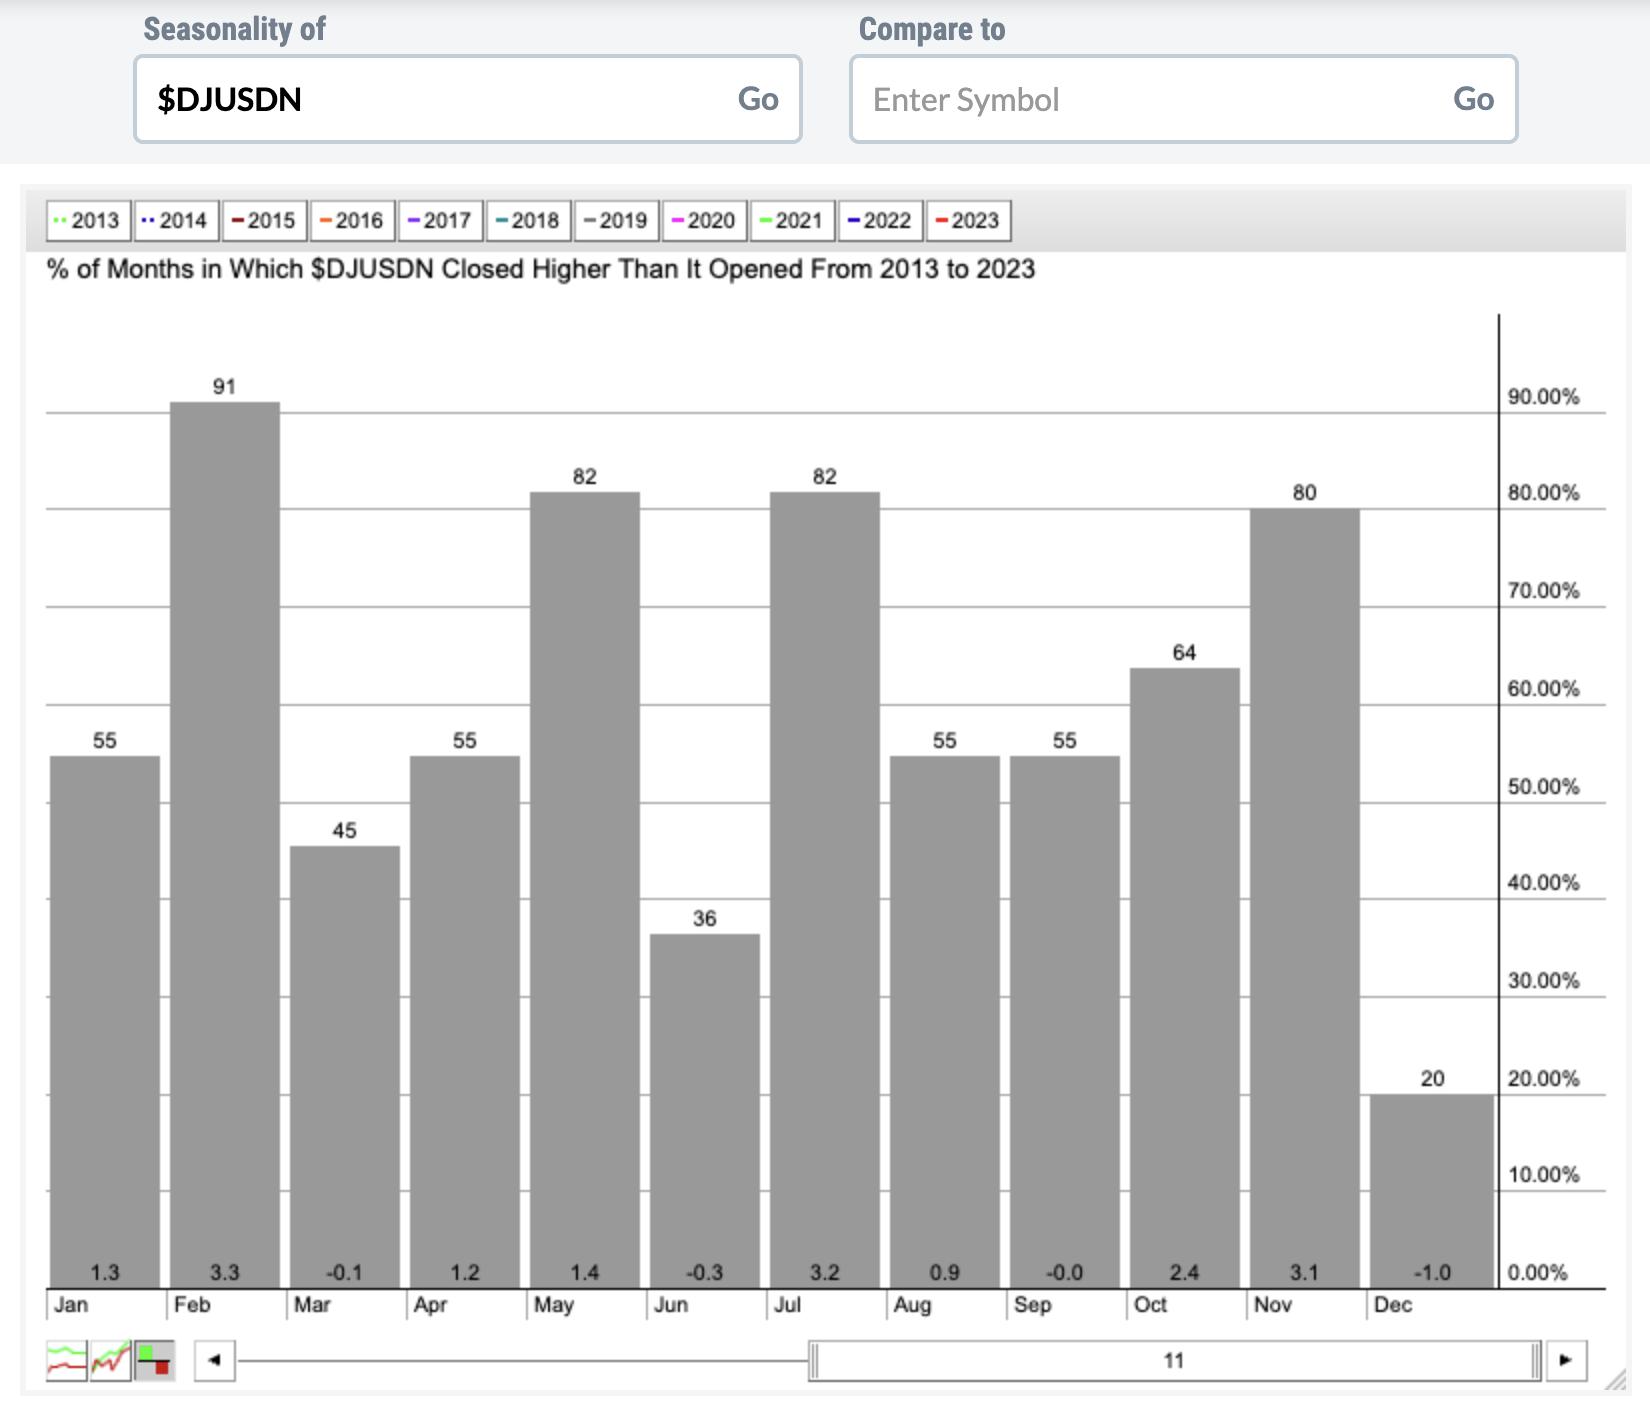
The average return for October-November during the current secular bull market advance has been 5.5%, which is higher than any other two consecutive calendar month period. I would have expected strength returning soon, but the unexpected Middle East attack sped up the process.
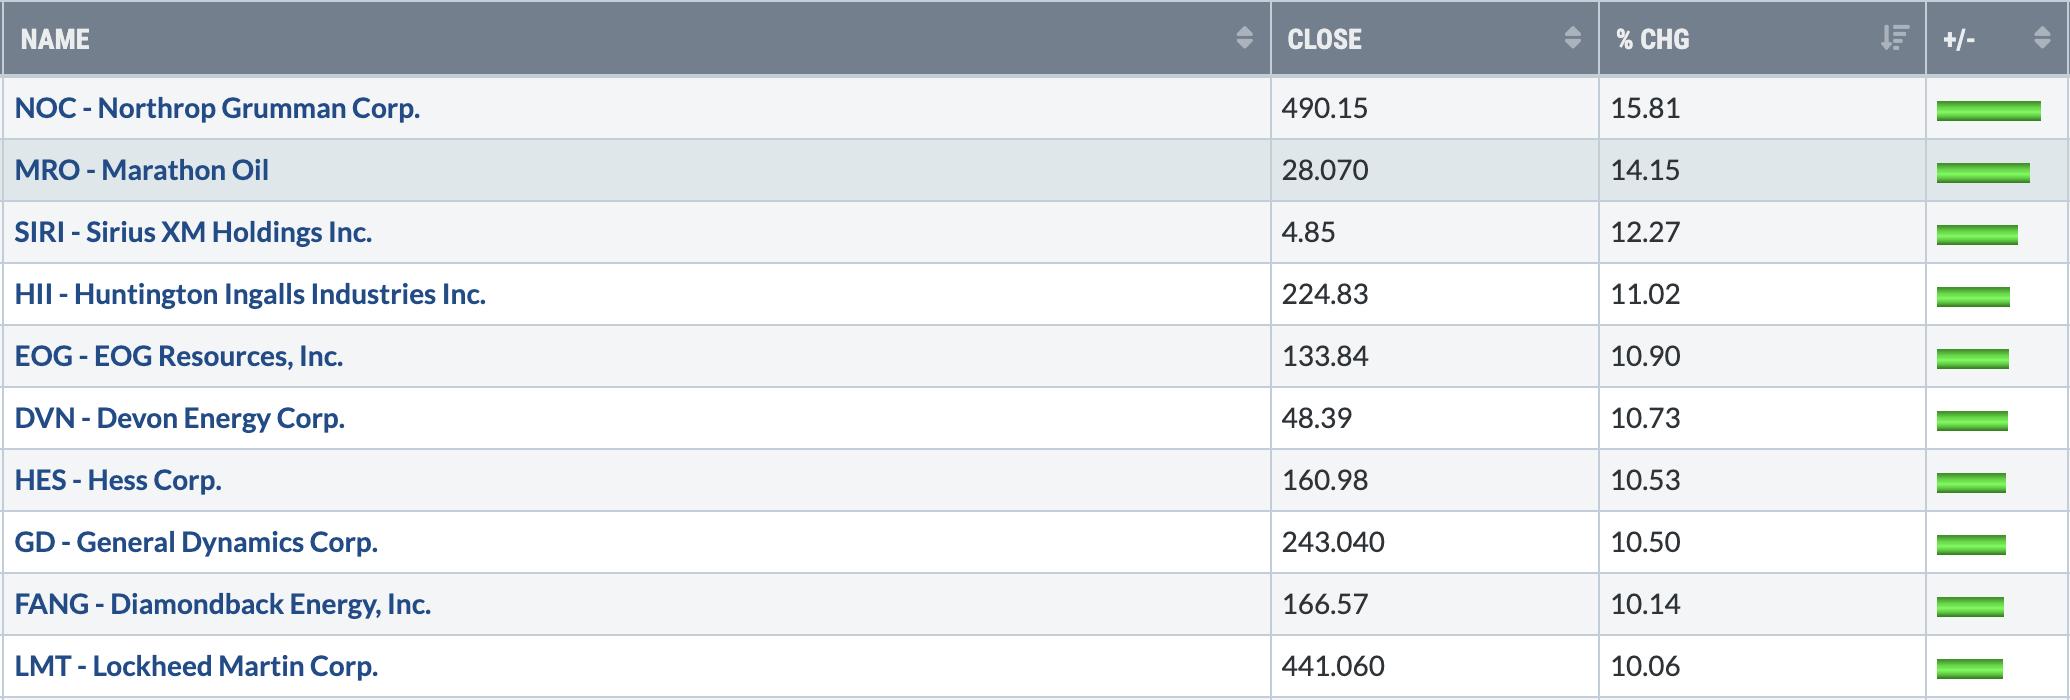
By the way, when you check out the top-performing individual stocks from last week (below), you'll see this group heavily represented.
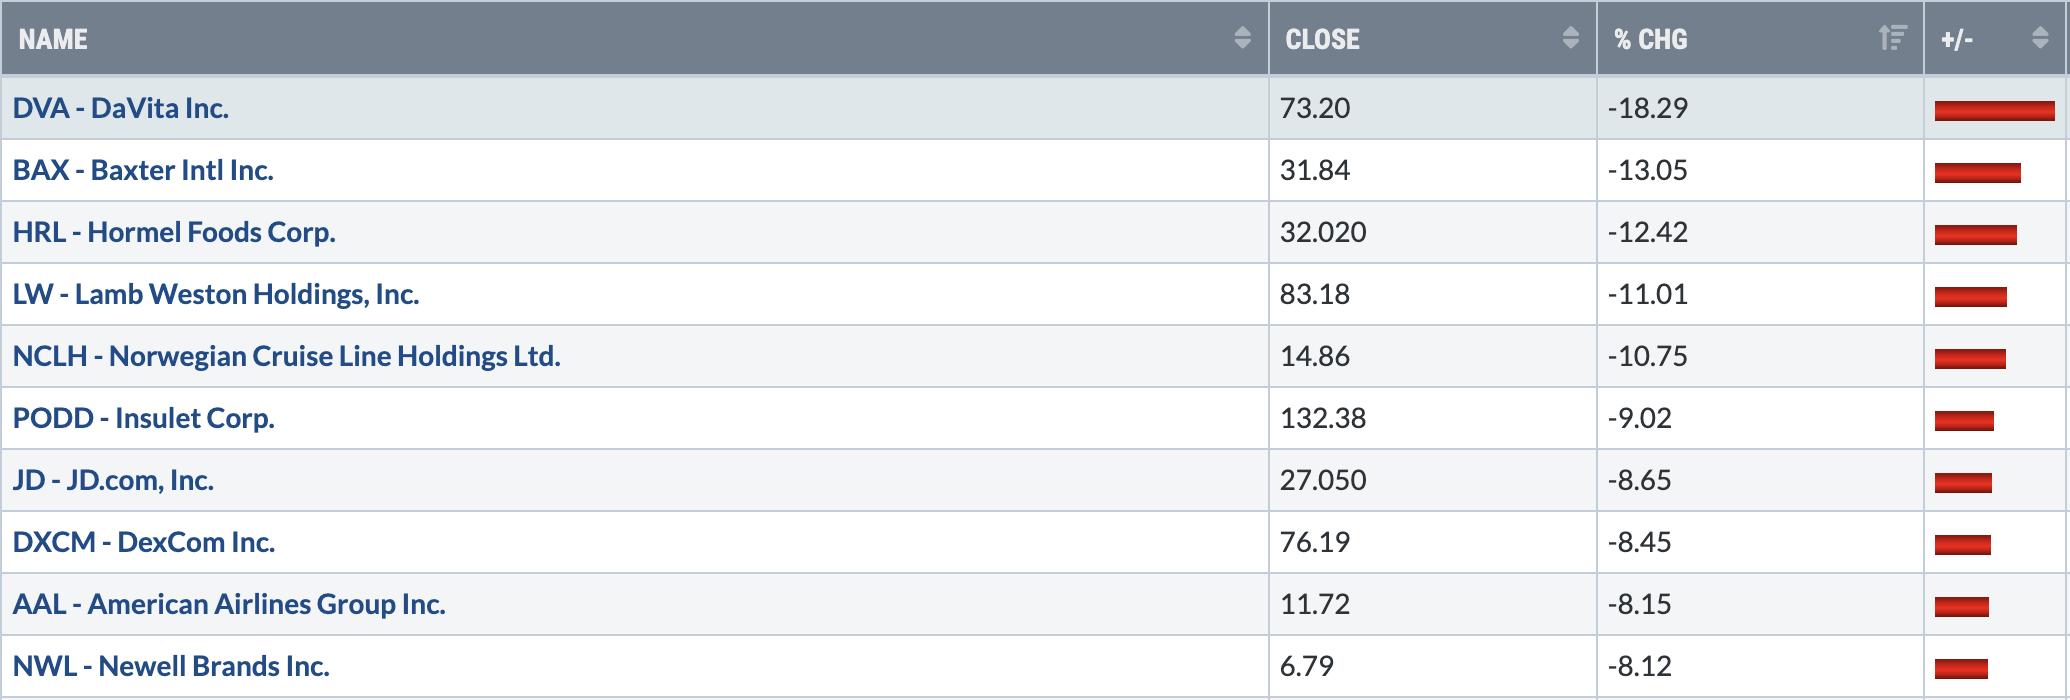
Bottom 10 Industries Last Week
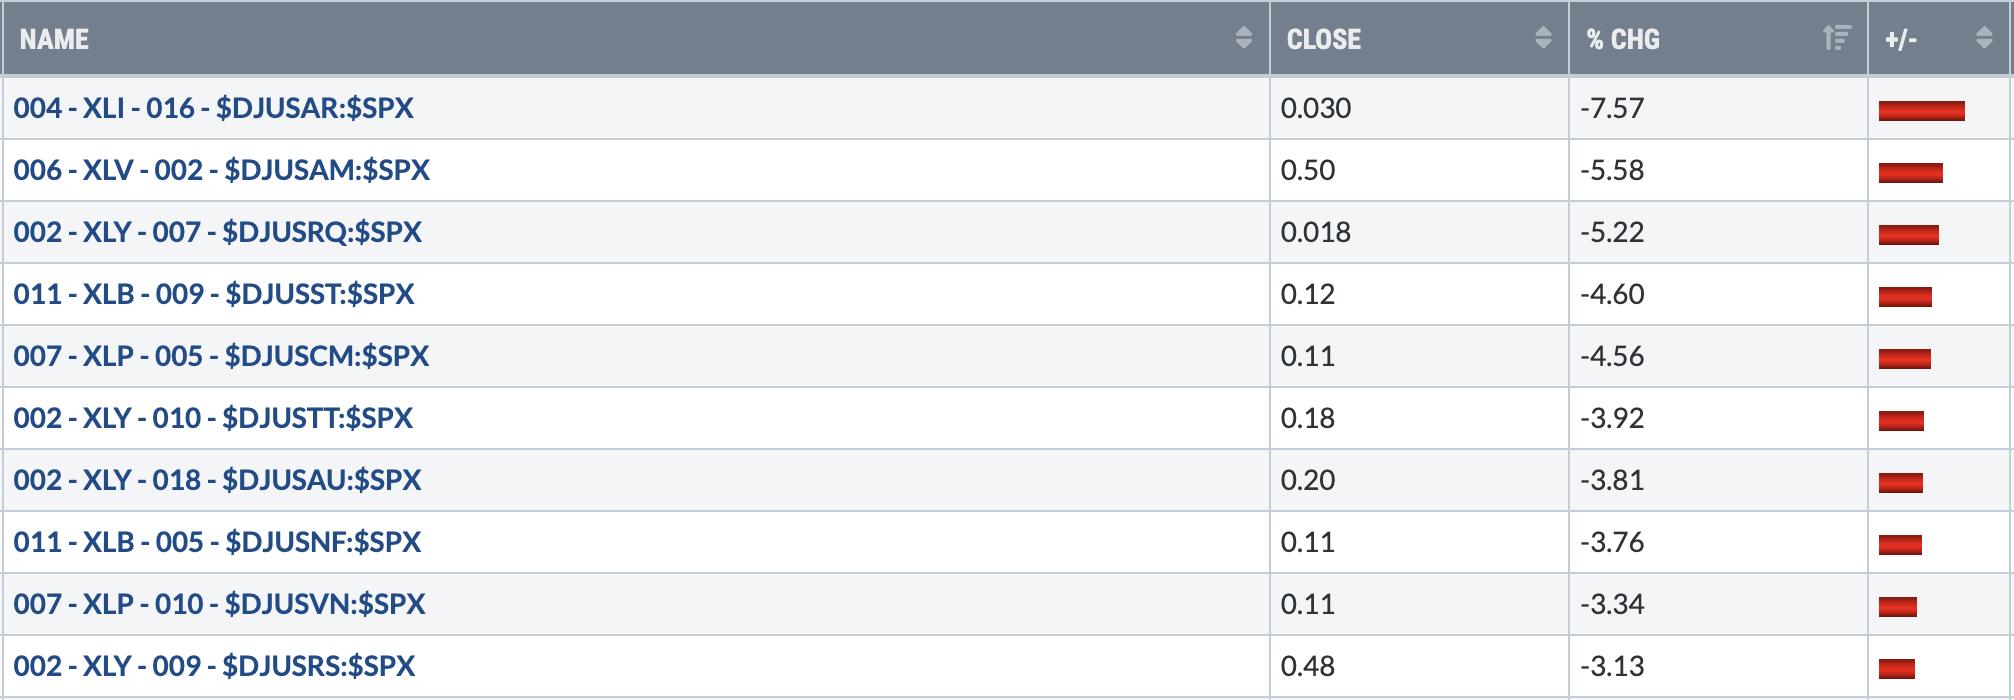
Of these groups, many have been in downtrends for awhile, but one stands out to me as a potential rebound candidate - and probably sooner rather than later. Specialty retailers ($DJUSRS) failed at its latest 20-day EMA test and returned to fresh lows. But with this latest low, a positive divergence has formed on the daily chart. Also, very important price support has been tested. Check this out:
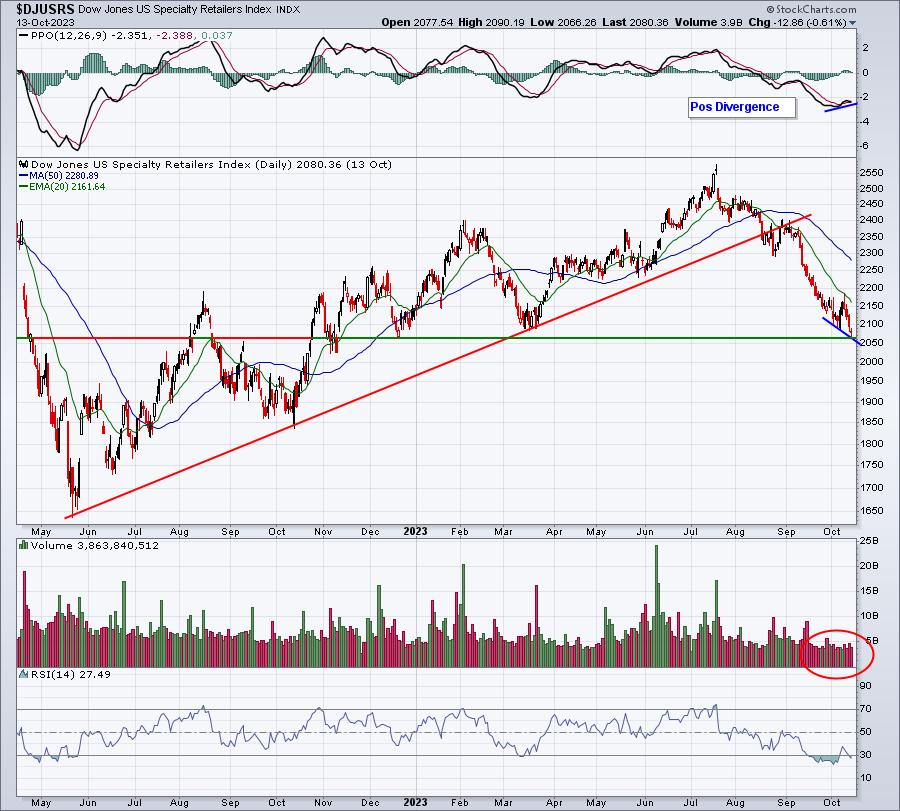
Volume has been suspiciously light, considering the magnitude of price loss over the past month. I'm not saying that this is the best group to invest in right now, but what I am saying is that the reward to risk looks quite appealing. Looking at individual specialty retail stocks would not be a bad idea. Stick with those showing relative strength vs. their specialty retail peers. Think high SCTRs (StockCharts Technical Rank = SCTR) and/or rising relative price action.
Top 10 Stocks - S&P 500/NASDAQ 100
Bottom 10 Stocks - S&P 500/NASDAQ 100
Major Indices
The NASDAQ 100 started last week in solid fashion, but clearly struggled once testing that overhead resistance level. The consolidation phase continues for now. A definitive breakout above this falling trendline would likely encourage more buyers in this area of the market:
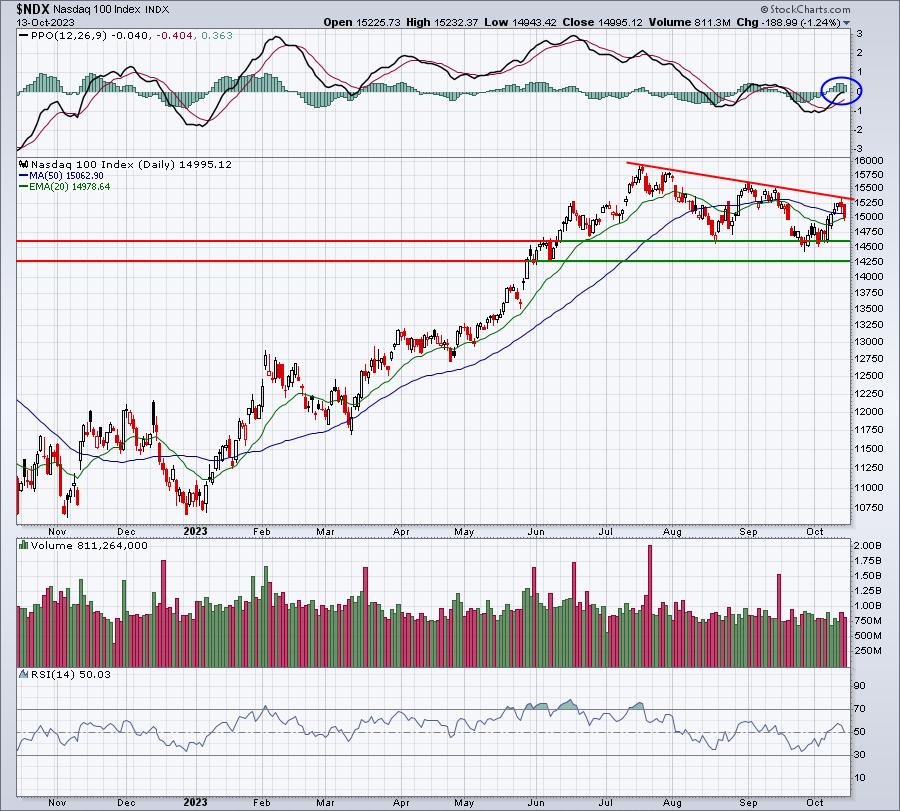
Note that the RSI has now failed twice at the 60 level. A move through 60 would be another bullish signal that the consolidation phase has ended and that aggressive growth is resuming its prior uptrend.
From a short-term perspective, we move to the 60-minute chart. Earlier this week, I pointed to a negative divergence that emerged at the early-Thursday high. On hourly charts, these divergences typically play out over 1-3 days. The ensuing weakness on Thursday afternoon and Friday culminated in exactly what I look for - a PPO centerline test and a 50-hour SMA test (pink arrows):
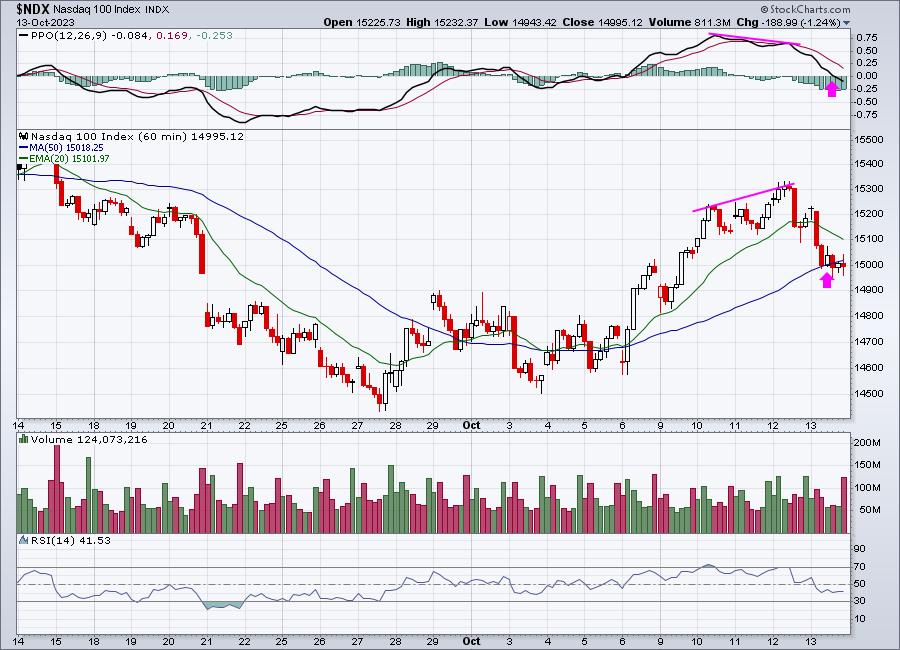
The short-term momentum issue is no longer a factor.
Intermarket Relationships
I've been watching these relationships on a weekly basis, so at least for now, it probably makes sense to continue monitoring it weekly right here in the Weekly Market Report. Here's the latest:
Consumer discretionary vs. Consumer staples (XLY:XLP):
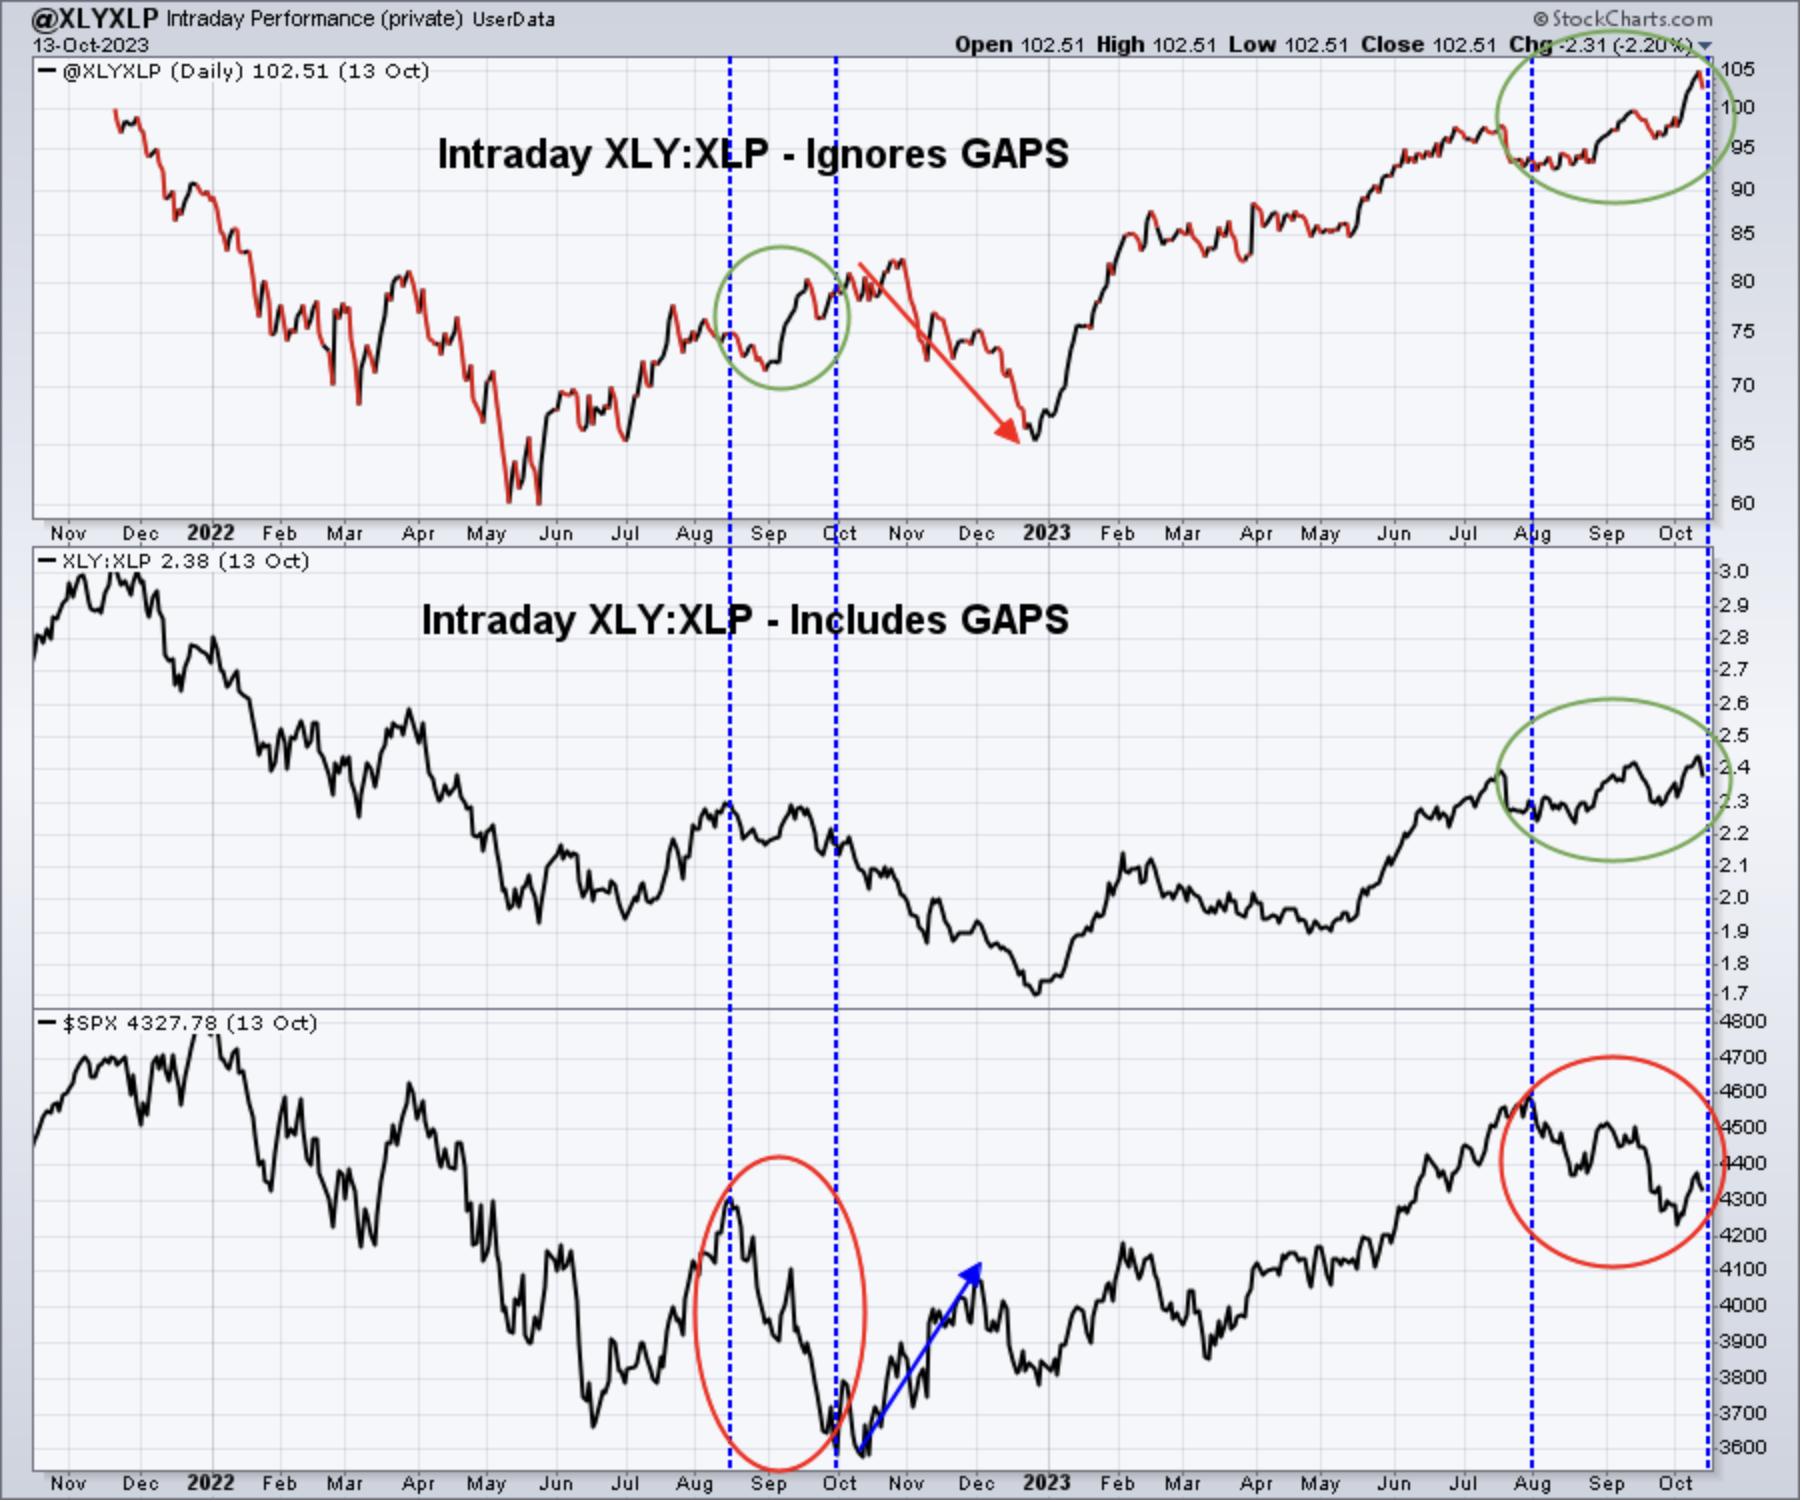
Friday saw a turn lower in this relationship, but I don't make calls based on one day. The overall direction of this XLY:XLP intraday ratio remains higher for sure. Based on my research, there's been no intermarket relationship that shows stronger positive correlation with the S&P 500 than the XLY:XLP. The intraday relationship simply adds to the importance of this ratio. Remember, two-thirds of our GDP is consumer spending, so regularly examining this relationship just makes good common sense.
NASDAQ 100 vs. S&P 500 (QQQ:SPY)
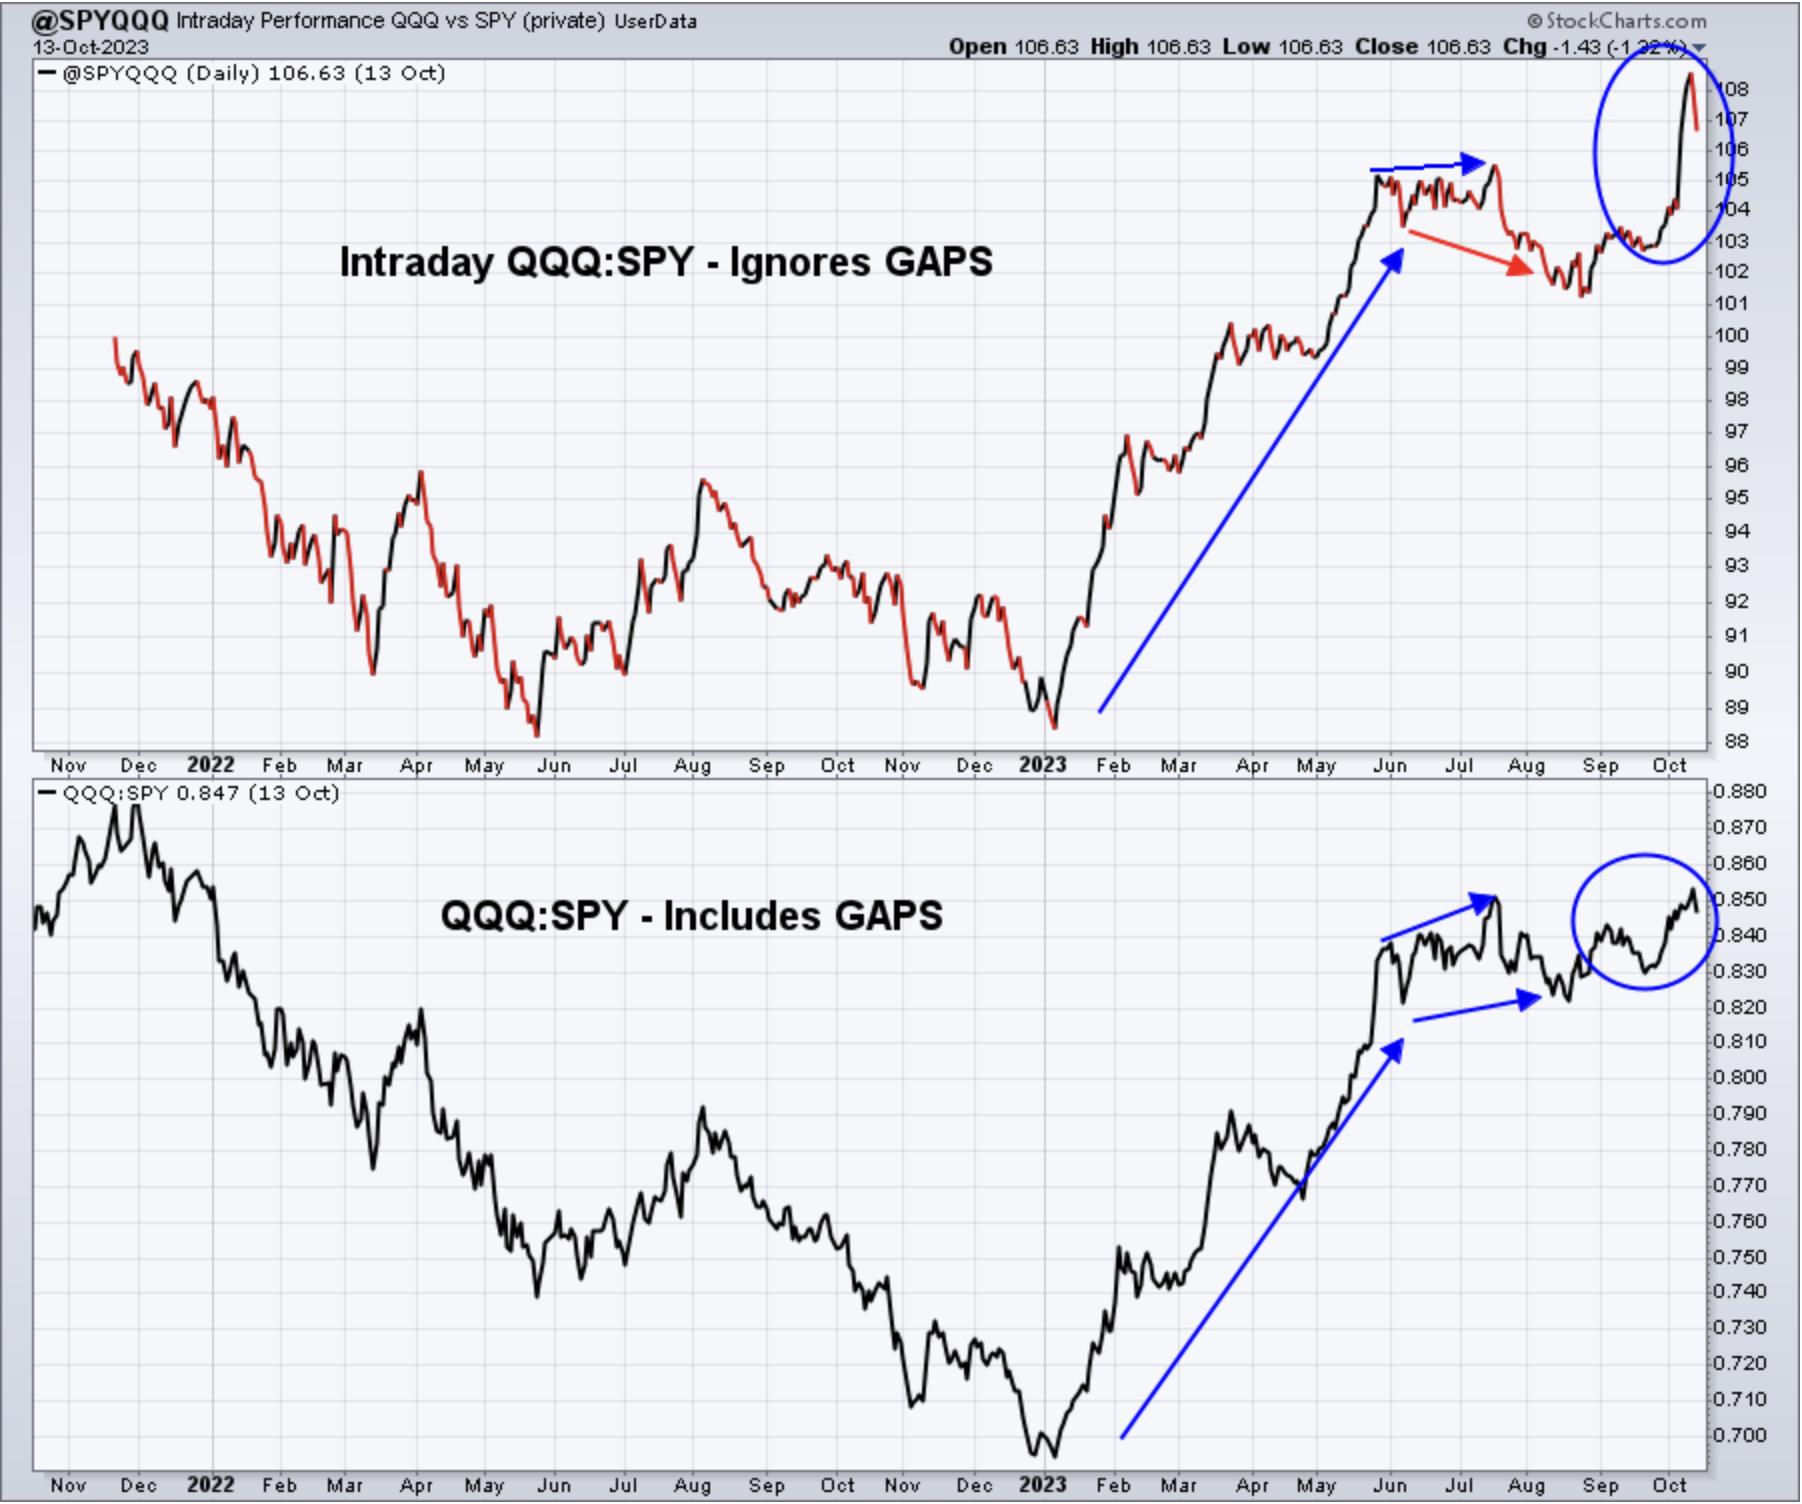
Like the XLY:XLP ratio, this QQQ:SPY ratio also weakened on Friday, but the most recent breakout was very encouraging.
Russell 2000 (IWM) vs. NASDAQ 100 (QQQ):
This isn't a ratio that I'm following nearly as closely. For a period over the summer, I believed we were seeing rotation that would lead to significant outperformance by small caps (IWM). That picture has completely changed as the IWM:QQQ ratio shows below:
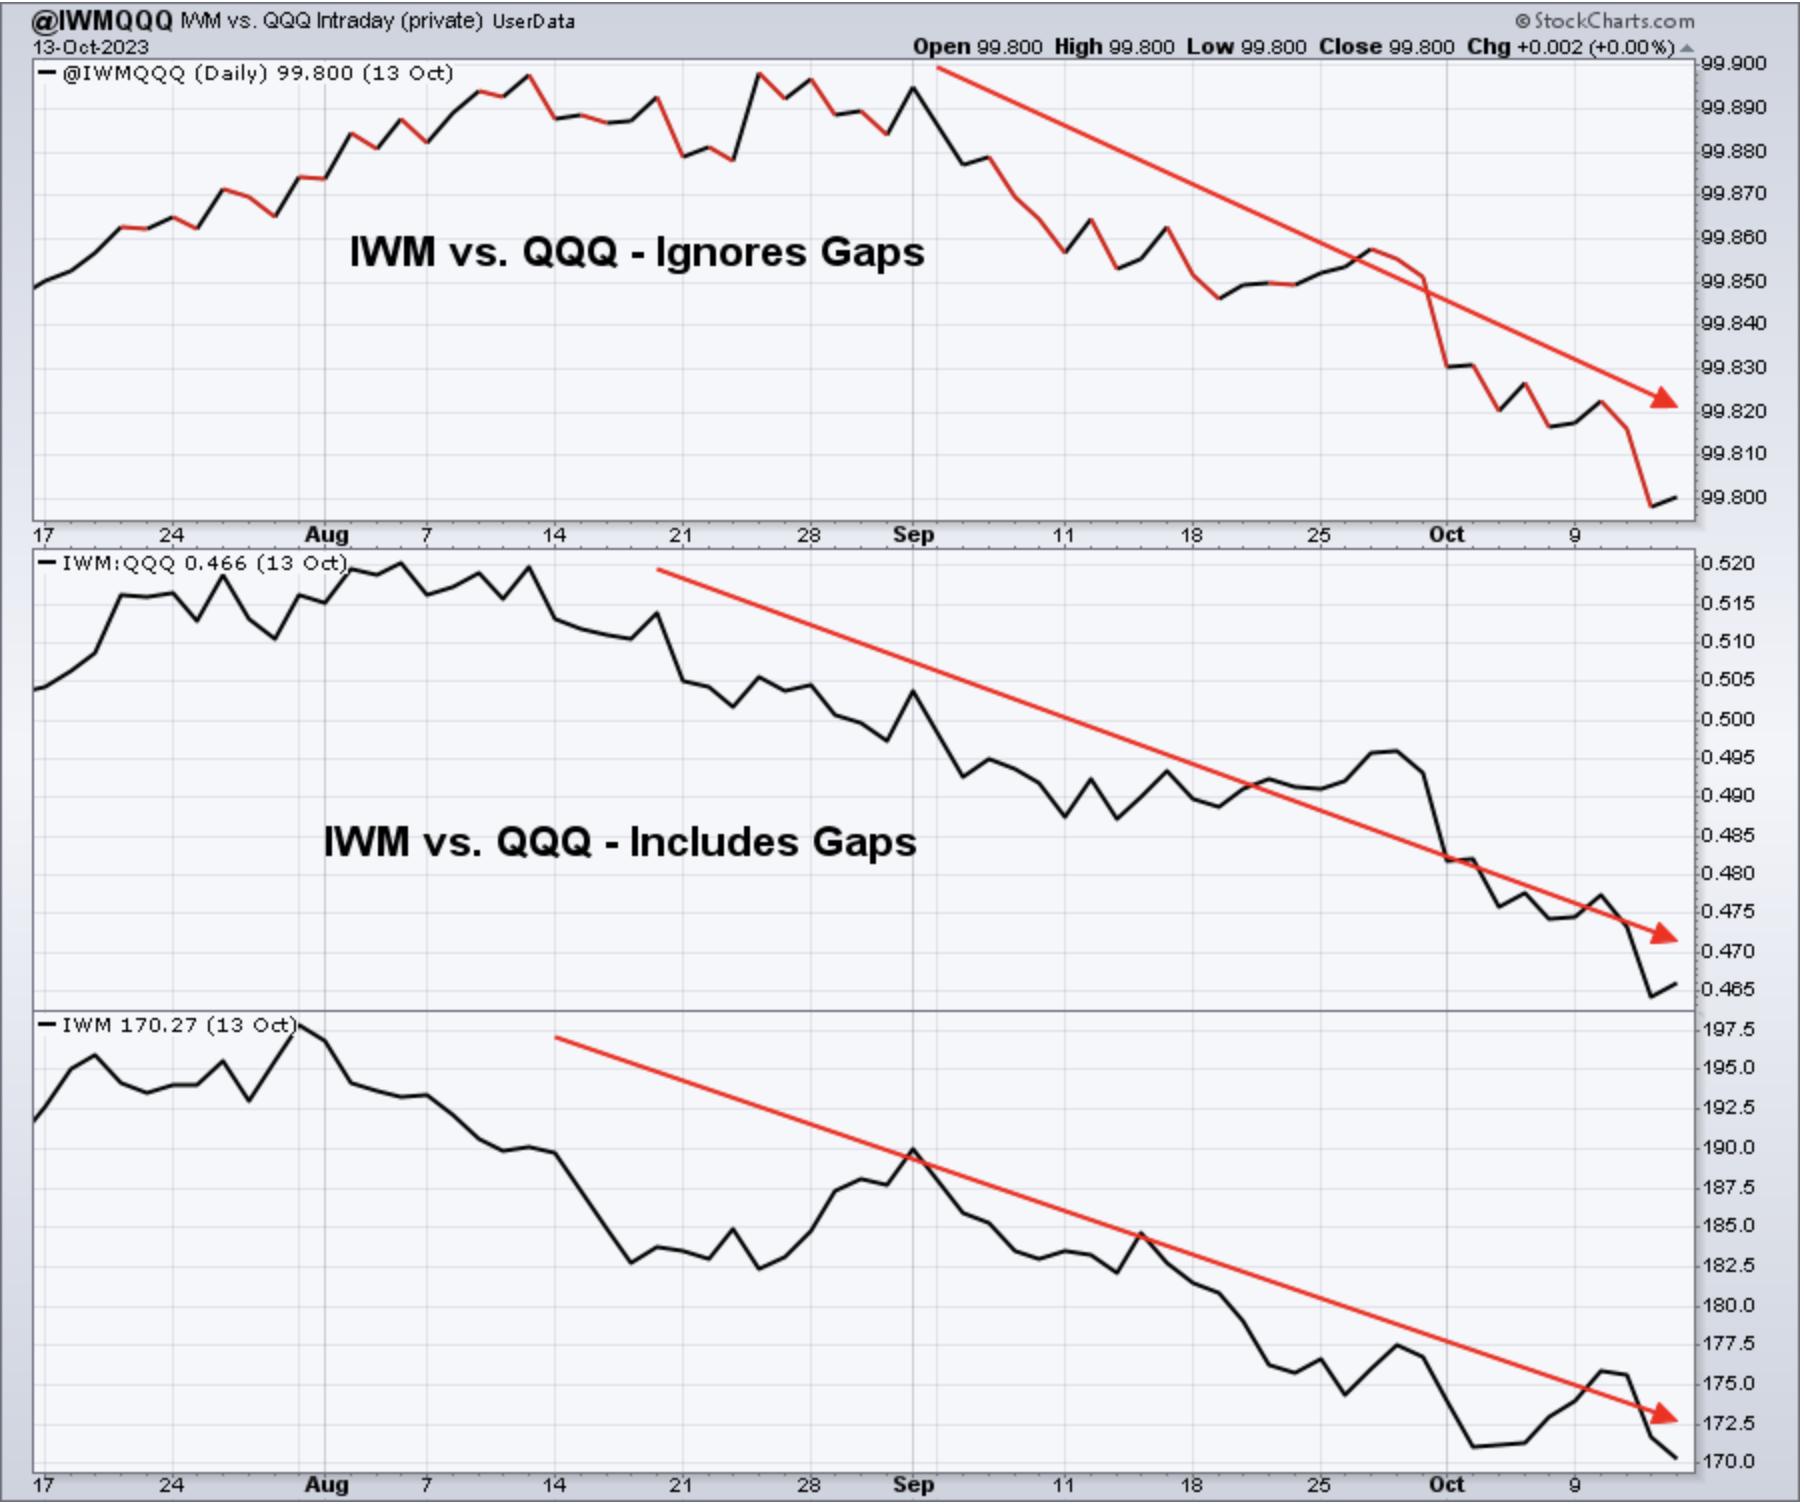
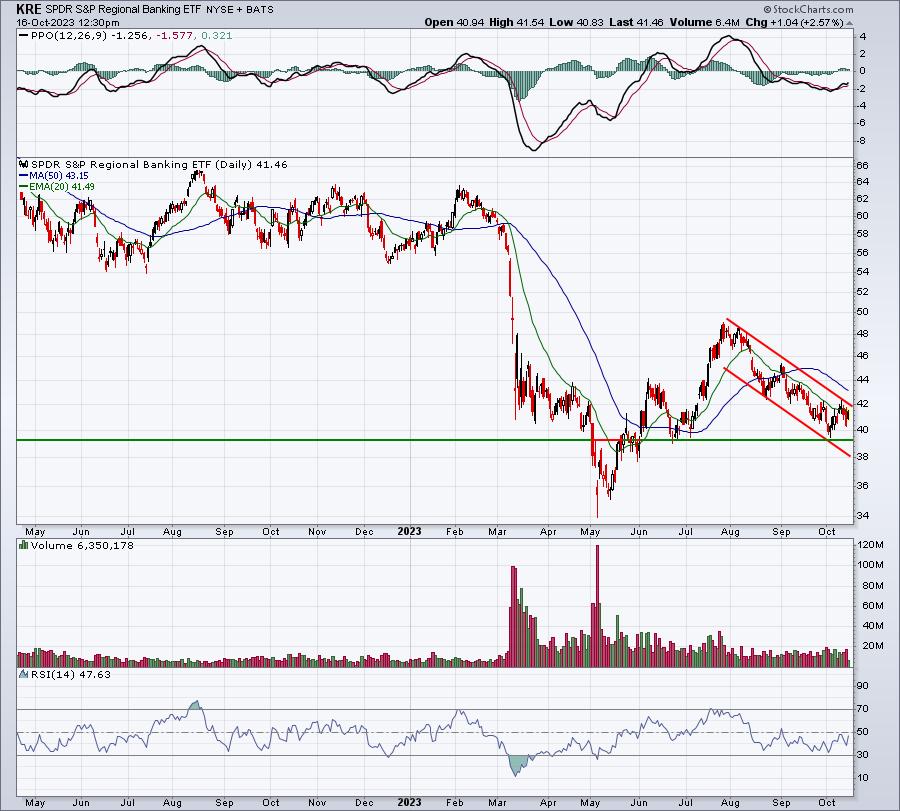
The August-September period, while overall weak, was particularly brutal for small caps. One of the biggest reasons is that regional banks (KRE) and smaller biotechs (XBI) have been bludgeoned:
KRE:
XBI:
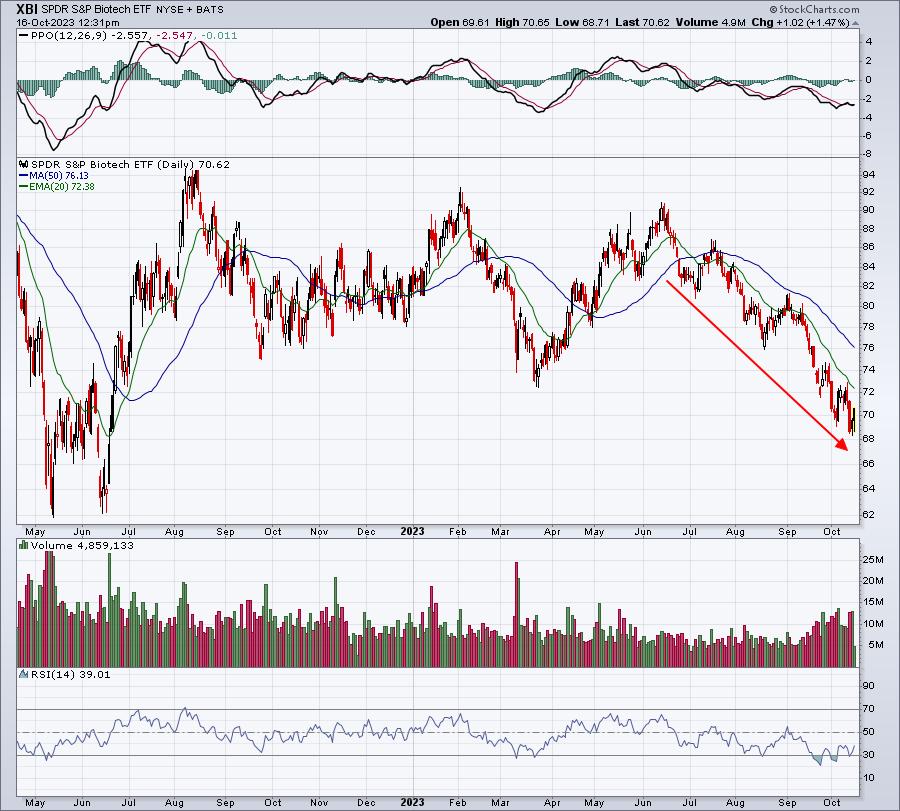
These are the two largest component industry groups of the IWM. It's difficult for the IWM to outperform, or even perform well, when these two groups are struggling. So if you're a fan of the IWM, you really need to watch these two charts very closely. They've been moving straight down for the past 2-4 months, taking the IWM down with them.
Sentiment
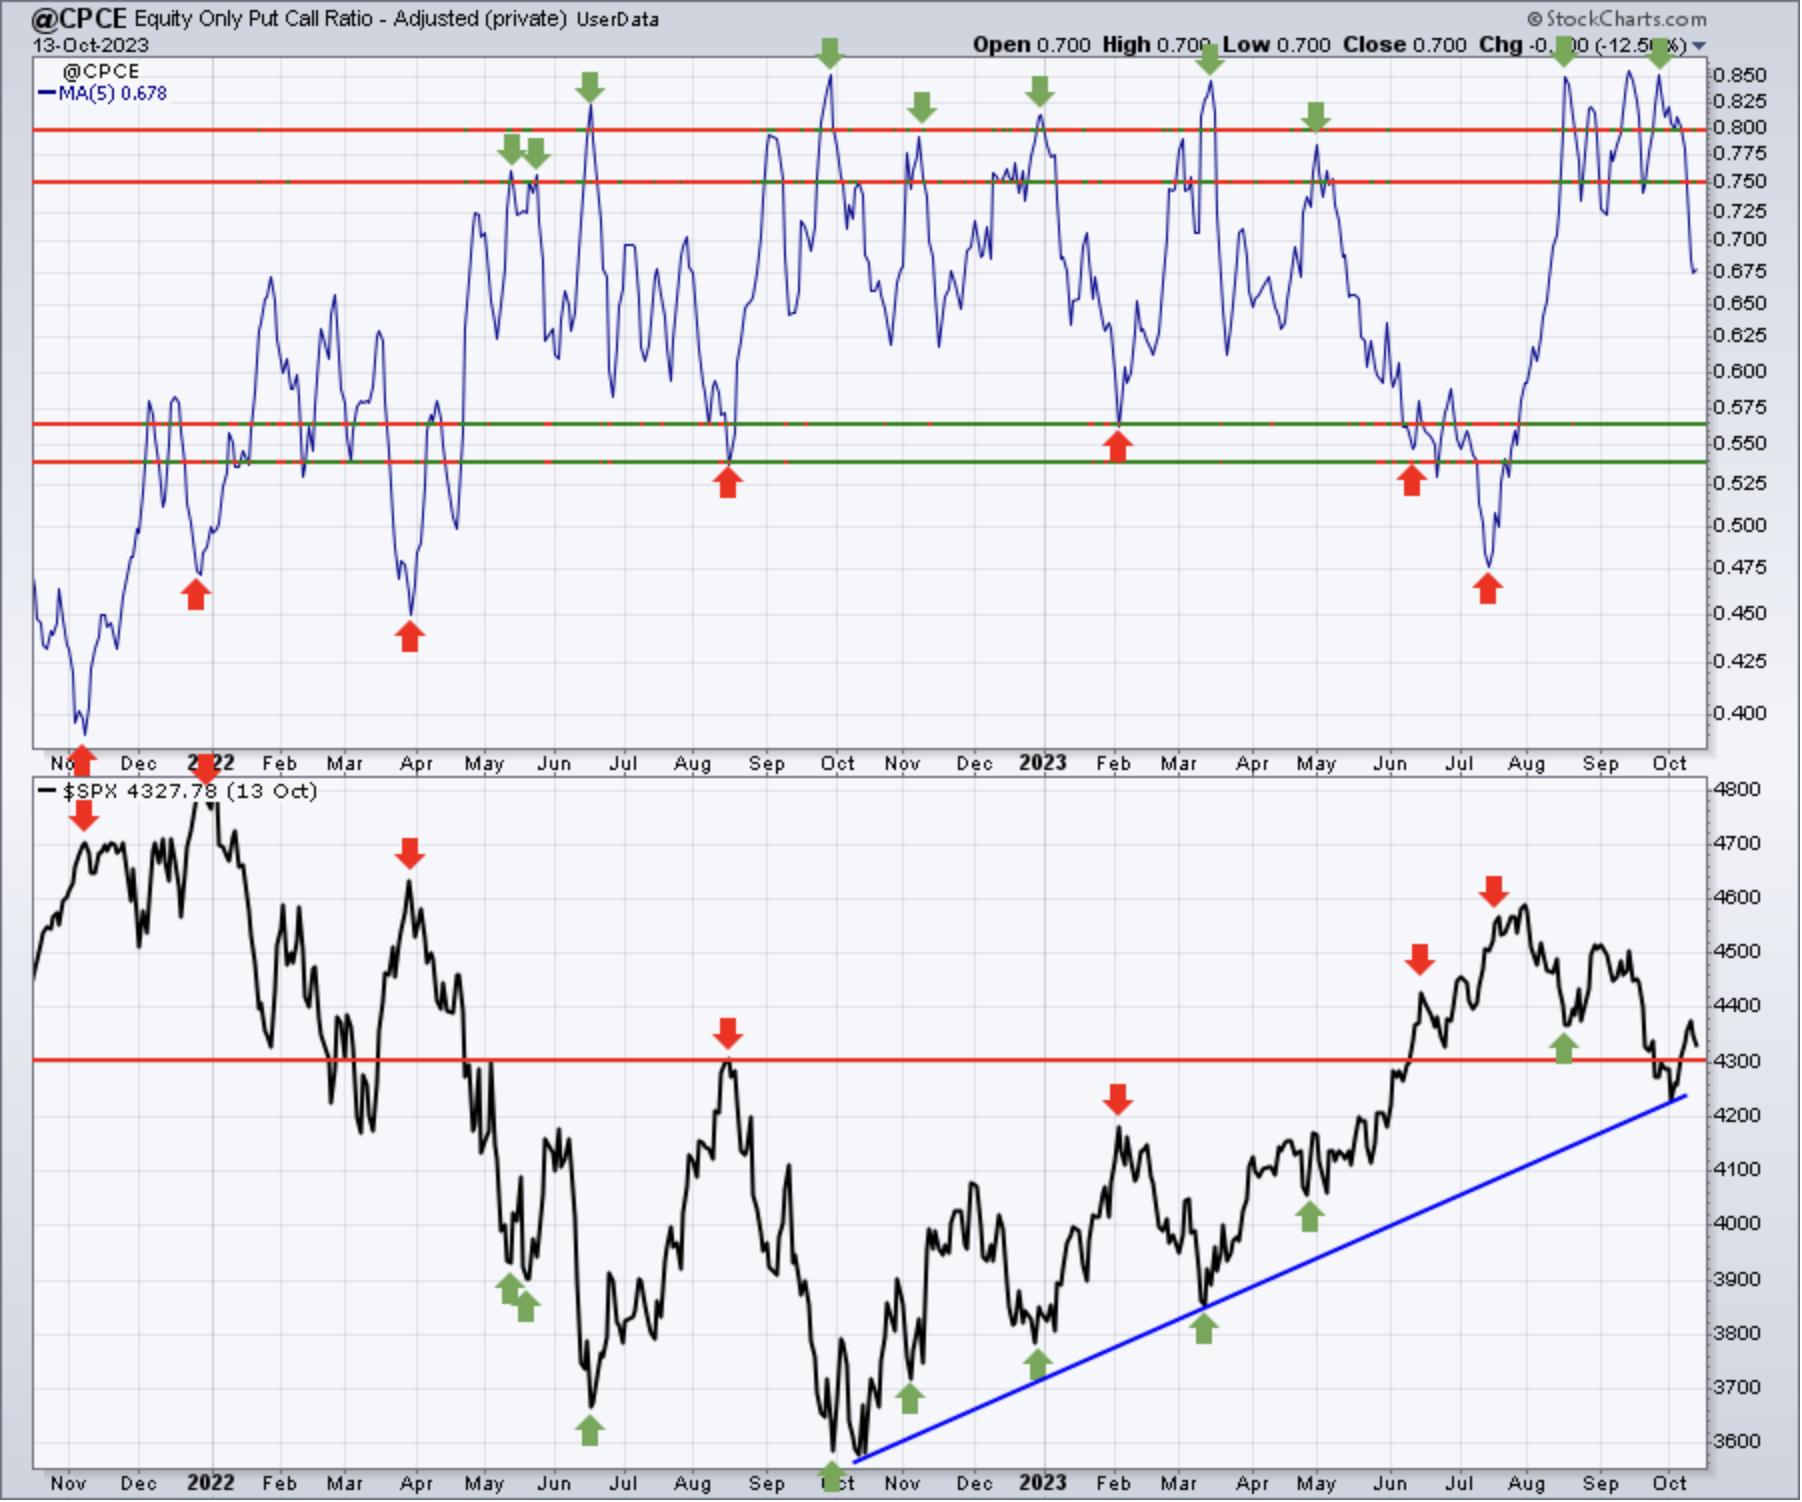
I continue to find it difficult to believe that the stock market will keep trending lower when the equity only put call ratio ($CPCE) remains so high, though it did drop last week. The S&P 500 has been able to bounce off of its recent low, and could be resuming its 2023 advance. Here's my User-Defined Index (UDI) that shows the CPCE falling as the S&P 500 rebounds:
Let me show you the 5-day CPCE at StockCharts, because it does differ considerably from my UDI:
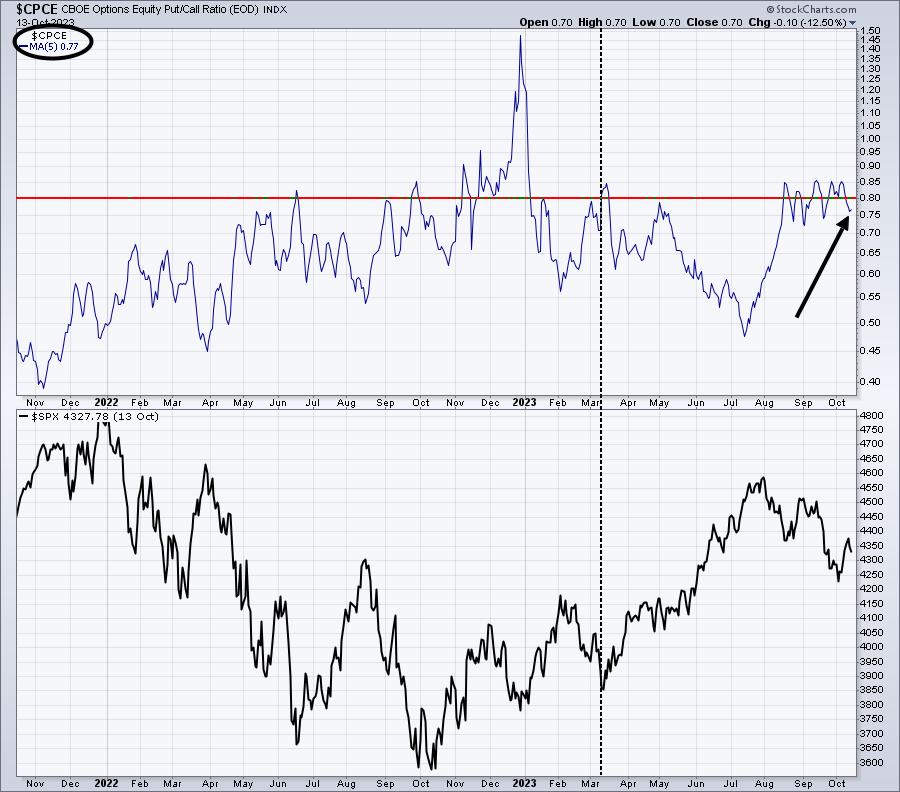
Last Wednesday, a HUGE amount of equity puts were reported by the CBOE in the middle of the trading day. The same thing happened in Q4 2022 and it was reported that large equity put positions in large cap names like AAPL, MSFT, NVDA, TSLA, AMZN, etc. were taken by hedge funds. That is NOT a reflection of retail trader fear. Instead, it's simply a designed strategy by hedge funds to manage risk. Therefore, in my UDI, I remove those large equity put trades to "normalize" the equity only put call ratio and to more accurately reflect the true greed/fear picture of individual retail traders.
Inflation
Last week, I started to mention inflation, but failed to provide the charts that I originally intended to show. So here's the long-term chart of core inflation at the consumer level ($$CCPI):
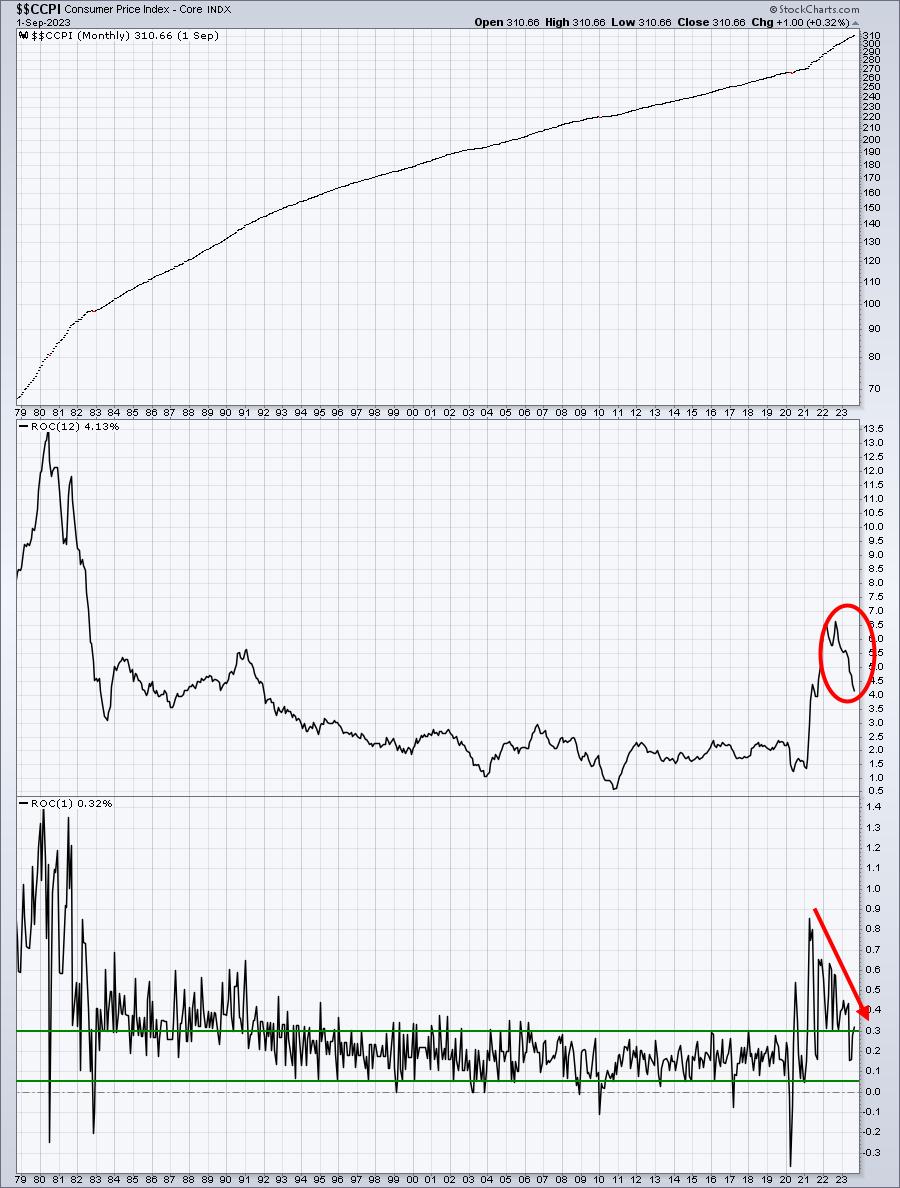
While Core CPI did jump to its highest level in the past four months, the overall direction in Core Inflation is rather clear to me. The annual rate has now dropped to 4.13% from 6.7%. Also, if we add the last 4 monthly Core CPI readings (1.04%) and annualize them (1.04% x 3 = 3.12%), the current rate of Core CPI isn't too far off from the Fed's target of 2%. We're heading in the right direction and I believe that's one reason why we'll see stocks rally into year end and 2024.
Trade Setups
Of all the longer-term setups that I've provided here since early September, Boeing (BA) remains the one stock that's performed very poorly. Perhaps there's hope for BA now that a daily positive divergence has formed:
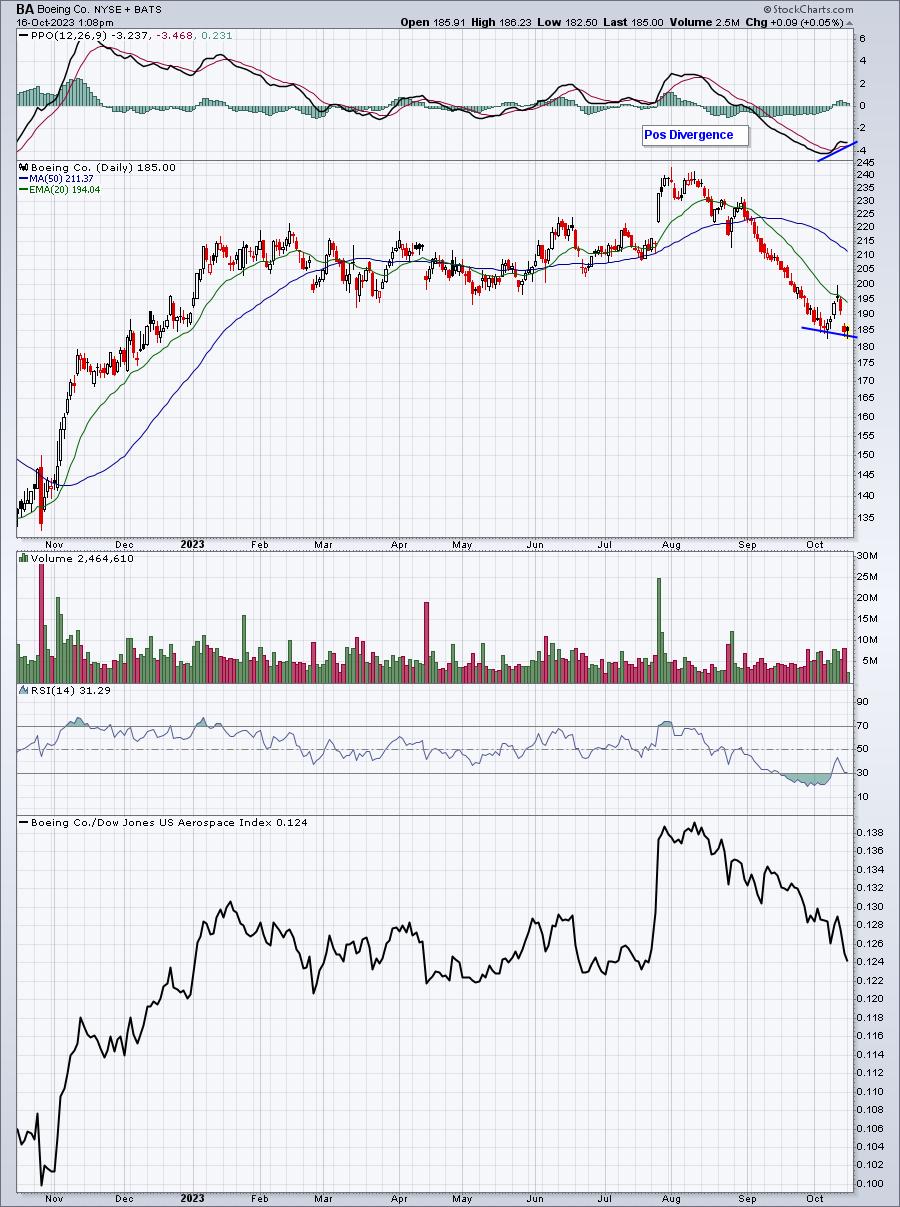
Time will tell if this is yet another opportunity to jump into BA or just one more false alarm.
One stock that I like a lot from a long-term perspective is FedEx Corp (FDX). Here's a chart highlighting its long-term strength and also its recent reversal of a relative performance ratio vs. United Parcel (UPS):
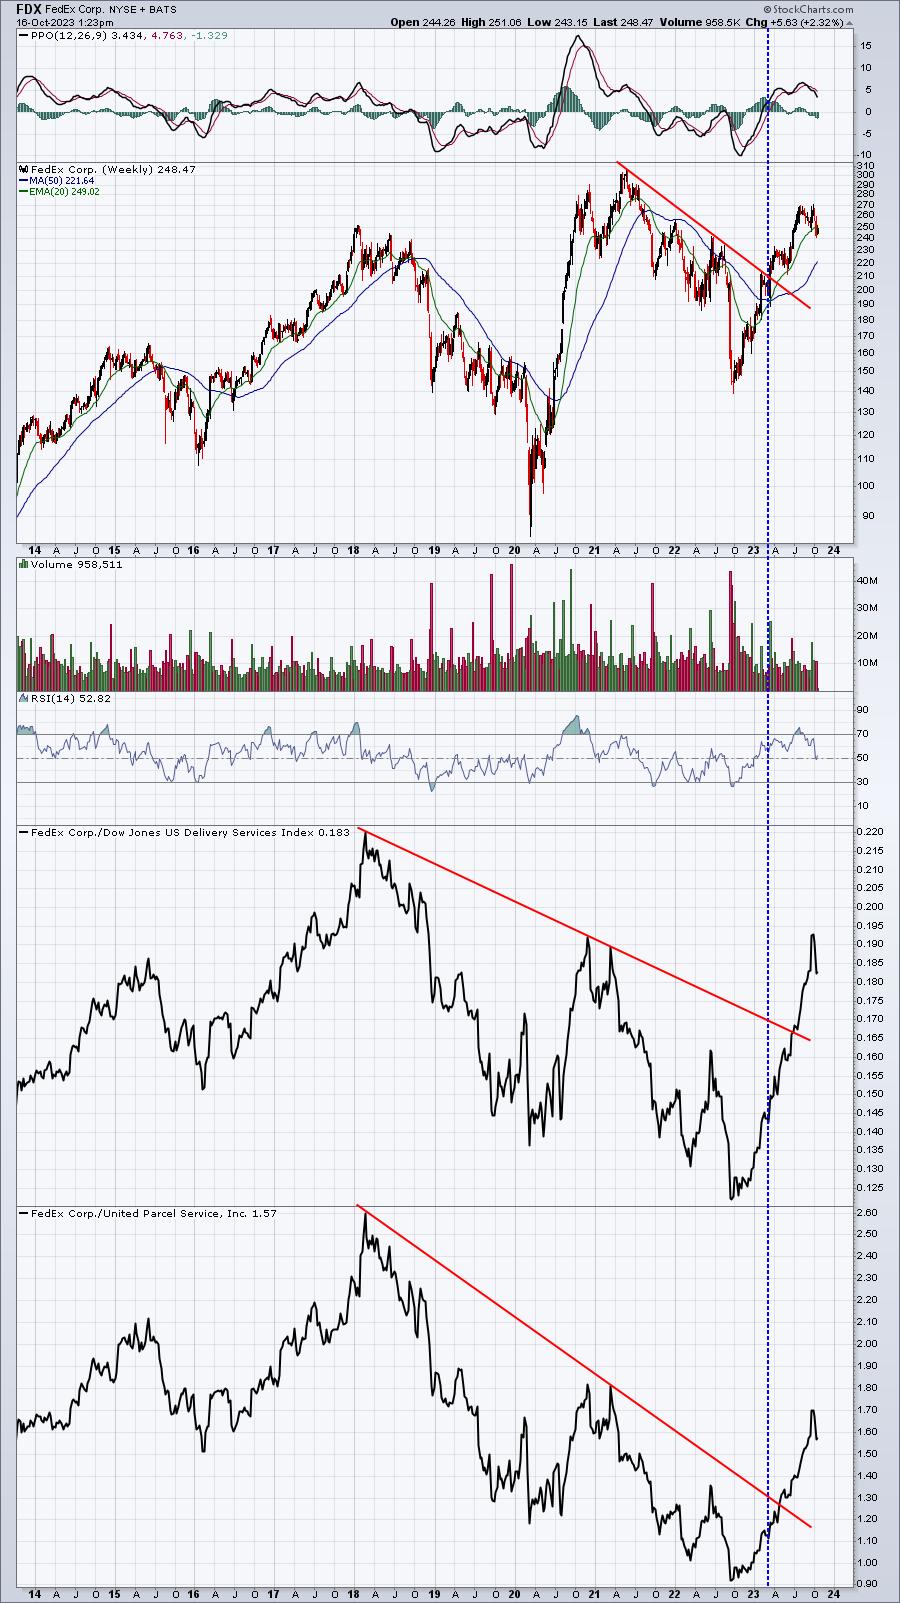
The blue-dotted vertical line shows that FDX broke its own downtrend line back in Q1 2023. Since that time, it's also broken its downtrend line vs. its delivery service peers ($DJUSAF) and its downtrend line vs. UPS. Wall Street is telling us that now is a solid time to consider FDX for the long haul.
I want to ALWAYS remind everyone that I am NOT a Registered Investment Advisor (RIA) and am not recommending that anyone buy or sell any securities that I mention. EarningsBeats.com, nor any of its employees, are RIAs. Please consult your financial advisor before buying or selling any securities. The above analysis is for educational purposes only. You are fully responsible for any securities that you buy or sell.
Looking Ahead
Upcoming Earnings
Earnings season began last week and we'll see the number of earnings reports increase consistently over the next few weeks. Here are the biggest earnings reports (in my opinion) by day and with market cap in parenthesis (this list is not meant to provide ALL the companies reporting earnings this week, just a few that I'll be watching closely):
Monday: SCHW ($91 billion)
Tuesday: JNJ ($406 billion), BAC ($213 billion), GS ($102 billion)
Wednesday: TSLA ($822 billion), NFLX ($160 billion), LRCX ($87 billion)
Thursday: TSM ($479 billion), ISRG ($94 billion), CSX ($62 billion)
Friday: AXP ($111 billion), SLB ($83 billion), RF ($15 billion)
Key Economic Reports
The Fed meeting is out of the way, but there's still plenty for us to consider this week:
Monday: Empire state manufacturing
Tuesday: Retail sales, industrial production, housing market index
Wednesday: Housing starts & building permits
Thursday: Initial jobless claims, Philadelphia Fed manufacturing index, existing home sales, leading indicators
Friday: None
Historical Data
Each week, I'll provide you the average annualized returns for each calendar day and by index. Here are the historical numbers for this week (We will be providing more visual images of seasonality in future reports, but for now I'm trying to avoid some of the scrolling issues that Excel images were causing):
S&P 500
- October 16: -9.94%
- October 17: -0.15%
- October 18: +70.59%
- October 19: -129.90%
- October 20: +93.36%
NASDAQ
- October 16: -8.81%
- October 17: -32.59%
- October 18: +40.81%
- October 19: -79.38%
- October 20: +10.69%
Russell 2000
- October 16: +122.05%
- October 17: -56.01%
- October 18: +29.12%
- October 19: -4.98%
- October 20: +74.56%
The S&P 500 data dates back to 1950, while the NASDAQ and Russell 2000 information date back to 1971 and 1987, respectively.
History is now providing tailwinds for stocks, mostly through mid-January. Next week, however, has had very bearish tendencies. The dates for this historical weakness are from the October 21st close through the October 27th close. (October 21st falls on Saturday this year, so the seasonal "exit" would be Friday, October 20th). The close on October 27th through the close on January 18th is THE ABSOLUTE BEST TIME OF THE YEAR FOR U.S. EQUITIES - HISTORICALLY SPEAKING.
Final Thoughts
Earnings season is upon us and these are several things on my mind this week:
- Earnings. I mentioned several companies that I'm very interesting in hearing from, especially TSLA and NFLX on Wednesday.
- The 10-year treasury yield ($TNX). After printing a recent high near 4.90%, the TNX fell rather expectedly to its rising 20-day EMA, reaching a low of 4.53%. It's rangebound for now, but which way do we break?
- Many banks will be reporting over the next couple weeks. I believe the large banks will be better off than the smaller banks. But how bad will it be for smaller banks? And we've been seeing a "sell on rumor" the past month or two, so do we see a "buy on news" after earnings start coming in?
- Big inflation data was reported last week, namely in the form of the September CPI report. But Fed officials will keep yapping and will very likely remain quite hawkish. Will any of it have a lasting impact on stocks here in Q4?
- Rotation is much more favorable today than it was last week. I'll be watching to see how this continues to play out with earnings, especially on those intraday ratio charts.
- The short-term 60-minute negative divergences played out late last week and our key indices are free to move in whichever direction they choose. Will that provide the bulls a lift and a move back above 4400 on the S&P 500?
- Do we see financials (XLF) and industrials (XLI) begin to show relative strength? Remember, these two groups tend to make their biggest moves in Q4, especially during November.
- Finally, let's keep an eye on the Volatility Index ($VIX). It's down 10% today to 17.39 at last check, but there have now been a dozen or so attempts to clear a major hurdle at 20 since the March low. If the VIX breaks out above 20, especially with the bearish historical week next week still staring at us, we MUST be careful from a short-term trading perspective.
Feedback
We will be making significant presentation changes over the next 2-3 weeks, so stay tuned! In the meantime, if you'd like to share your thoughts, positive or negative, you can reach us at "[email protected]".
Happy trading!
Tom