
EB Daily Market Report - Tuesday, October 17, 2023
Weekly Market Report
I realize that Monday's Weekly Market Report had a number of issues, mostly dealing with image sizes that resulted in a heavy dose of scrolling, which I agree is very annoying. It was totally my fault. As soon as I sent out the WMR yesterday, I realized I had used the wrong images. The "right" images don't completely resolve the scrolling issues, but help out a great deal. I just made a mistake.
I can tell you that, ultimately, the Weekly Market Report will be sent out in a totally different format, one that should be friendly to everyone. We just need to finish coordinating on our end over the next couple weeks before the new format will be ready. In the meantime, I'll try my best to limit the amount of scrolling necessary.
Max Pain Event Today
After the stock market closes today, we'll be hosting our October Max Pain event to see what impact monthly options expiration this Friday could have on U.S. equities. The event will begin at 5:00pm ET and I look forward to seeing those of you that can make it. As always, we will record the event for those unable to join and then you can watch it at your convenience.
Room instructions were sent out earlier this afternoon.
Executive Market Summary
- Futures were weak overnight and our major indices all gapped lower at the opening bell
- Additional early weakness was felt in the S&P 500 and NASDAQ, but small cap (IWM) and mid cap (MDY) stocks rebounded quickly after the opening bell to turn positive
- Energy (XLE, +0.85%) and materials (XLB, +0.66%) is where most of the strength is, while real estate (XLRE, -1.04%) and technology (XLK, -0.85%) are primary laggards
- Earlier strength in crude oil ($WTIC, +0.06%) led energy higher, but it has pulled back from its peak
- Meanwhile, the 10-year treasury yield ($TNX) is up 13 basis points to 4.84% after September retail sales came in much stronger than expected; August retail sales were revised higher as well
- Renewable energy stocks ($DWCREE, +4.13%) are resuming recent strength, attempting to clear its 20-day EMA
- Aluminum stocks ($DJUSAL, +3.61%) are strong as well, holding support just below 90
- First Solar (FSLR, +4.31%) is setting a new high for this month, helping to lead the renewable energy stocks higher
Market Outlook
The first significant positive divergence has now printed on the IWM daily chart, as follows:
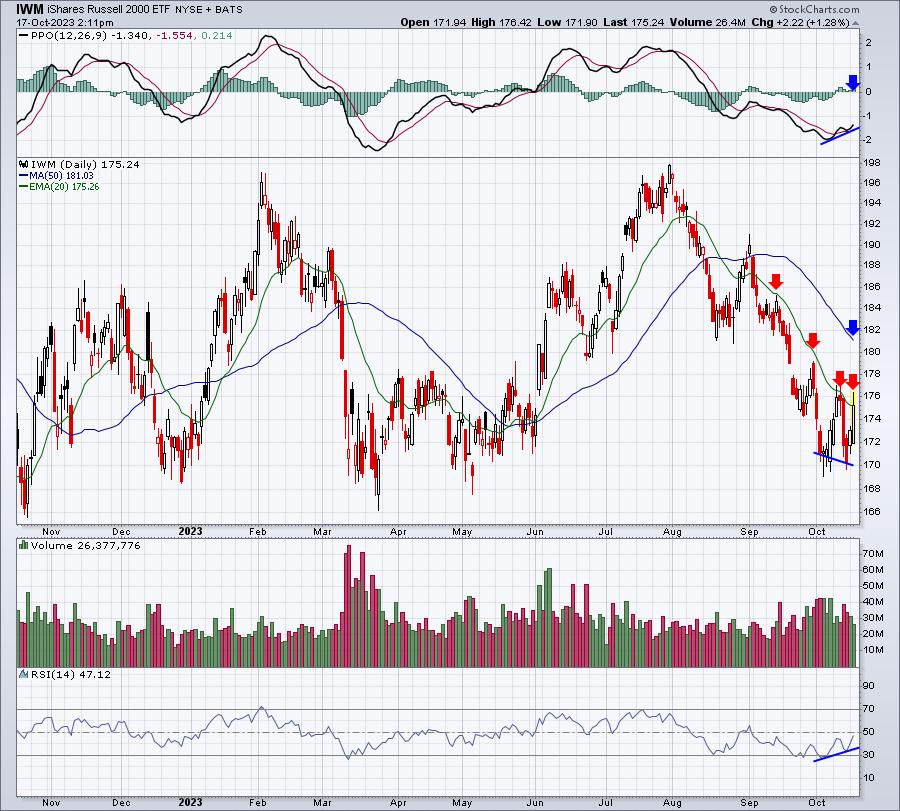
Recently, I've discussed hourly divergences, which can result in a change of direction that lasts 1-3 days. This positive divergence, however, usually plays out over 1-3 weeks. The only question is whether we see one more low before we ultimately make that reversal. Today, the IWM is challenging its 20-day EMA once again. If it's able to break out on today's close, the probabilities of an advance continuing to test the 50-day SMA significantly increase.
The red arrows highlight the recent failed attempts at clearing the declining 20-day EMA. In my experience, the odds of clearing that 20-day EMA rise after a positive divergence prints. The blue arrows highlight what I look for after a positive divergence prints - a PPO centerline test and/or a 50-day SMA test.
Sector/Industry Focus
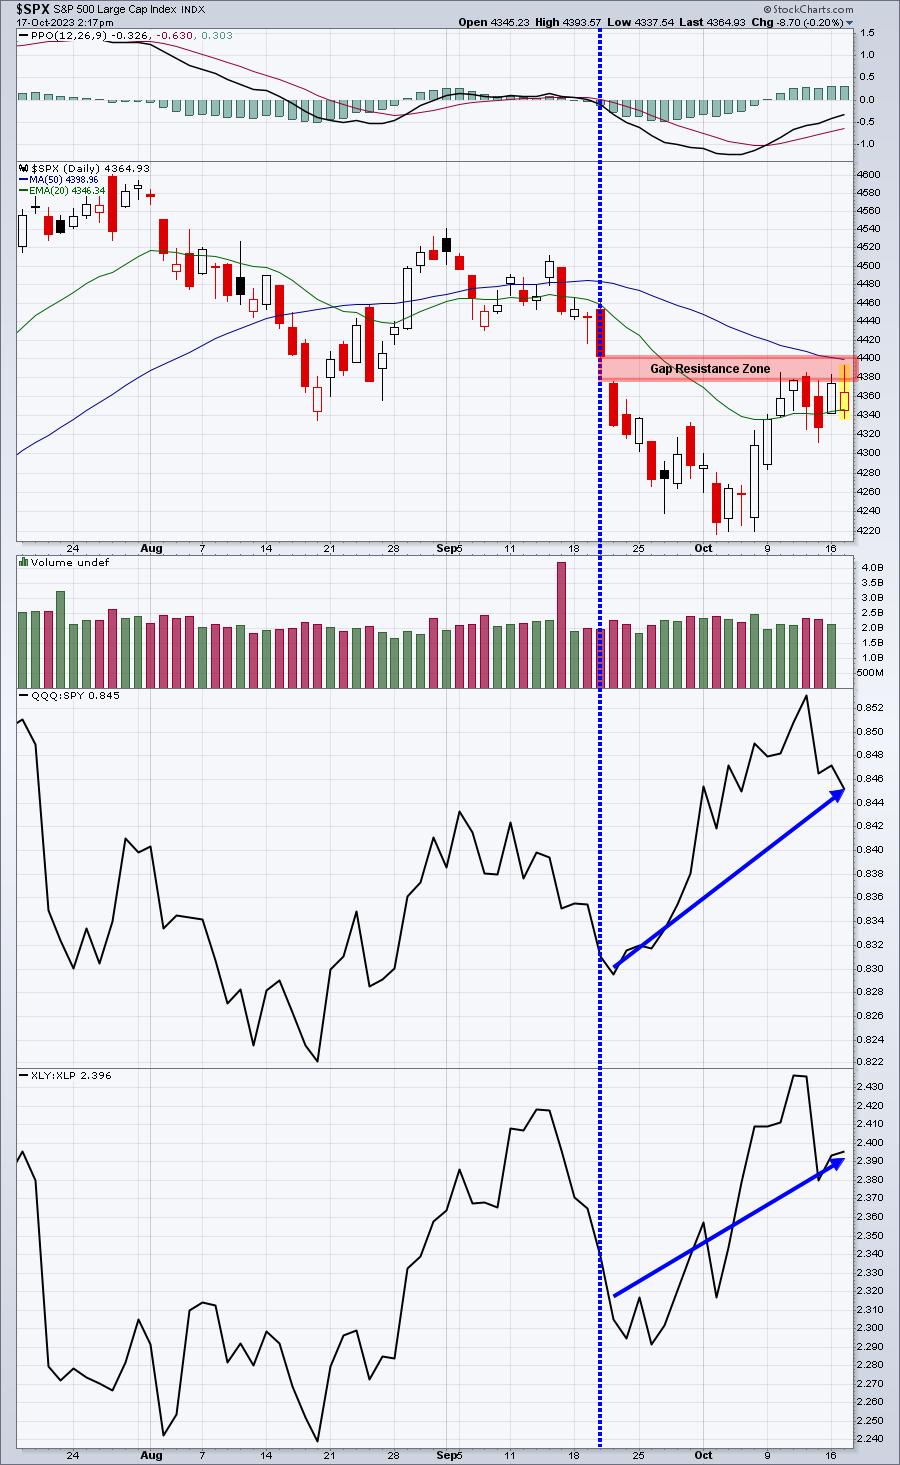
I always like to take certain points in time - perhaps when a major event takes place - to evaluate the subsequent rotation to get a sense of how the big Wall Street firms are reacting to that major event. Recently, I'd say the Fed meeting from September 19-20 fits that category as Fed Chief Powell indicated that interest rates would remain "higher for longer" and the Fed estimated just two rate cuts in 2024 vs. the four cuts that were previously forecast.
Below I have two charts that I want you to review. The first is how all of my key sustainability ratios have been performing since that Fed meeting. The second is how all of the growth vs. value ratios have reacted to this news as well. After all, if we need to reconsider investing or trading strategies based on this latest Fed announcement, we should see significant changes taking place on these two charts as money rotates, right? Well, here you go....
Sustainability Ratios
Growth vs. Value Ratios
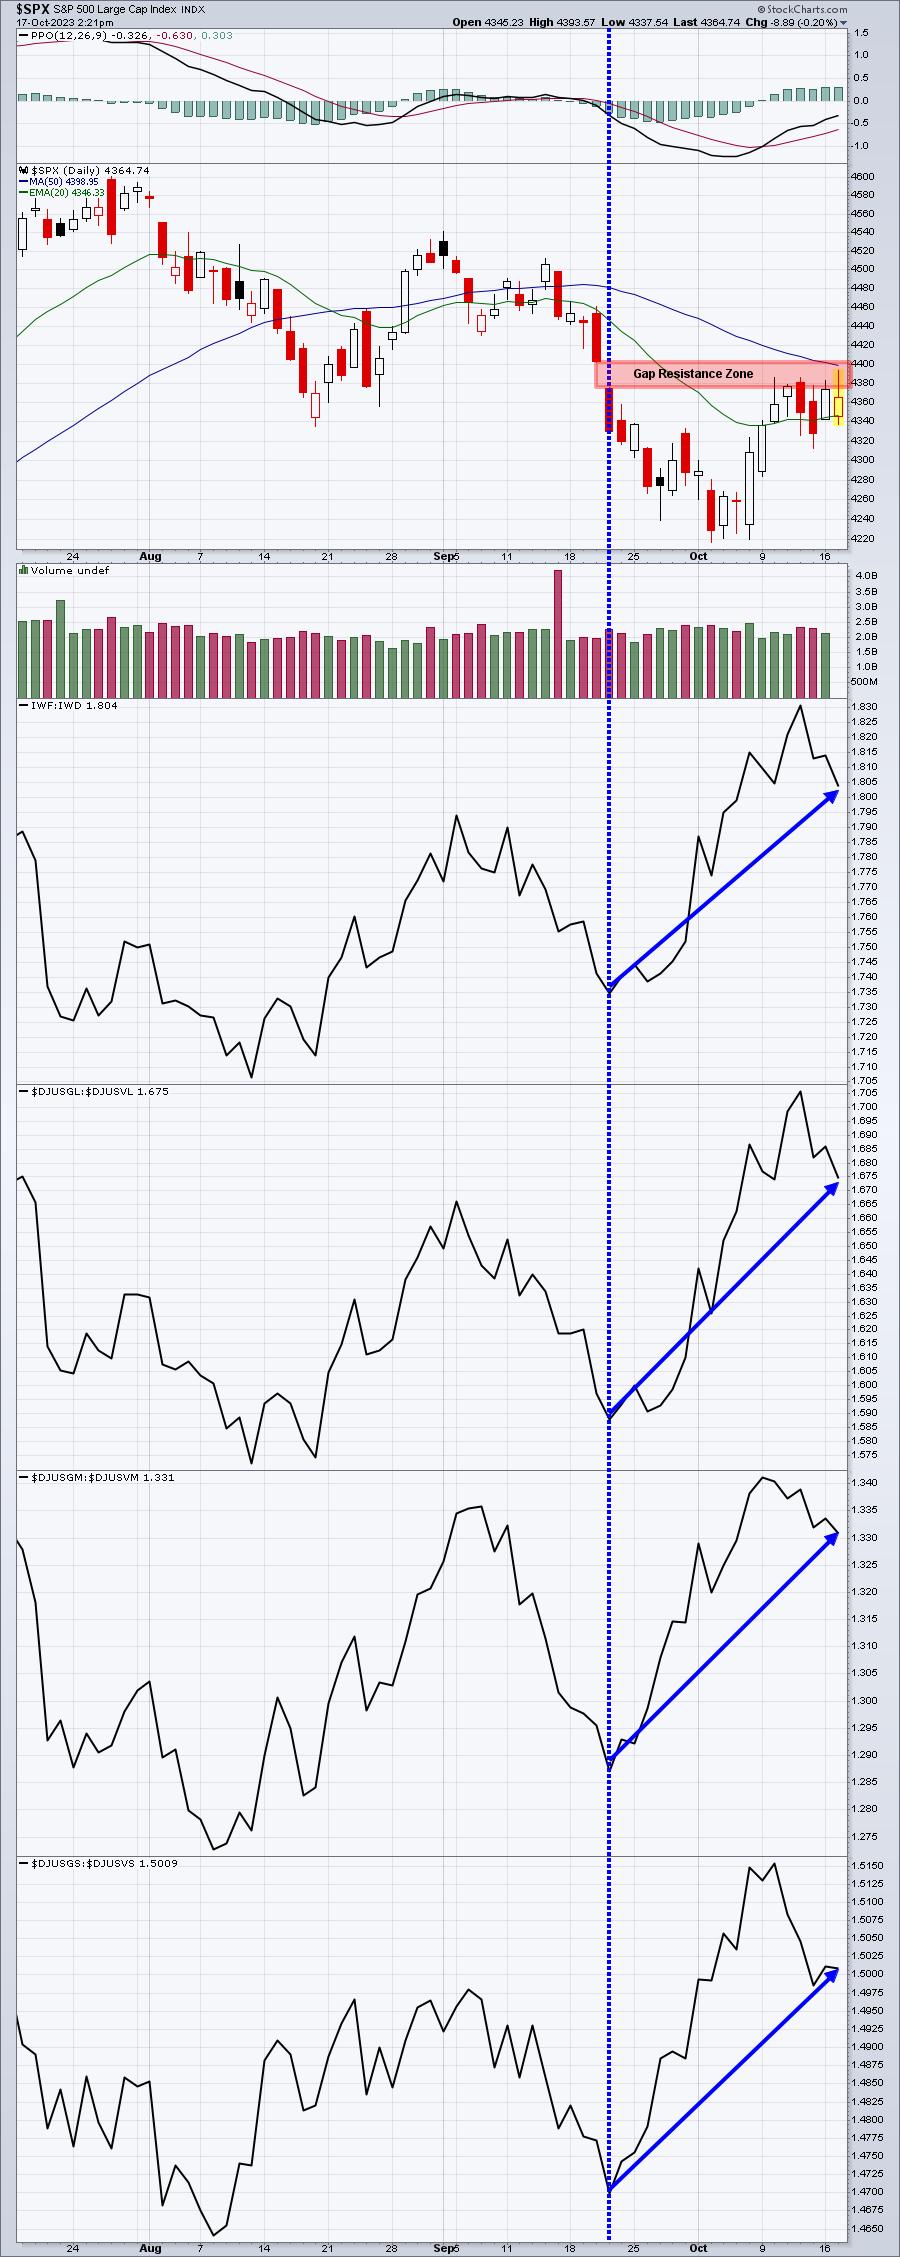
Yes, we've seen these ratios fall over the past week or so as we sideways consolidate on the S&P 500 just above the 20-day EMA. But we're WAY higher than we were at the September 20th close after the Fed said "higher rates for longer". Wall Street is NOT panicking and is not even rotating at all towards value stocks. If you were worried about higher rates snuffing out our economy and a recession around the corner, would you be rotating INTO growth? I don't think so. That's a major reason why I'm not buying into the theory that the S&P 500 is heading back down to the October 2022 low. In fact, I believe just the opposite. I believe by the end of Q4, we'll be at or very near our 2023 highs.
ChartLists/Strategies
I reviewed dozens and dozens of stocks on our Strong Earnings ChartList (SECL) and here are two that look very interesting:
DBX:
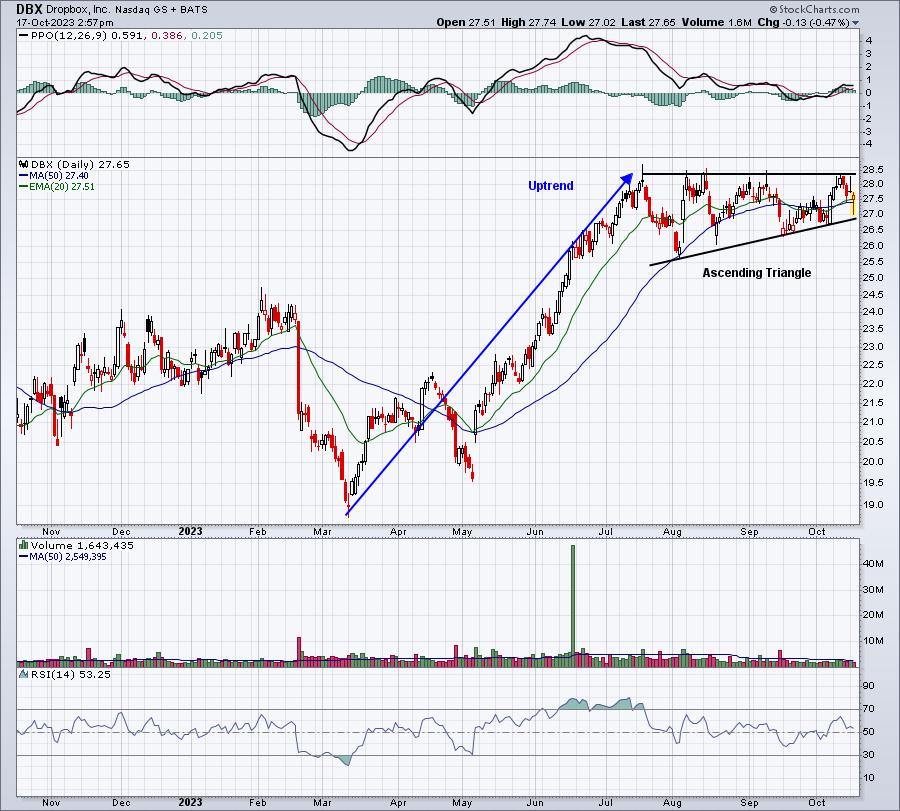
I believe I've looked at DBX at various points over the past several weeks and it remains in a very bullish continuation pattern. I suspect that when this current period of consolidation ends, DBX will break out and enjoy another leg higher.
BKNG:
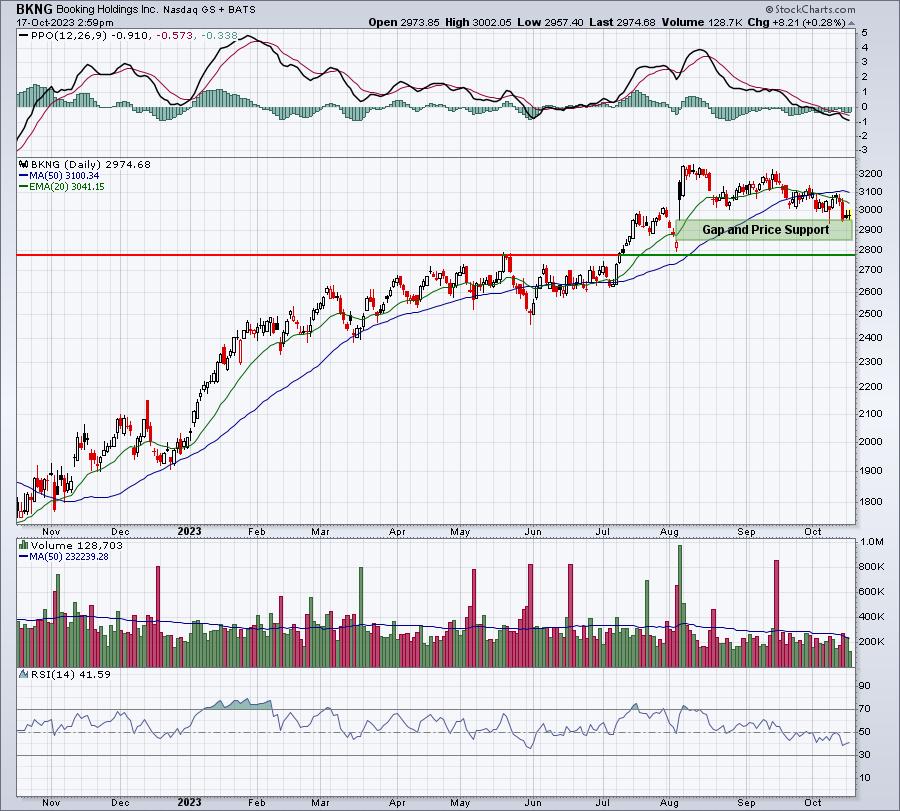
This is another that's been consolidating ever since its last earnings report in early August. I believe it's reached a level where aggressive traders could begin accumulating for a possible pre-earnings run. I'd be careful if BKNG were to close beneath 2775. Otherwise, I see higher prices ahead and an accumulation zone from 2850-2950.
Earnings Reports
Here are the key earnings reports for the next two days, featuring stocks with market caps of more than $10 billion. I also include notable companies with market caps below $10 billion. Finally, any portfolio stocks that will be reporting results are highlighted in BOLD. If you decide to hold a stock into earnings, please understand the significant short-term risk that you are taking. Please be sure to check for earnings dates for any companies that you own or are considering owning.
Tuesday, October 17:
JNJ, BAC, LMT, GS, PLD, IBKR, BK, JBHT, ERIC, OMC, ACI, UAL
Wednesday, October 18:
TSLA, PG, ASML, ABT, NFLX, SAP, MS, ELV, LRCX, USB, CCI, KMI, TRV, LVS, PPG, WIT, NDAQ, DFS, EFS, STT, MTB, STLD, NTRS, CFG, REXR, ALLY, FR, CBSH, FHN, ZION, AA, LBRT, SLG, WGO, MCRI
Economic Reports
September retail sales: +0.7% (actual) vs. +0.3% (estimate)
September retail sales less autos: +0.6% (actual) vs. +0.2% (estimate)
September industrial production: +0.3% (actual) vs. +0.0% (estimate)
September capacity utilization: 79.7% (actual) vs. 79.6% (estimate)
August business inventories: +0.4% (actual) vs. +0.3% (estimate)
October housing market index: 40 (actual) vs. 45 (estimate)
Happy trading!
Tom