
EB Daily Market Report - Thursday, October 19, 2023
Schedule Next Week
I want to give everyone a heads up as I'll be traveling out to Redmond, WA, visiting StockCharts.com. I'll be interviewed for a special show that will be aired on YouTube and I'll also be doing a Your Daily 5 episode from their studio. Finally, I'll join David Keller for The Final Bar live in his studio as well. I believe The Final Bar will air on Friday, October 27th.
I'll be flying out on Wednesday, October 25th and then back on Saturday, October 28th. Obviously, there will be some disruptions to our schedule at EarningsBeats.com. Our Trading Places Live shows on Wednesday and Thursday are cancelled. The Live Trading Room, normally held on Wednesdays as 10am ET, will also be cancelled. Expect very brief Daily Market Reports from Wednesday through Friday. Depending on my schedule intraday, John Hopkins may send out brief market updates on one or all of those days as well.
I apologize for any inconvenience, but these trips out to StockCharts are rare and generally yield some great ideas for collaboration.
Executive Market Summary
- Futures were mixed overnight, but turned mostly positive heading into this morning's opening bell
- Tesla (TSLA, -8.50%) and Netflix (NFLX, +15.92%) reported quarterly results, with TSLA coming up short on earnings, while NFLX blew away expectations - totally opposite what I'd have expected
- The 10-year treasury yield ($TNX) is setting another new 16-year high, rising another 4 basis points to 4.94%
- Crude oil ($WTIC, -0.65%) is down fractionally and back beneath $88 per barrel
- Surprisingly, as our major indices have weakened from the open, 3 aggressive sectors are leading on a relative basis - communication services (XLC, +1.10%), technology (XLK, +0.45%), and industrials (XLI, -0.10%)
- Meanwhile, the laggards include health care (XLV, -1.58%) and consumer discretionary (XLY, -1.45%)
- Pharmaceuticals ($DJUSPR, -2.45%) are weighing heavily on the XLV, while TSLA's weak reaction to earnings is dealing a blow to the XLY
- Nearly all commodities are lower on the session as well
Market Outlook
The S&P 500 continues to roll over and is currently at today's low, breaking beneath yesterday's low, which, in turn, took out lows from the past couple weeks. Not great action. The "below the surface" signals that I like to follow are giving mixed signals right now. I've included them in the bottom two panels in the chart below:
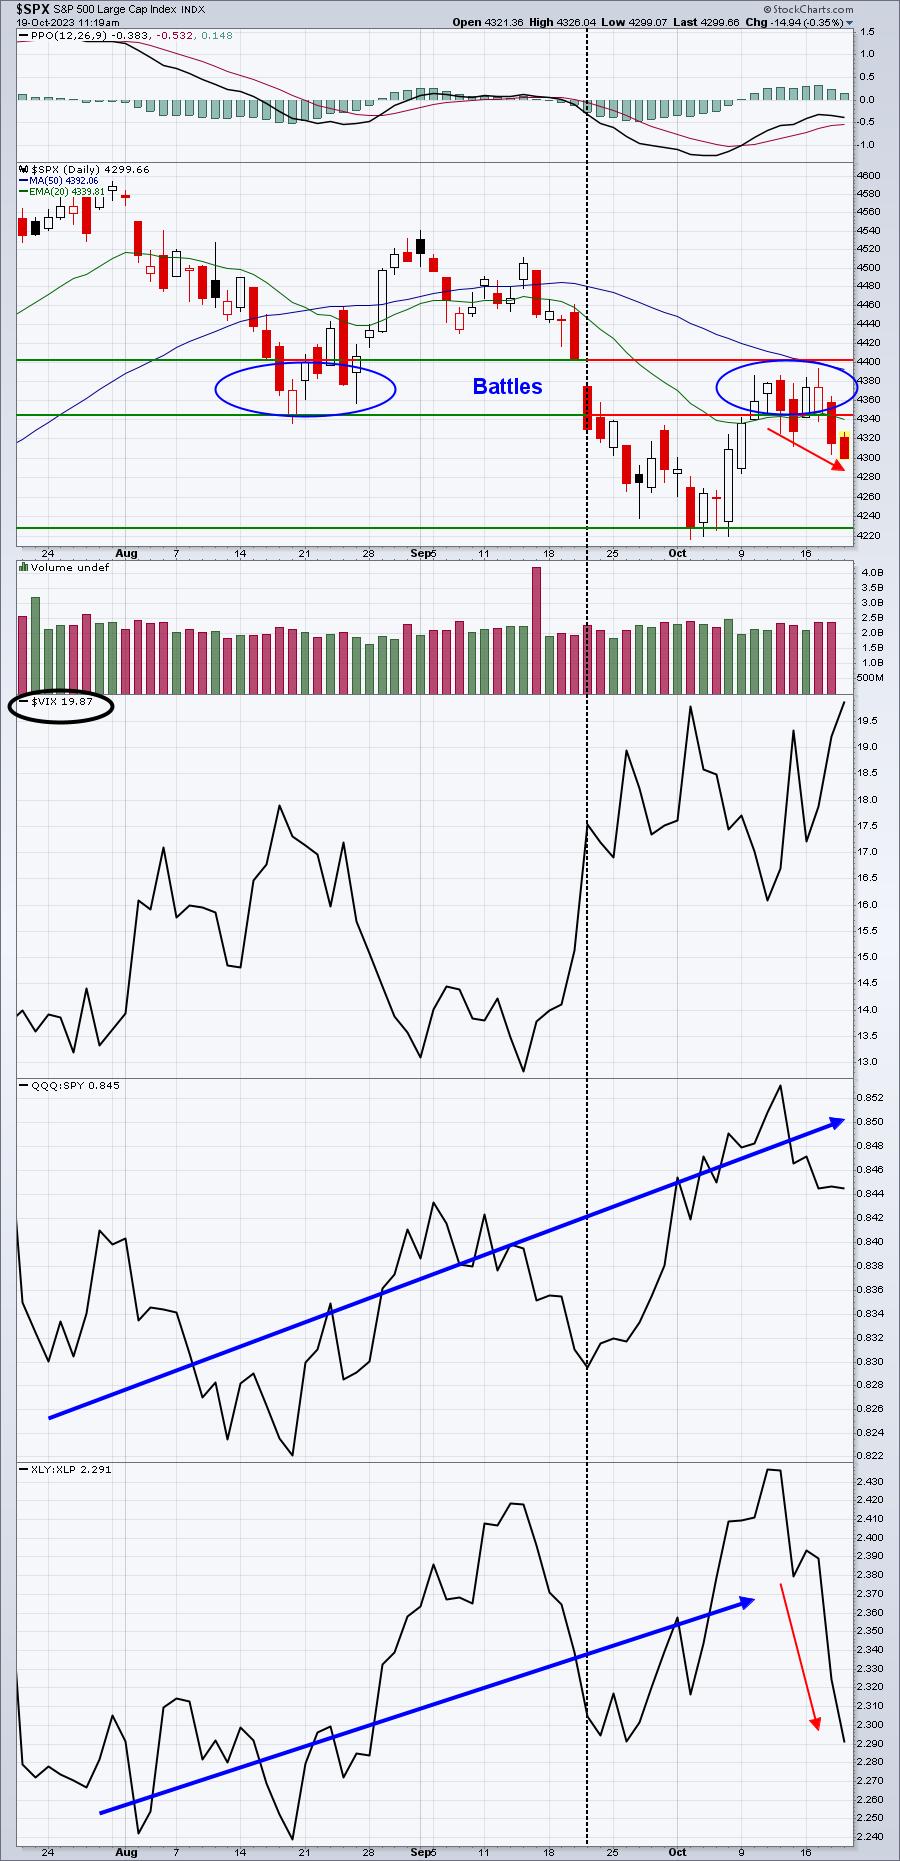
The price battle between the bulls and bears has clearly been in the 4340-4400 area. Now that the S&P 500 has moved back beneath that 4340 level, I'd say the bears are in control of the short-term action.
The bottom panels include the Volatility Index ($VIX), which is approaching the short-term critical resistance level at 20. Should the VIX make a meaningful break above 20, it's an indication that market makers are pricing in more extreme volatility ahead, which could result in a swifter move to the downside. 4220-4230 would be the next target lower and I wouldn't be at all surprised to see it over the course of the next week as we face the worst historical week of the calendar year, beginning on Monday.
Currently, money is still rotating towards the more aggressive QQQ vs. the SPY. It has come down over the past week, but the overall 3-month trend is UP. That's the good news. The bad news is that the XLY:XLP ratio has taken a serious turn to the downside and is threatening a nearly two-month low. This does include gaps, however, and I like to take those out and see what's been happening on an intraday basis, when rotation actually takes place through buys and sells.
Sector/Industry Focus
The XLY:XLP ratio above is moving down, which is clear. Below is the intraday look at this XLY:XLP ratio, through yesterday's close:
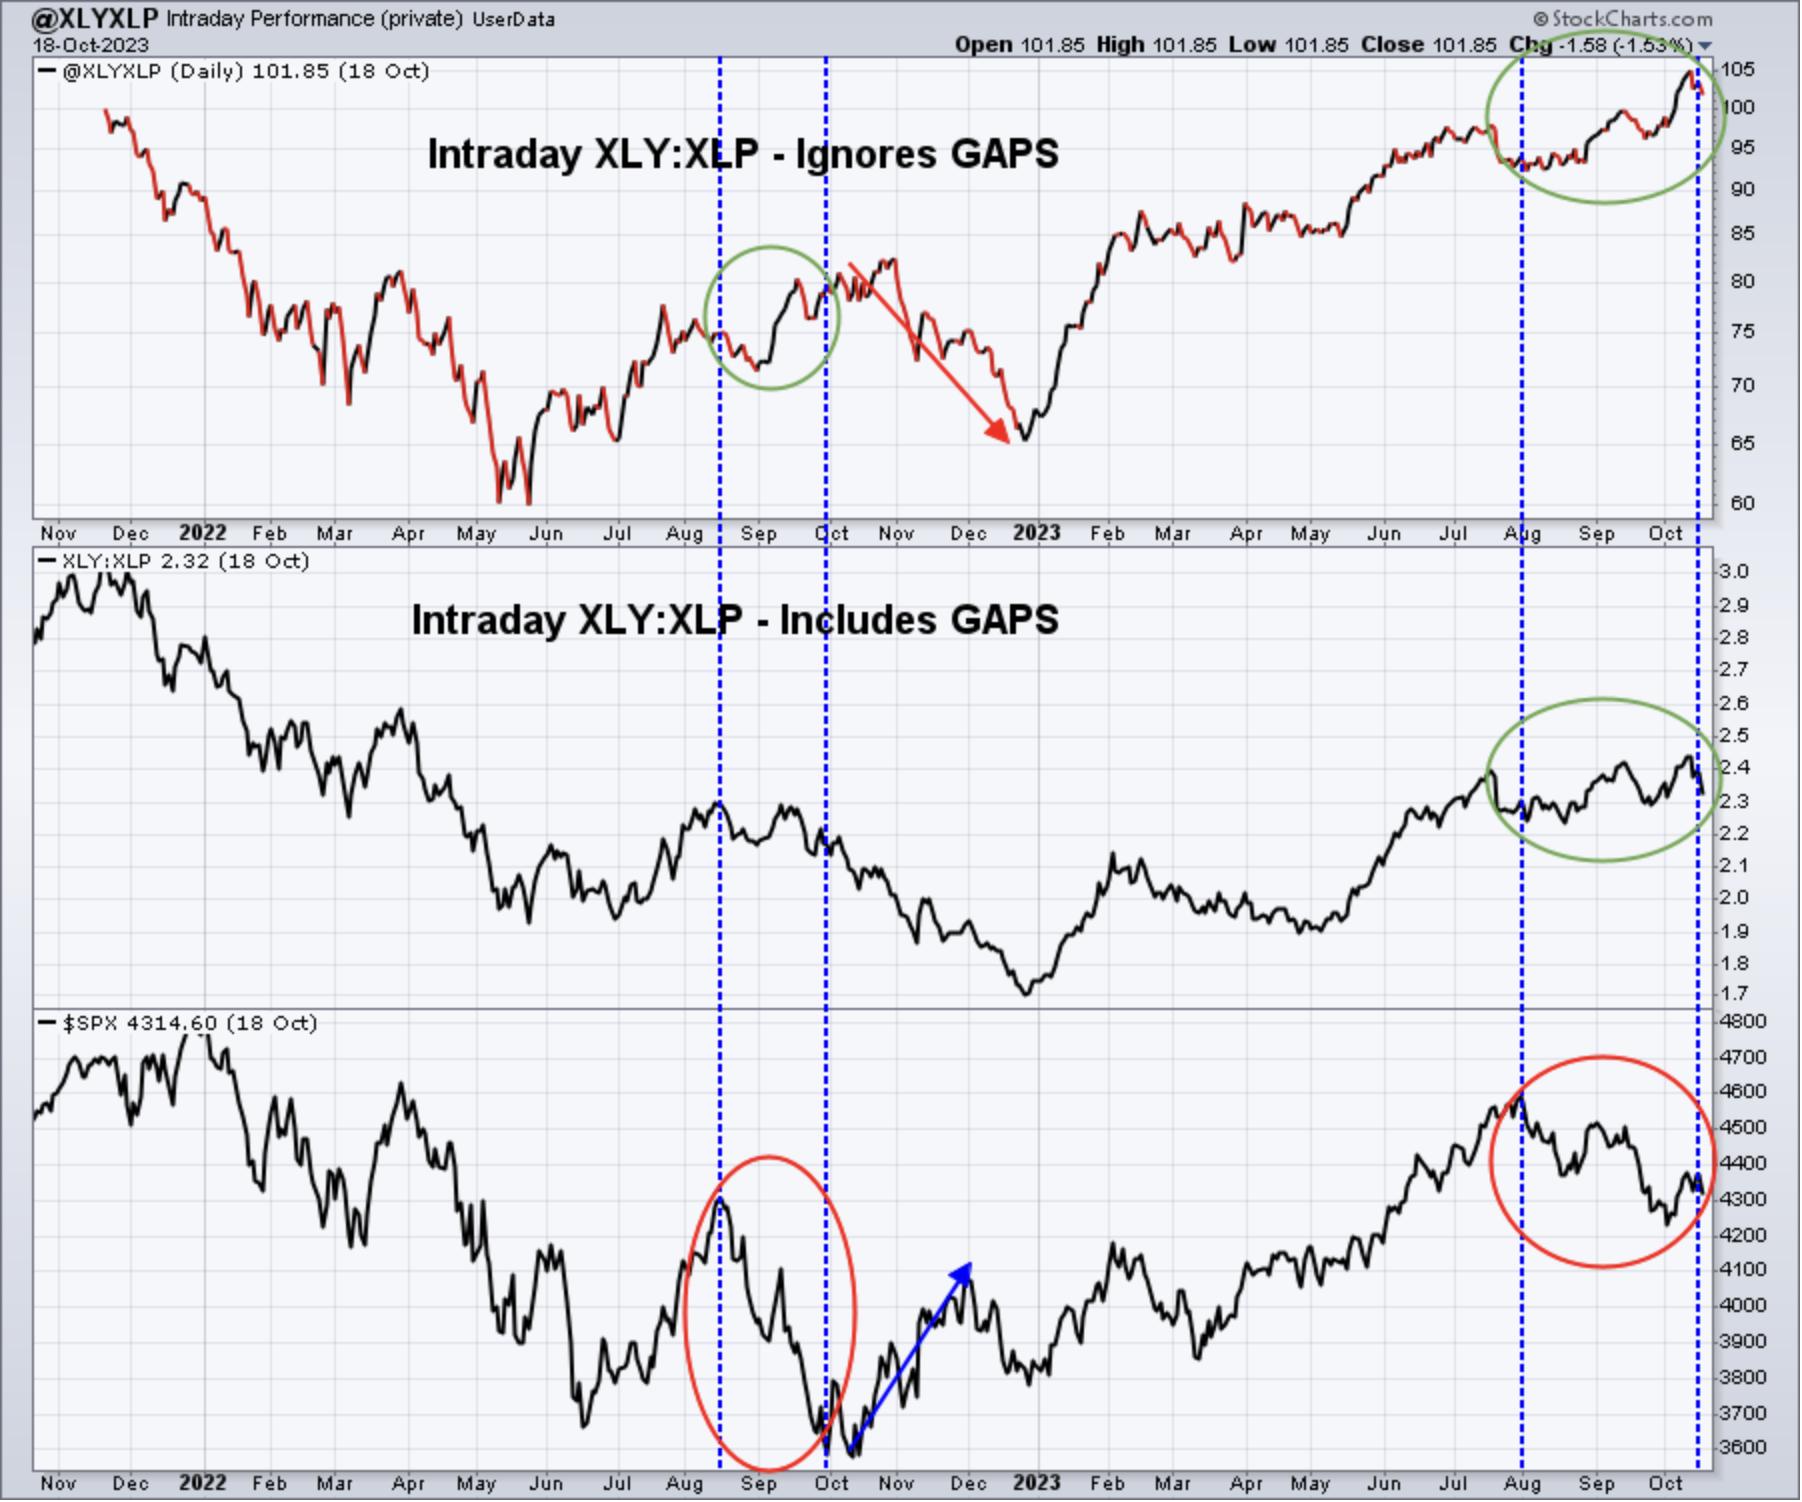
This definitely provides us a different picture. This intraday XLY:XLP ratio continues to trend higher and higher, though it has pulled back a bit from the recent high. My point, though, is that as the S&P 500 has corrected in A-B-C fashion since July, money throughout the day keeps rotating towards discretionary vs. staples. I find this action bullish from a Big Picture level.
So here are my thoughts. In the very near-term (through next Friday), I believe the odds favor the bears and more selling and/or chop. If the VIX sustains a move above 20, then further selling is very likely. But after next Friday, we move into THE most bullish period of the year (October 27th close through January 18th close), a period in which the S&P 500 has risen 62 of the past 73 years. That's not 100% of the years, but it's a very high percentage. This also lines up with my "below the surface" signals that remain quite bullish. So for those who have been waiting patiently since July to step up aggressiveness on the long side, or to simply get back into the market, I believe your time is rapidly approaching.
I'm treating the next 8 days with a TON of respect, given the selling, the VIX, and the historical bearish week ahead, but I'm also viewing it as potentially a MAJOR opportunity.
ChartLists/Strategies
I'm respecting the current bearish market environment and choosing to avoid individual stock trades for now. That may change later next week and the following week, but for now I believe it makes sense to remain quite cautious.
Earnings Reports
Here are the key earnings reports for the next two days, featuring stocks with market caps of more than $10 billion. I also include notable companies with market caps below $10 billion. Finally, any portfolio stocks that will be reporting results are highlighted in BOLD. If you decide to hold a stock into earnings, please understand the significant short-term risk that you are taking. Please be sure to check for earnings dates for any companies that you own or are considering owning.
Thursday, October 19:
TSM, PM, UNP, T, ISRG, MMC, BX, CSX, FCX, TFC, VTMX, GPC, NOK, FITB, WSO, POOL, SNA, KEY, KNX, AAL, EWBC, IRDM, WAL, ALK, OZK, MAN, TCBI
Friday, October 20:
AXP, SLB, RF, HBAN, IPG, ALV, CMA
Economic Reports
Initial jobless claims: 198,000 (actual) vs. 211,000 (estimate)
October Philadelphia Fed manufacturing index: -9.0 (actual) vs. -7.0 (estimate)
September existing home sales: 3,960,000 (actual) vs. 3,900,000 (estimate)
September leading indicators: -0.7% (actual) vs. -0.4% (estimate)
Happy trading!
Tom