
EB Daily Market Report - Friday, November 3, 2023
Executive Market Summary
- Futures were mixed until the October jobs report was released at 8:30am ET
- Futures then exploded higher with all of our major indices gapping UP
- Payrolls came in slightly below expectations, unemployment was a bit above expectations, and average hourly earnings were below expectations - absolute nirvana for U.S. equities
- Apple, Inc. (AAPL, -0.80%) weighed on technology (XLK, +1.13%) and the NASDAQ, despite beating both revenues and EPS; it's recovered most of its early losses, however
- Commodities are mixed with crude oil ($WTIC, -1.54%) prices slumping back to $81 per barrel
- The 10-year treasury yield ($TNX) down another 10 basis points today to 4.57% after briefly falling below 4.50%; see more on the TNX below
- We're seeing some rotation into more value-oriented areas as real estate (XLRE, +2.65%) bounces with yields dropping
- Materials (XLB, +1.80%) is also showing relative strength
- While 10 sectors are higher on the session, energy (XLE, -0.93%) is struggling due at least in part to the lower crude prices
Market Outlook
It's hard not to like the action that we've seen during the recent correction and the subsequent rebound this week. I kept pointing out that there was no rotation away from growth as the S&P 500 corrected off of the July high. In other words, the big Wall Street firms were not aggressively moving away from growth stocks. In fact, they weren't moving away at all as you can clearly see from this chart:
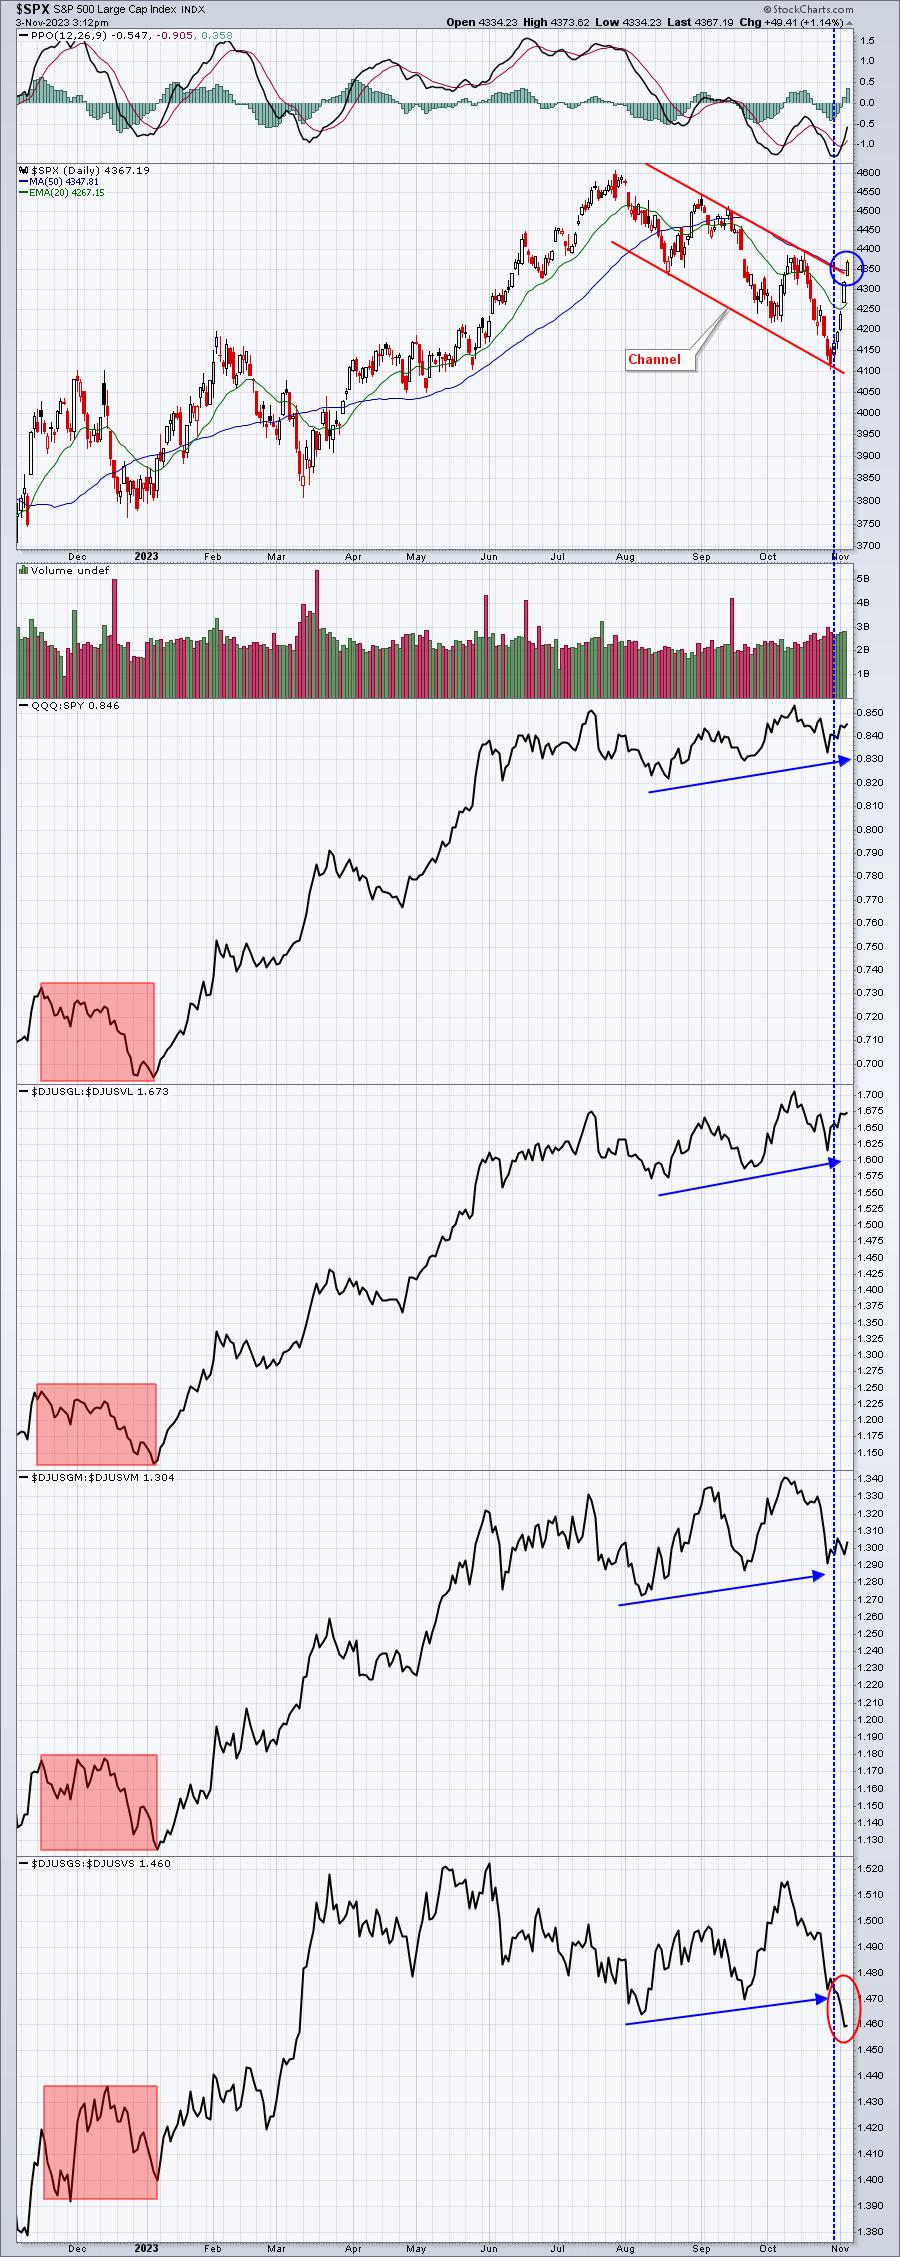
This type of relative behavior during downtrends doesn't concern me in the long-term. I can't keep the market from doing its thing, perhaps to the downside, during the short-term, but long-term I expect to see a rally based on how these intermarket relationships have evolved over the past few months. The growth vs. value strength was at each of the 3 asset classes - large, mid, and small caps. That's what the above chart shows us. Over the past week, we have seen small cap growth take a back seat to small cap value. This rotation is fairly typical as the following relative seasonality chart shows:
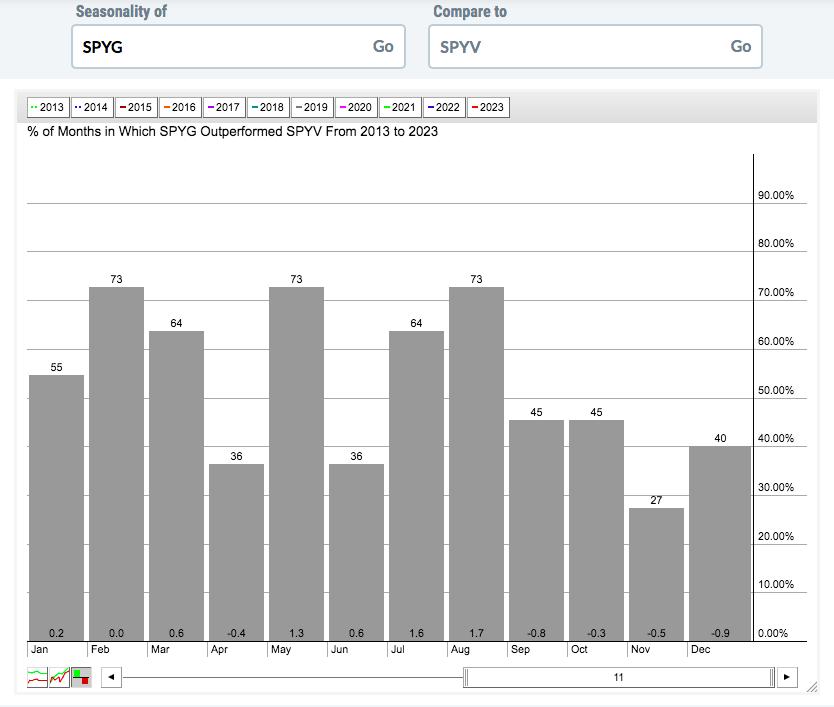
Check out those last four months of the year. The number at the bottom tells us how S&P 500 growth has performed vs. S&P 500 value throughout the entire secular bull market. This is normal. Look back to the end of 2022 on the S&P 500 chart above. Do you see the red-shaded area? The S&P 500 gained ground in Q4, especially in November, without the help of relative strength in growth areas. Again, this is normal. Don't be surprised to see rotation away from growth from now through the balance of the year. It's what helped propel small caps (IWM, +3.07%) to outsized gains the past couple days. When I expected to see relative strength in the IWM, it was because I was expecting to see areas like industrials and financials show relative strength. We're now seeing that.
Sector/Industry Focus
That negative divergence on the 10-year treasury yield ($TNX) convinced me that the likely direction of the TNX would be down. I was expecting a minimum drop to the 4.50%-4.60% range and we hit the bottom of that range earlier today:
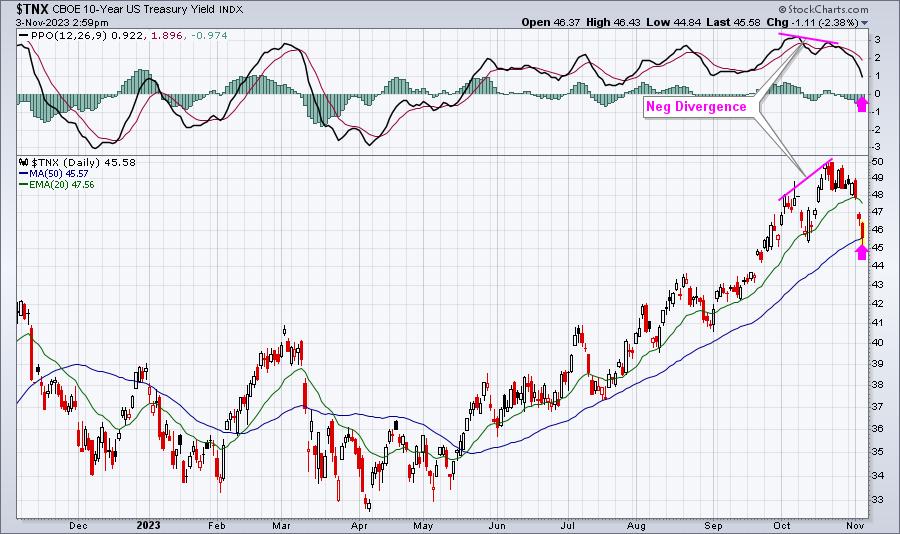
The two pink arrows mark what I expect to see after a negative divergence prints. I expect a trip to the 50-period SMA and I also look for a PPO centerline test. That effectively wipes out the slowing momentum issue. Then we have to wait to see if we'll actually break below those levels or rebound off of them.
We know that one factor that's been driving the stock market lower has been the rising yield. Well, that issue has now been removed and the stock market is loving it. I stand by my consistent prediction of a very strong Q4 for U.S. equities.
ChartLists/Strategies
I would consider more individual trades as we approach year end. I believe the market environment will be more conducive to making money on the long side of trades. There were two beautiful setups that I mentioned earlier this week and I'll discuss those below:
NVDA:
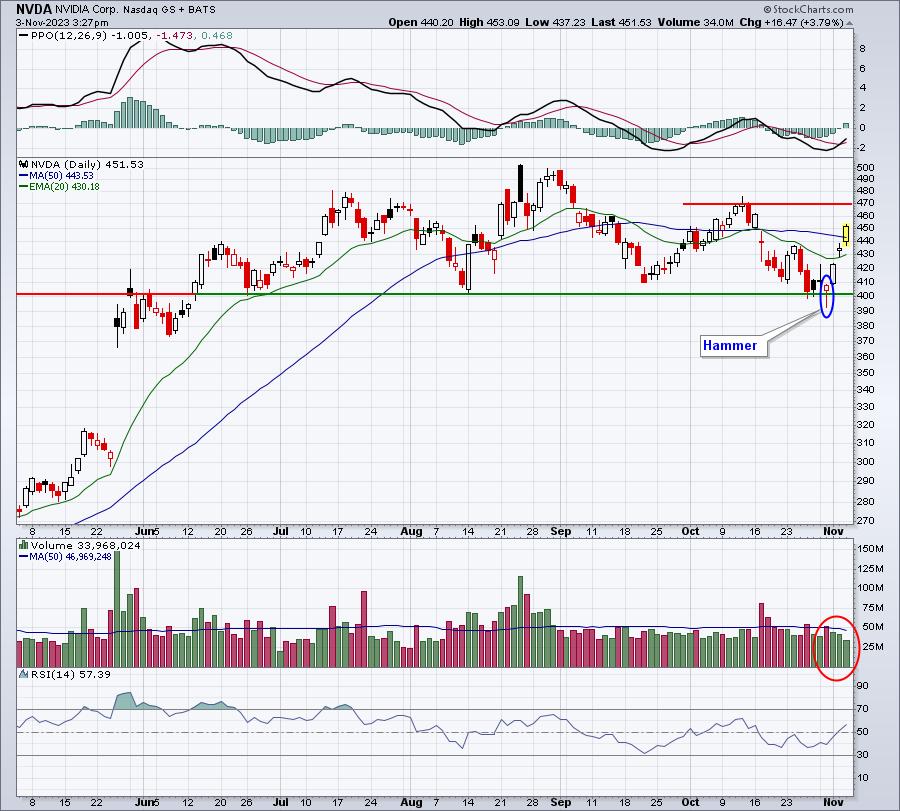
This is a trade I made very late on Tuesday after seeing this hammer unfold after price support was lost intraday. It turned out to be very timely. I'm still holding NVDA, but will likely sell a part of my holding before the close today and will continue to unwind as it moves towards price resistance near 470. NVDA has a long history of pushing higher during its quarterly earnings report months - February, May, August, and November.
FLR:
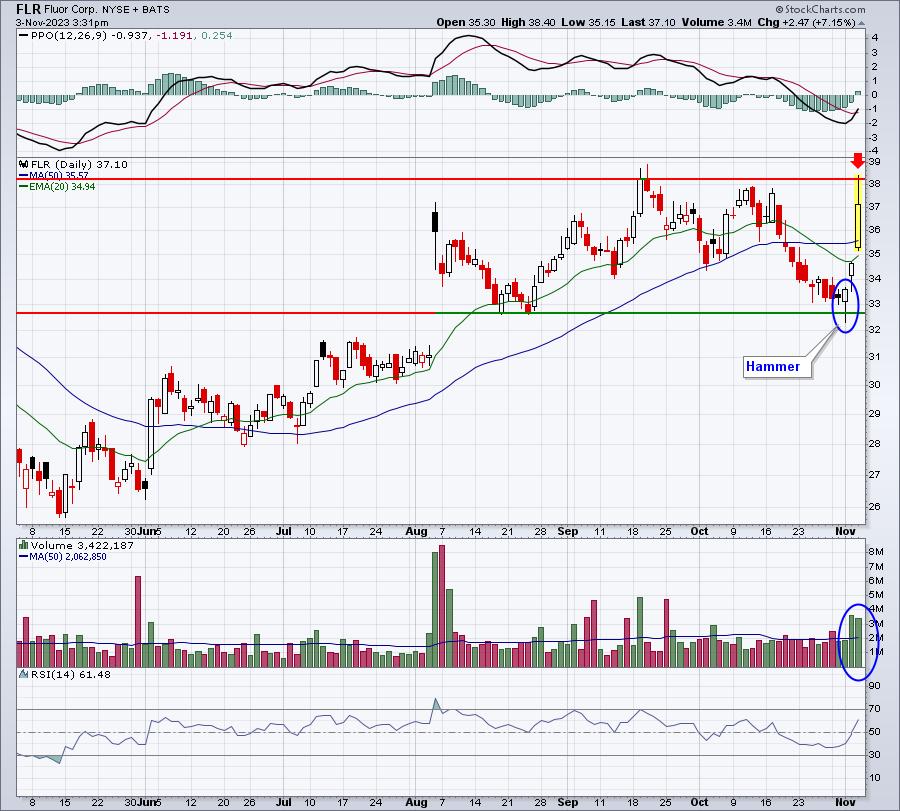
This one was mentioned during our Q3 Earnings webinar on Wednesday after the market had closed. It was one showing excellent relative strength vs. its heavy construction ($DJUSHV) peers and its quarterly earnings were to be released this morning. I didn't buy this one, but my son did after astutely pointing out its solid seasonal track record in November. During the secular bull market, FLR has averaged gaining 9.0% during Novembers. The next best month was April at 4.4% average return. Furthermore, FLR had risen 8 of the last 10 Novembers. When you have that type of seasonal tailwind, combined with a false breakdown and hammer, trading results can be quite successful and rewarding. Note that FLR, while it reacted quite bullishly today to its revenue-beating and EPS-beating results, could not break through its overhead price resistance at the 38 level. That was the target and sell price - until FLR can make the convincing breakout.
Earnings Reports
Here are the key earnings reports for the next two days, featuring stocks with market caps of more than $10 billion. I also include notable companies with market caps below $10 billion. Finally, any portfolio stocks that will be reporting results are highlighted in BOLD. If you decide to hold a stock into earnings, please understand the significant short-term risk that you are taking. Please be sure to check for earnings dates for any companies that you own or are considering owning.
Friday, November 3:
ENB, SRE, D, IT, TU, CAH, CHD, QSR, CBOE, MGA, CRBG, WPC, PAA, UI, IEP, BEP, HR, FLR
Monday, November 6:
VRTX, NXPI, Q, FANG, BNTX, CTRA, RYAAY, IFF, CE, BAM, AZPN, WTRG, SWAV, GGB, CCCS, FN, FSK, RHP
Economic Reports
October nonfarm payrolls: 150,000 (actual) vs. 179,000 (estimate)
October private payrolls: 99,000 (actual) vs. 143,000 (estimate)
October unemployment: 3.9% (actual) vs. 3.8% (estimate)
October average hourly earnings: +0.2% (actual) vs. +0.3% (estimate)
October ISM services: 51.8 (actual) vs. 53.0 (estimate)
Happy trading!
Tom