
EB Daily Market Report - Thursday, November 9, 2023
Weekend Travel
I'll be heading out of town on Friday and won't be returning until late Sunday night. This could result in delays in weekend reports and possibly the Weekly Market Report. John Hopkins will likely provide a brief market update tomorrow. I'll be checking in on the market throughout the day and if there's something earth-shattering that develops, I'll certainly issue a report of some sort. But I really am not expecting anything crazy at this point with the Volatility Index ($VIX) now in the 14s.
ChartLists
I am continually working on updating the ChartLists. I should have a couple more updated before I head out of town. The one that will require a lot of time and likely won't be updated until next week is the Raised Guidance ChartList (RGCL). I'll let you know as soon as each ChartList is updated.
Executive Market Summary
- Futures were mixed overnight, but all our major indices did open in positive territory
- Again, relative weakness has haunted small (IWM, -0.18%) and mid caps (MDY, -0.13%) after the opening bell
- Energy (XLE, +0.73%) is today's top-performing sector as crude oil ($WTIC, +2.22%) has jumped slightly above $77 per barrel
- Notably, industrials (XLI, +0.52%) are next in terms of sector performance; the XLI loves the month of November historically
- Meanwhile, defensive groups mostly lag; health care (XLV, -1.79%) and real estate (XLRE, -0.55%) are both losing ground
- The 10-year treasury yield ($TNX) is up 3 basis points to 4.55% and near key yield support at 4.50%
- Volatility ($VIX) has tumbled in recent days to its lowest level since mid-September, though it is up slightly today
- Walt Disney (DIS, +7.43%) is clearing short-term price resistance at 86-87 after reporting better-than-expected quarterly results after the bell on Wednesday
Market Outlook
It's hard to fault our major indices for pausing at current levels. We've seen a huge run of the October low and full stochastics are now at 97 on the S&P 500, which represents an overbought reading. The daily RSI has touched 60, the highest level since the correction began in July. RSI readings ABOVE 60 are usually found during uptrends, not downtrends, so a further push higher in the RSI would be yet another bullish technical development:
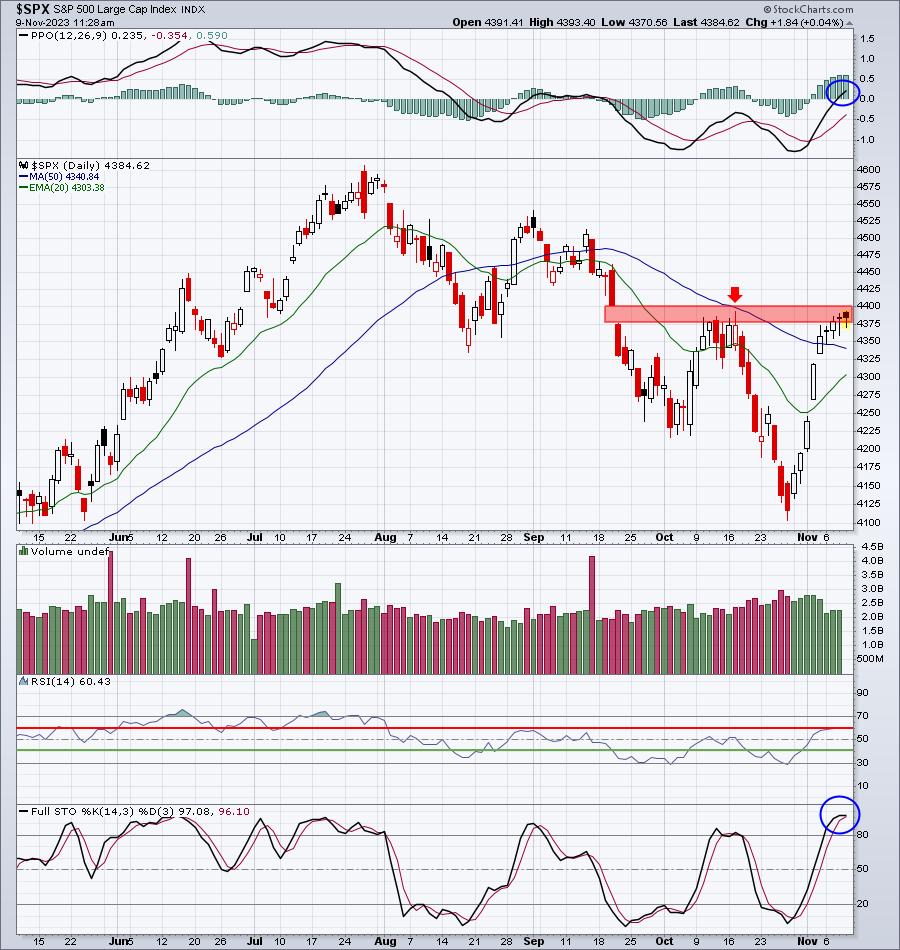
We haven't broken out above the key resistance zone (red-shaded area), but technical conditions have definitely improved. Let's start with the stochastic, which used to be on my default daily charts. It's simply a measure of overbought vs. oversold. If you look at the chart, you'll see that most bottoms form with stochastic below 20. Below 10 and near zero is extremely oversold. To the upside, however, we can run into short-term difficulties when the RSI pushes above 90 and especially if it nears 100. The current level of 97 is a short-term cause for concern as it's occurring simultaneously with price hitting a resistance zone and a 60-minute negative divergence printing (featured in yesterday's DMR).
RSI is another measure of overbought vs. oversold. During uptrends, the RSI tends to print beneath 40 support and 70+ resistance. During downtrends, the RSI tends to print 30 or lower (support) vs. 60 resistance. We're at 60, so the RSI's next big move will provide a clue as to whether we've confirmed a more intermediate- to long-term uptrend or if we remain in the recent downtrend.
The PPO has cleared its centerline and so momentum is now leaning to the bulls' case of the secular bull market resuming. We want to see other signals corroborate, with the most important signal being the actual price breakout above the red-shaded zone. The others will likely follow suit.
Sector/Industry Focus
This morning on our Trading Places Live, I discussed cryptocurrencies, so if this asset class interests you, you might want to listen to this morning's recording on YouTube. I began my discussion at roughly the 26-27 minute mark, if I recall correctly. Bitcoin ($BTCUSD) has been ripping higher and others have been following to the upside as well. But when I plot bitcoin on an RRG chart as the benchmark, it's clear to me that the other cryptos have been lagging badly in 2023. Check out this MONTHLY RRG chart, using 5-month "tails", which simply charts each crypto's relative path over the past 5 months:
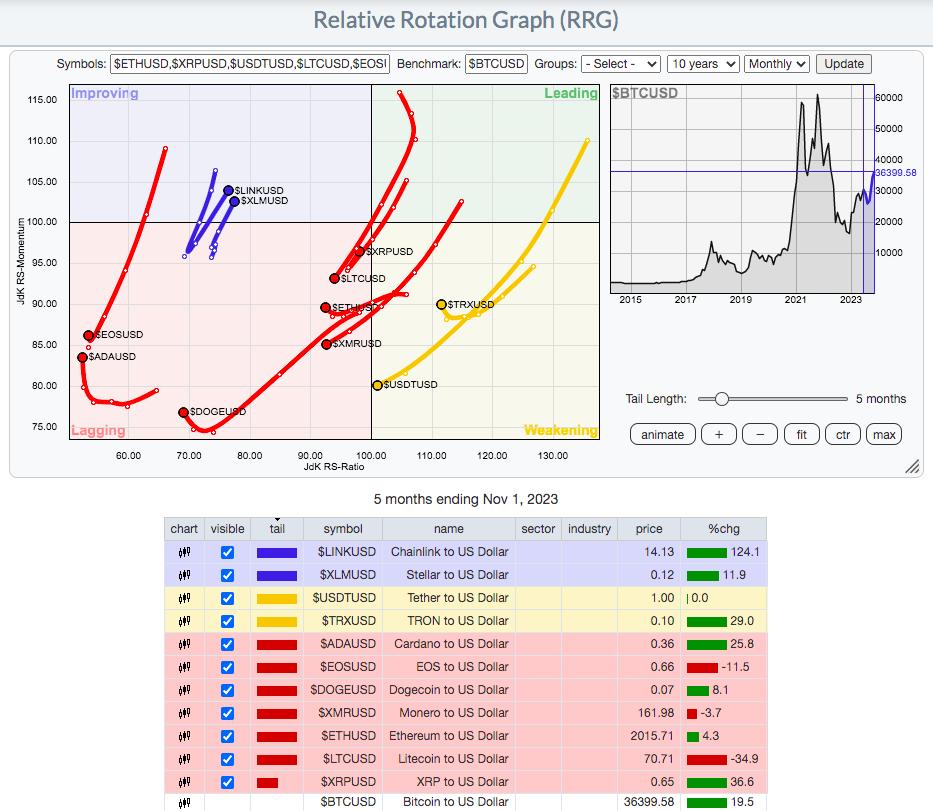
You can see that nearly every crypto is seeing its long-term relative path moving in southwesterly fashion, which is relative bearishness. We do have a couple of relative winners during this recent surge in nearly all cryptos. Let's check out this same RRG, only concentrate on an hourly basis over the past 3 weeks:
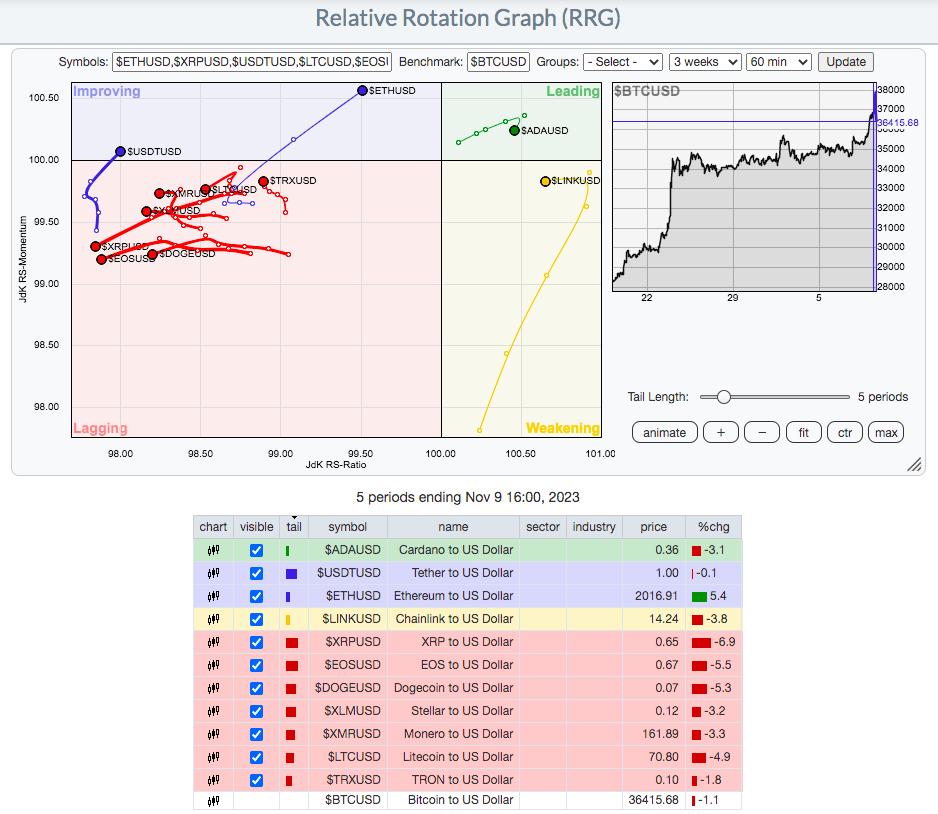
Etherium ($ETHUSD) and Cardano ($ADAUSD) have shown recent relative strength, but their long-term relative charts have clearly been downtrending:
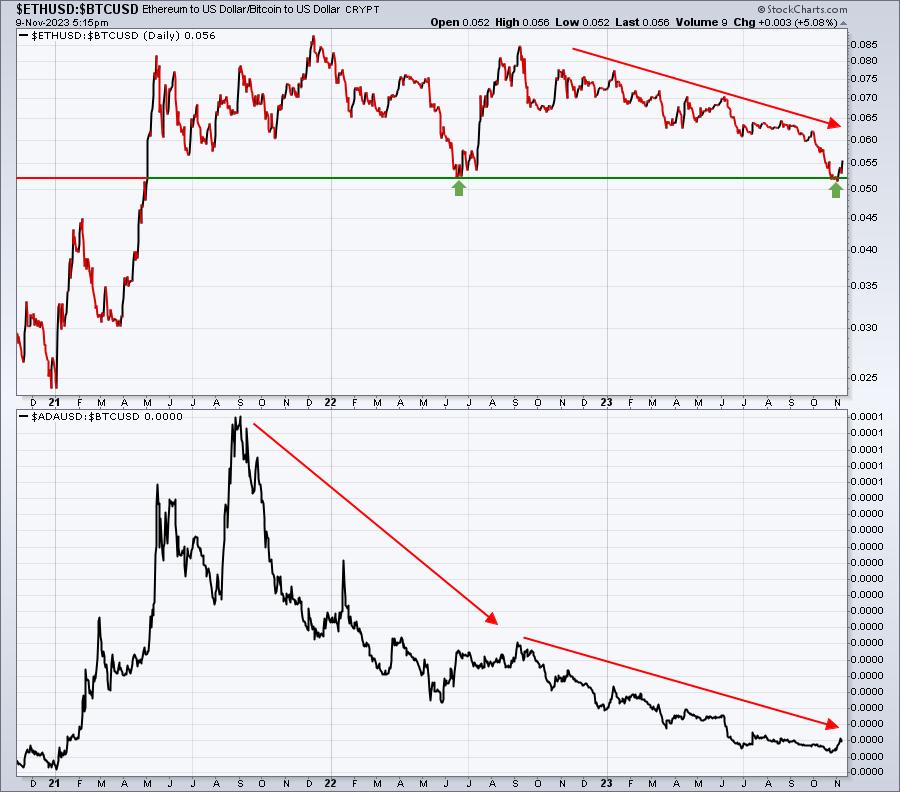
Perhaps you can make an argument for etherium if its relative support level holds, but if that breaks down, bitcoin again becomes the obvious choice in this space. My interpretation of all of this is that, if you're going to trade cryptos, bitcoin ($BTCUSD) is likely your best choice. Just my opinion based on relative price action. I don't trade cryptos or claim to be a crypto expert. Rather, it's simply my conclusion currently based on absolute and relative price action.
ChartLists/Strategies
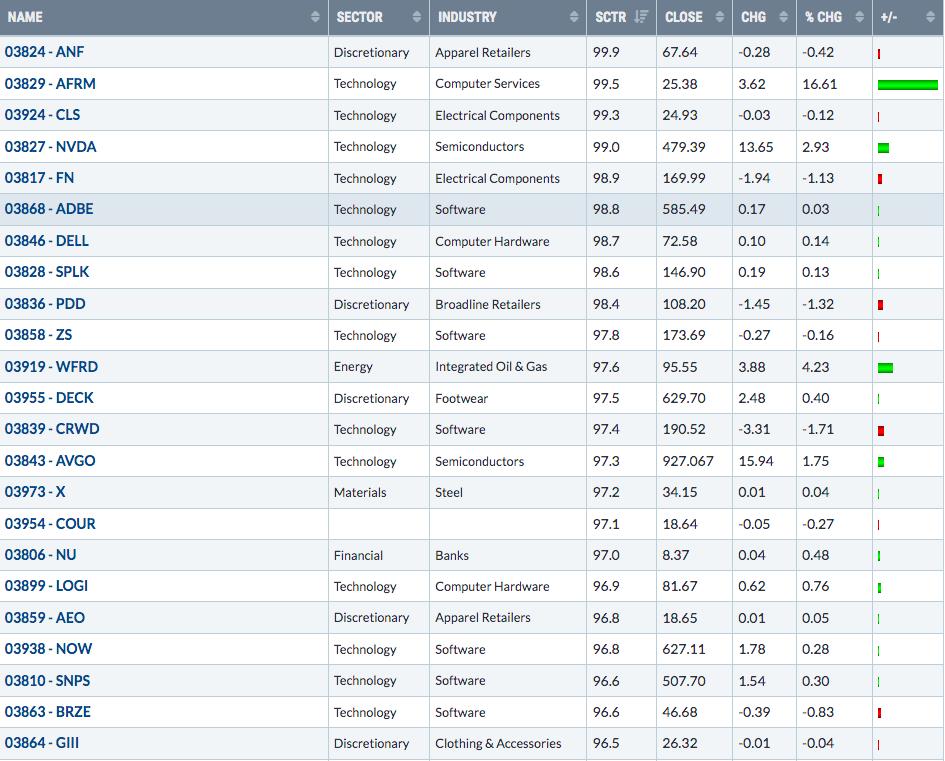
Until the stock market proves otherwise, I think we should respect the current price resistance, negative divergences, and overbought oscillators. Therefore, I'd be looking to set up a Watch List for strong stocks and where a pullback might be buyable. When I send out next Strong Earnings ChartList (SECL), which will be updated through Monday's earnings reports, that's the list I'd start with. Perhaps sort this ChartList by SCTR to help identify the strongest stocks. Then look for recent price lows, key moving averages, gap support, etc. and plan your upcoming strategy. Using the last SECL, here are the top SCTR stocks on this list:
Earnings Reports
Here are the key earnings reports for the next two days, featuring stocks with market caps of more than $10 billion. I also include notable companies with market caps below $10 billion. Finally, any portfolio stocks that will be reporting results are highlighted in BOLD. If you decide to hold a stock into earnings, please understand the significant short-term risk that you are taking. Please be sure to check for earnings dates for any companies that you own or are considering owning.
Thursday, November 9:
AZN, SONY, PBR, BDX, BN, TDG, LI, TTD, BBD, MTD, RCI, WPM, MT, ILMN, HOLX, NWS, RBA, WYNN, USFD, U, WRK, TPR, ONTO, CPRI, MTSI, DDS, DV, FLO, DOCS, PLUG, YETI, VERX, SYNA, VRRM, WB, ALRM, NOMD, DNUT, UTZ, HBI, VZIO, NVTS
Friday, November 10:
STNE
Economic Reports
Initial jobless claims: 217,000 (actual) vs. 220,000 (estimate)
Happy trading!
Tom