
EB Weekly Market Report - Monday, November 13, 2023
ChartLists Updated
I updated the following ChartLists over the weekend:
- Strong Earnings (SECL)
- Strong Future Earnings (SFECL)
- Short Squeeze (SSCL)
- Earnings AD (EADCL)
These ChartLists should be updated on our website this morning. The SECL was updated through last Friday's earnings reports, so it is now completely up to date. I will work on updating the Strong AD ChartList (SADCL), Raised Guidance ChartList (RGCL), and the Bullish Trifecta ChartList (BTCL) this week.
Abbreviated Report
Because I'm traveling all day today, I am providing an abbreviated Weekly Market Report today, covering mostly last week's action and the Big Picture.
Weekly Market Recap
Major Indices
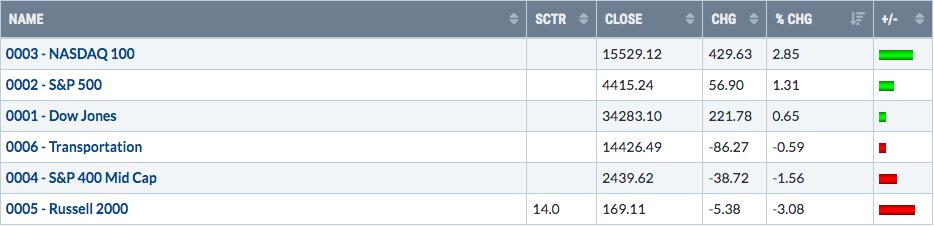
Last week, I discussed the IWM in some detail, highlighting the early-November improvement in absolute strength, but cautioning that we had yet to see the IWM outperform the QQQ in relative terms. Accordingly, I maintained that the QQQ was the better bet - for now. Well, check out last week's performance of the major indices. The NASDAQ 100, or the QQQ, was the big winner, sustaining its strength from the first week of November. The Russell 2000, or IWM? Not so much. It was the worst-performing of our major indices, underperforming the QQQ by nearly 6 full percentage points. That's UGLY relative performance, so the same beat goes on. Yes, history tells us to be on the lookout for small cap outperformance this time of year (November and December), but we're halfway through November, and IWM relative strength is nowhere to be found - at least not yet. I'll keep watching.
Sectors
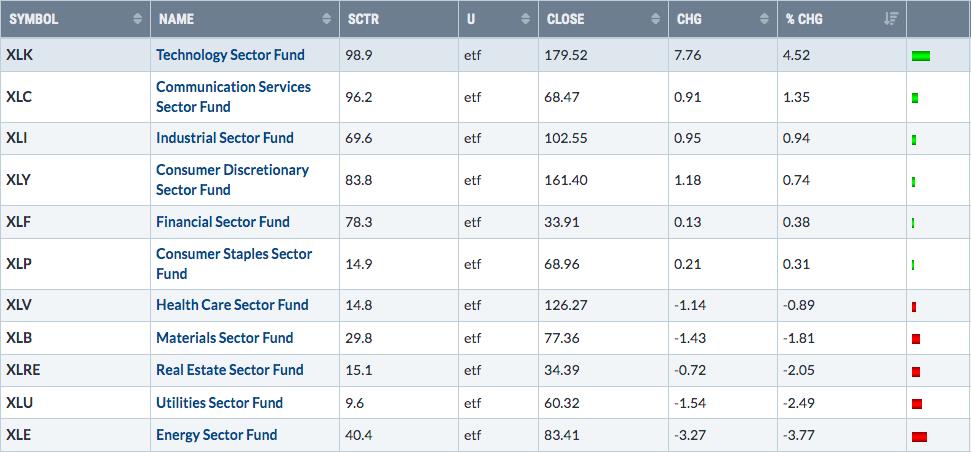
And if you're wondering why the NASDAQ 100 performed so well last week, you really don't need to look at much else than the Weekly Sector Summary above. The 5 aggressive groups were in spots 1-5 last week, which is very bullish, with defensive areas, materials, and energy all lagging badly.
Are you worried about higher interest rates? How about higher inflation? If so, let me just say that if the stock market was preparing for either or both, technology would be one of the worst sectors, if not THE worst. The S&P 500's rotation among sectors is telling us a very clear and direct story. We need to remain bullish and continue to ignore all the negative news every day.
Technology (XLK) is near its all-time high and, if you blink, you might miss the next all-time high, which very well could be today or this week:
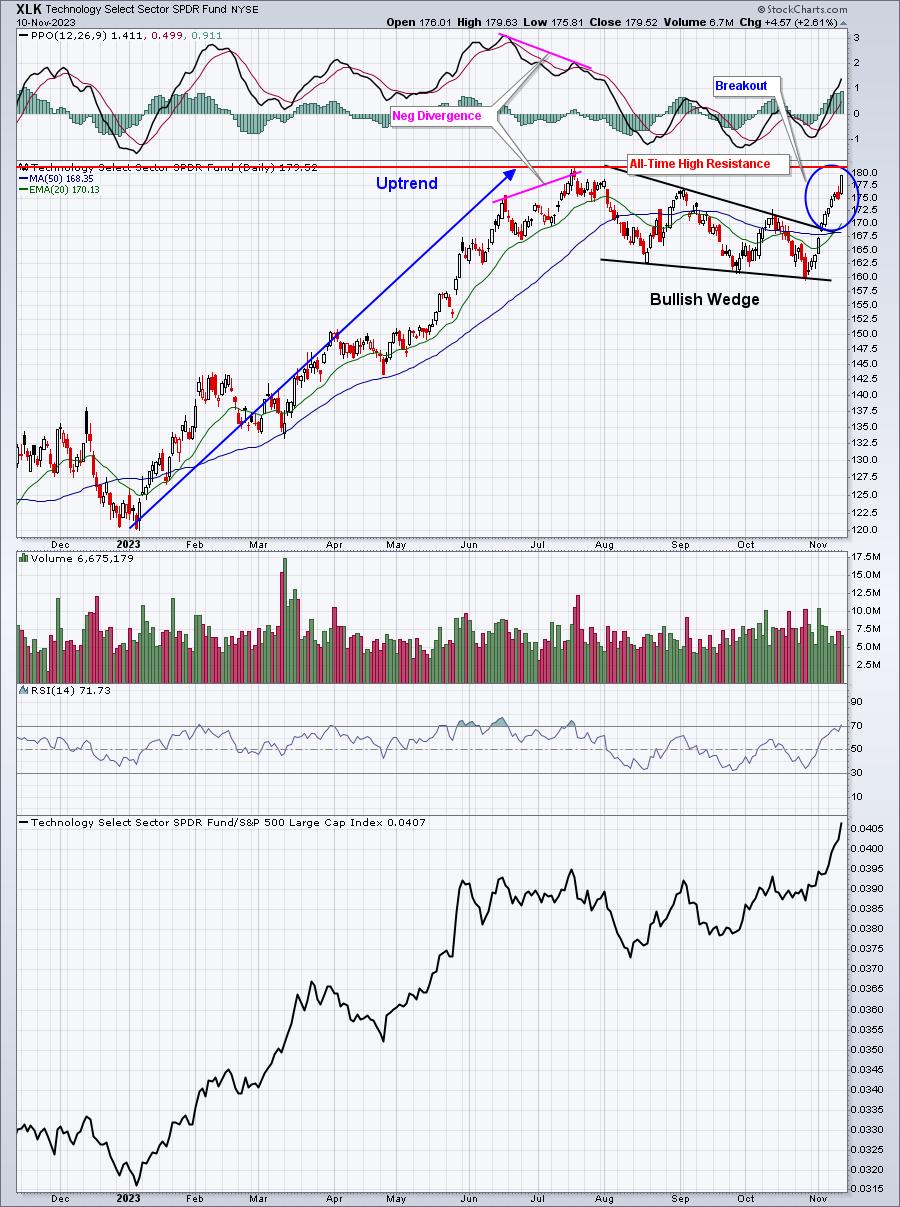
Now check out that bottom panel, which reflects technology's relative strength vs. the benchmark S&P 500. Seriously, could this market be sending us a more bullish signal?
Top 10 Industries Last Week
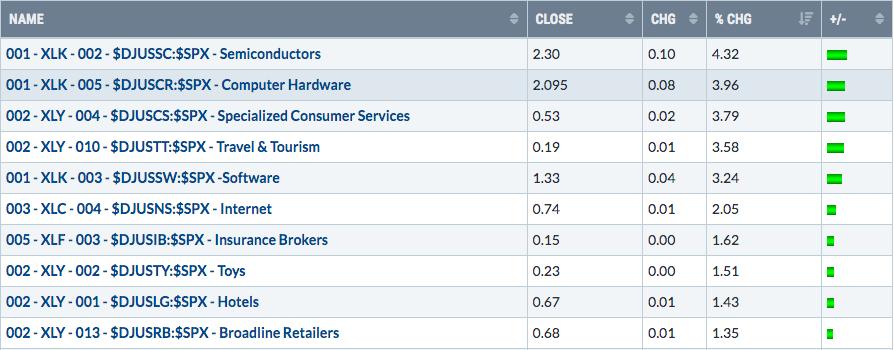
While I'm only showing the Top 10 industry groups, I can tell you that the top 24 industry group last week were in one of the five aggressive sectors - technology (XLK), consumer discretionary (XLY), communication services (XLC), industrials (XLI), and financials (XLF). I can't recall seeing this level of bullishness for awhile.
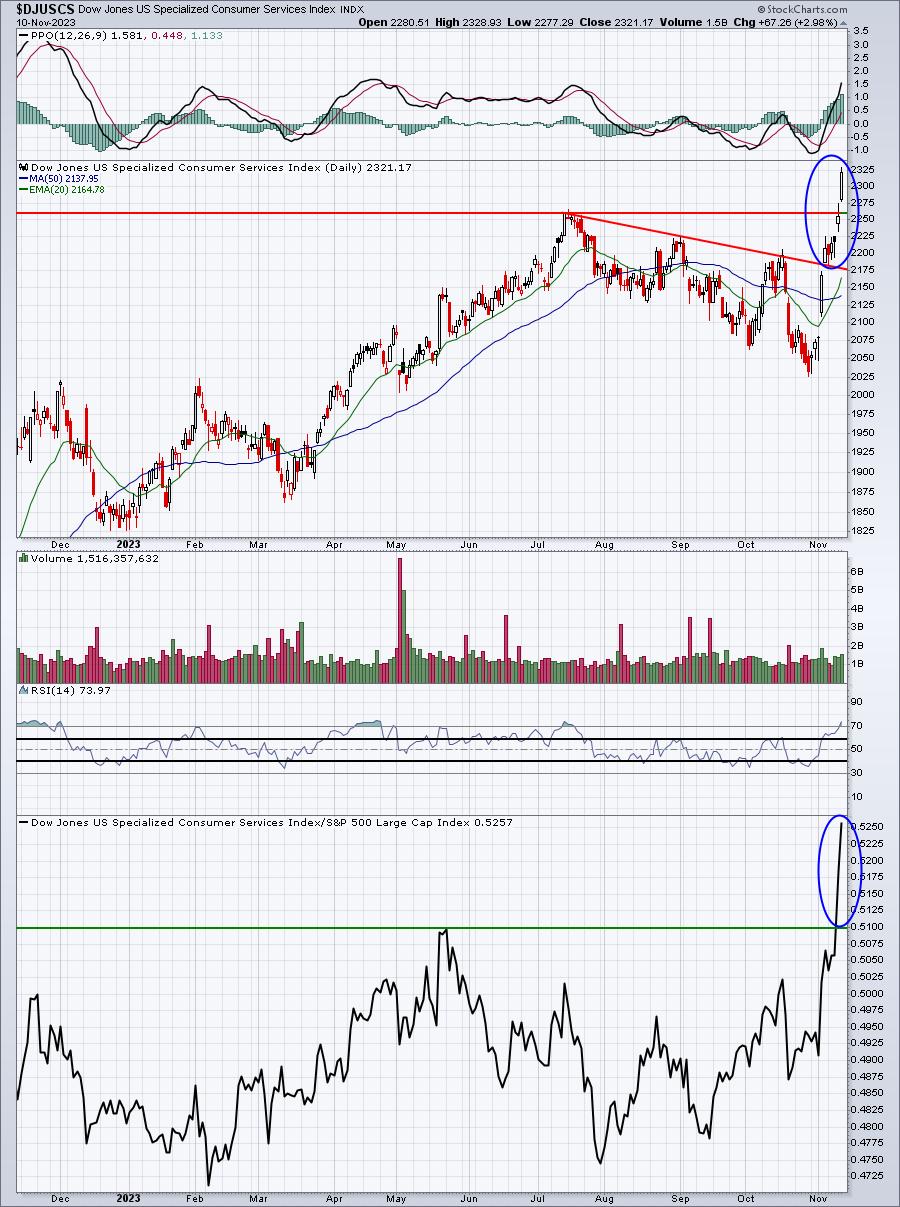
I know many market pundits keep talking about the Magnificent 7 and how that's the only area that's driving the market higher. While those large cap heavyweights are definitely lifting the market higher, there are plenty of other areas of the market doing quite well right now. For example, have you seen the massive move higher in the specialized consumer service ($DJUSCS) area?
Bottom 10 Industries Last Week
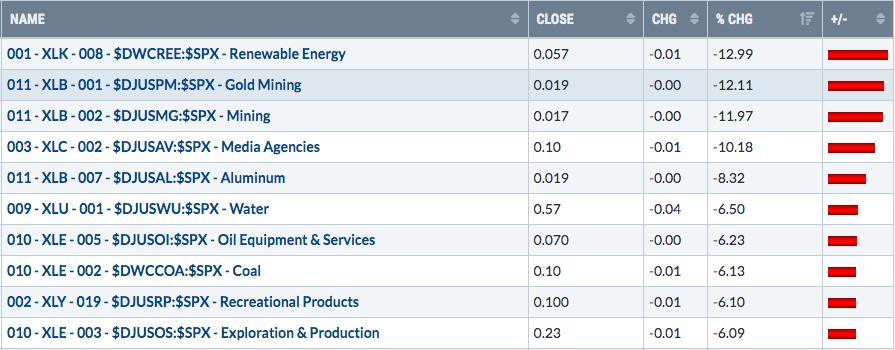
I spent time last week discussing gold miners ($DJUSPM) and gold ($GOLD) in general. I said that it's not where you want your money when the Volatility Index ($VIX) is in decline. Well, the VIX is in decline and check out the Top 10 WORST-performing industry groups. The DJUSPM was #2 out of 104 last week. The group was absolutely horrific. I've said for years to stay away from gold and I'll continue saying it. It's worth a trade when the stock market is in a cyclical bear market or correction, but when the S&P 500 is trending higher - like it is now - "hedging with gold" is the equivalent to "losing with gold".
Since I already discussed gold, let's move on to aluminum ($DJUSAL). Aluminum prices contributed to the huge spike in inflation over the past few years, but I want you to look at aluminum now and tell me if you see any inflationary concerns here now:
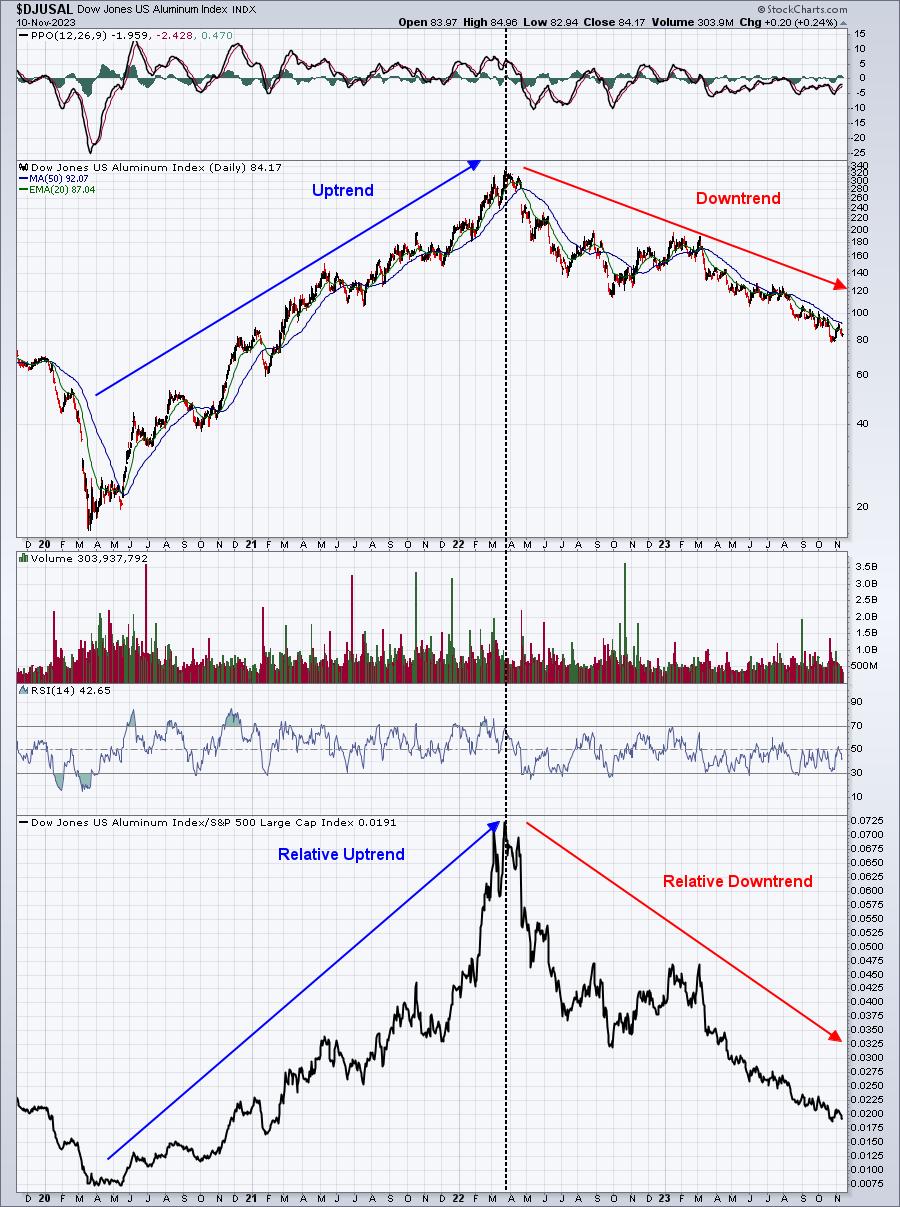
Yeah, I don't either.
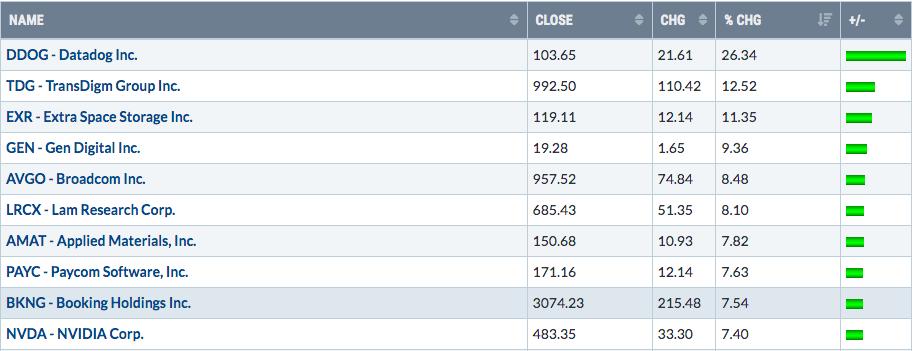
Top 10 Stocks - S&P 500/NASDAQ 100
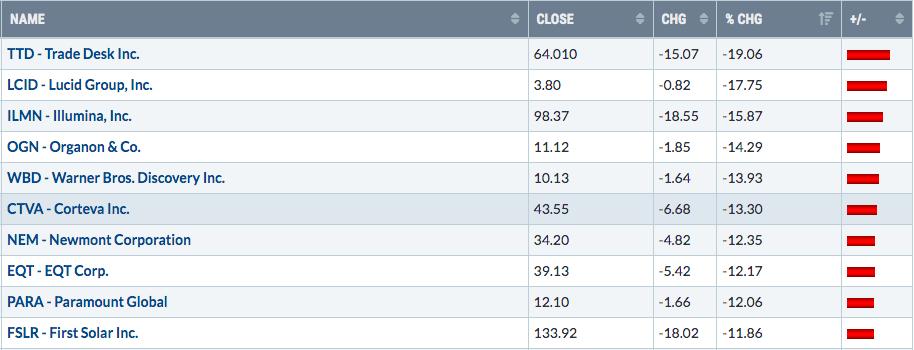
Bottom 10 Stocks - S&P 500/NASDAQ 100
Big Picture
Moving above 4400 on the S&P 500 last week was bullish technically from a short-term or even intermediate-term perspective, but that chart doesn't provide us the ability to step back and REALLY look at the long-term picture. This one does:
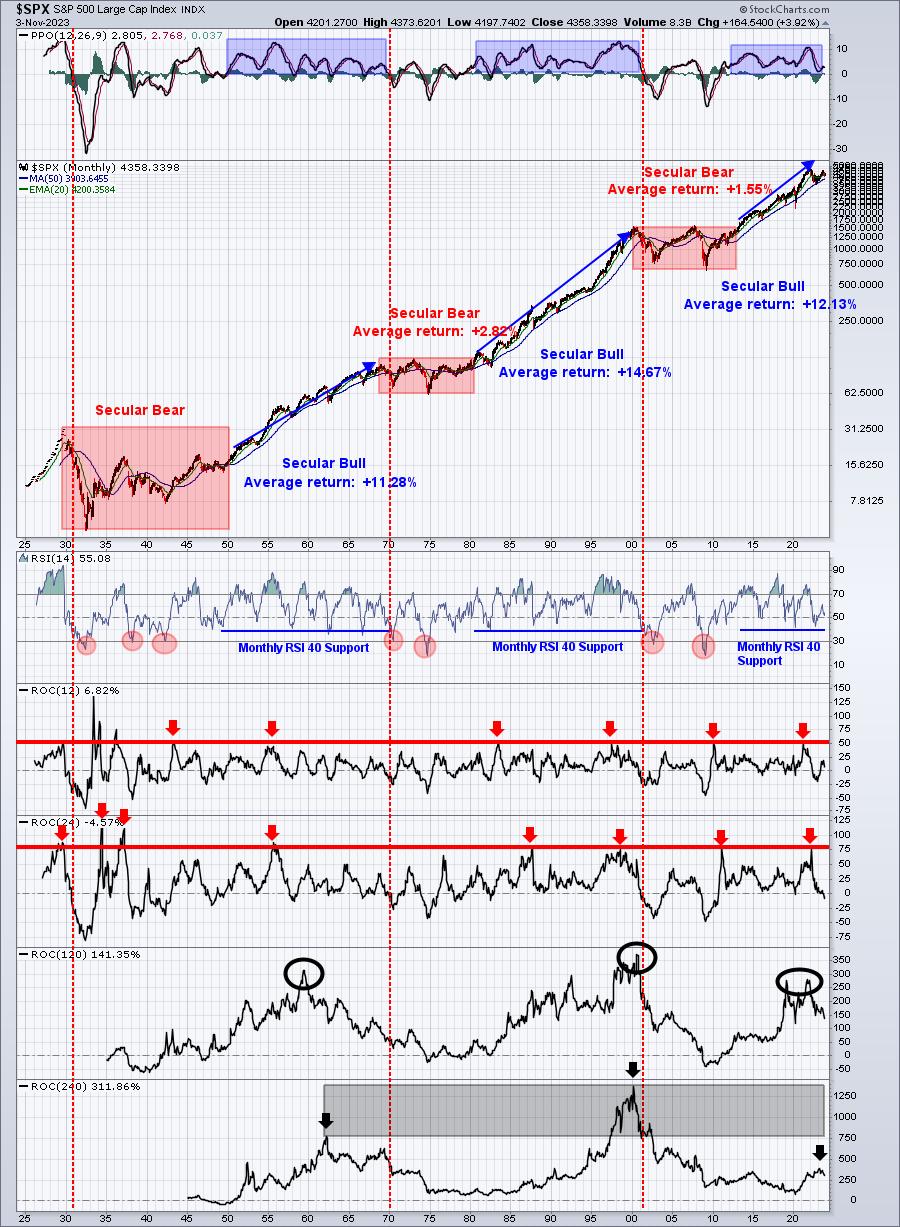
It's difficult for me to zoom OUT, look at this chart, and not think bullish thoughts. Long-term secular bear markets require a negative monthly PPO and a monthly RSI below 30. A secular bear market has NEVER formed without those two ingredients. The monthly PPO is now turning higher and comfortably in positive territory. The monthly RSI is back up to 55, nowhere near the necessary RSI level below 40. This is a very important, reassuring chart that this secular BULL market lives on. Traders really need to stop being so obsessed with trying to call bear markets based on news and/or politics they don't like. There is a COMPLETE disconnect between your perception of news and political events and the direction of the stock market. That is proven over time. Please stop trying to dissect the market based on news. Your retirement account will thank you later.
Sentiment
I don't want to spend much time today on sentiment. However, a good question came in from a member. The 5-day moving average of the equity only put call ratio ($CPCE) spiked again last week, so the question was (paraphrased) "what do I make of this?" I make nothing of it. The only reason we saw this moving average of the CPCE spike was due to a MASSIVE equity put buy late on Wednesday. We've seen this before. It represents hedge funds buying large positions in puts of key large cap names like AAPL, MSFT, TSLA, AMZN, GOOGL, NVDA, AMD, etc. I use my CPCE readings to get a pulse of what RETAIL TRADERS are doing with options. These large equity put contracts are skewing the information that I like to use for sentiment. Therefore, I IGNORE these crazy readings and adjust for them. I do not show any issues currently with the CPCE. Sentiment, in my view, supports higher equity prices ahead.
Looking Ahead
I'll skip most of this section for today in an effort to get this WMR out quicker on a day of travel for me.
Historical Data
Each week, I'll provide you the average annualized returns for each calendar day and by index. Here are the historical numbers for this week (We will be providing more visual images of seasonality in future reports, but for now I'm trying to avoid some of the scrolling issues that Excel images were causing):
S&P 500
- November 13: +27.80%
- November 14: -1.18%
- November 15: -8.46%
- November 16: +11.88%
- November 17: +0.12%
NASDAQ
- November 13: +77.77%
- November 14: -14.82%
- November 15: -16.48%
- November 16: -29.94%
- November 17: -13.21%
Russell 2000
- November 13: +141.18%
- November 14: -58.35%
- November 15: -2.00%
- November 16: -3.91%
- November 17: -24.18%
The S&P 500 data dates back to 1950, while the NASDAQ and Russell 2000 information date back to 1971 and 1987, respectively.
We've now begun the most bullish period of the calendar year. The close on October 27th through the close on January 18th is THE ABSOLUTE BEST TIME OF THE YEAR FOR U.S. EQUITIES - HISTORICALLY SPEAKING. We'll see a resumption of historical Q4 bullishness over the Thanksgiving holidays. Most of November and December, however, is bullish.
Feedback
If you'd like to share your thoughts on our Weekly Market Report, positive or negative, you can reach us at "[email protected]".
Happy trading!
Tom