
EB Daily Market Report - Wednesday, November 15, 2023
Executive Market Summary
- Futures were higher overnight and for the 2nd consecutive day, we saw an inflation report coming in below expectations
- The October PPI headline number actually fell by 0.5%, its lowest drop in quite awhile
- October retail sales came in better than expected and I highlight this group (XRT) below in the Sector/Industry Focus
- Cryptocurrencies are on the move again today as bitcoin ($BTCUSD, +6.06%) leads other cryptos higher
- Commodities are mostly mixed, with crude oil ($WTIC, -2.24%) tumbling back to $76.50 per barrel
- The 10-year treasury yield ($TNX) rebounded 10 basis points to 4.54%, effectively testing the neckline of a bearish head & shoulders breakdown
- Consumer staples (XLP, +0.86%) and financials (XLF, +0.74%) are today's best-performing sectors as value stocks see more rotation
- 9 of 11 sectors are higher today, with only utilities (XLU, -0.15%) and energy (XLE, -0.04%) in negative territory
- Target Corp (TGT, +18.42%) blew away its earnings estimates and powered forward to the top of the S&P 500 leaderboard
Market Outlook
The XLY:XLP ratio has been featured many times over the years, because I believe it provides us one of the very best signals as to whether Wall Street is in a "risk on" or "risk off" mood. That determination helps us define whether should be expecting bullish action ahead or bearish action. Here's what this chart looks like from a longer-term perspective:
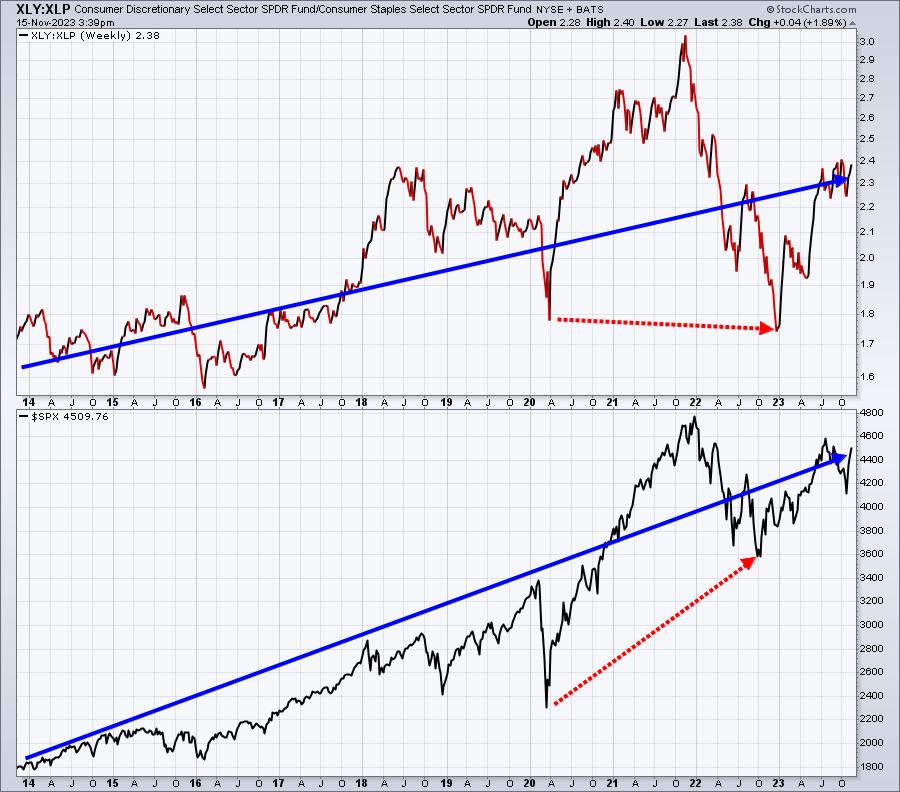
I believe the direction of the XLY:XLP completely supports the secular bull market that's currently in play. The red-dotted directional lines do show that the two key lows in the S&P 500 were miles apart, while the XLY:XLP ratio actually dipped slightly lower in 2022. However, the rapid rally in 2023 appears to have corrected that issue and now we see both lines moving up nicely together.
Sector/Industry Focus
The October retail sales report was released this morning and it came in better than expected. As I look at the well-diversified retail ETF (XRT), I see a group that's broken out above key absolute price resistance:
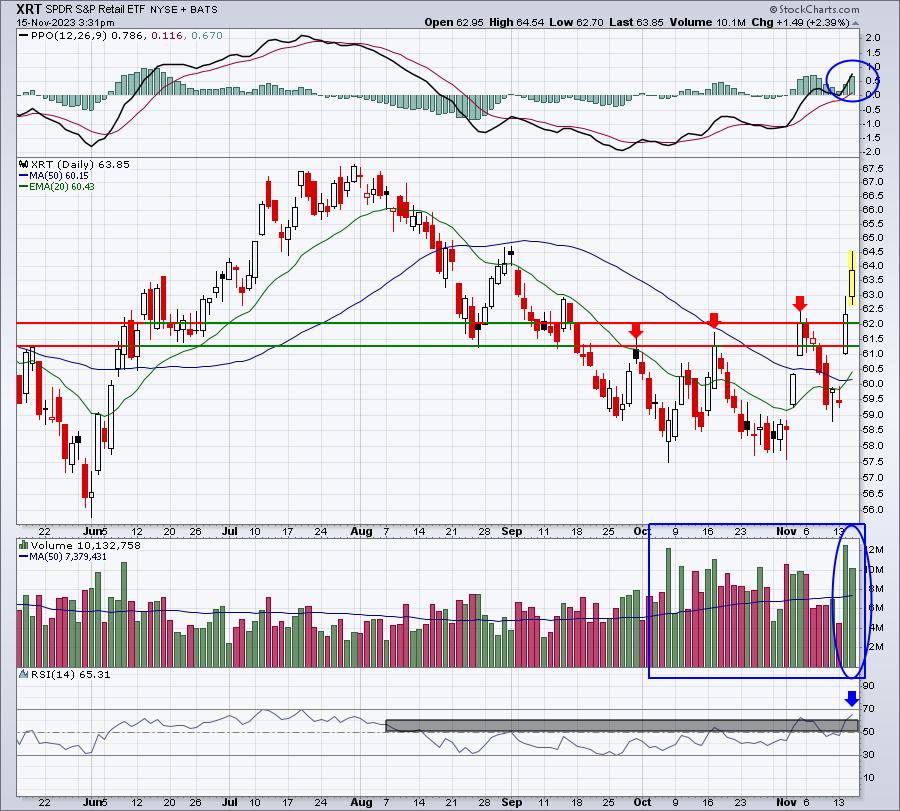
Retail looks better technically today than it has at any point over the last 3-4 months. The blue rectangle around the volume shows heavy volume accompanying the sideways price action for the past 5-6 weeks. And the last two days, volume has been exceptionally strong to accompany the price breakout. It certainly appears to me that the XRT has seen a significant change of character on its chart, turning from neutral at best, to a much more bullish technical view now.
ChartLists/Strategies
I spent a great deal of time in today's Live Trading Room discussing our various ChartLists and how they're filtered and how we present them. If you haven't spent much time looking at these ChartLists for potential trading candidates, then I don't believe you're using our service to its fullest capability. Be sure to listen in to the first 30-45 minutes of today's Live Trading Room recording to gain valuable insight into our service at EB.
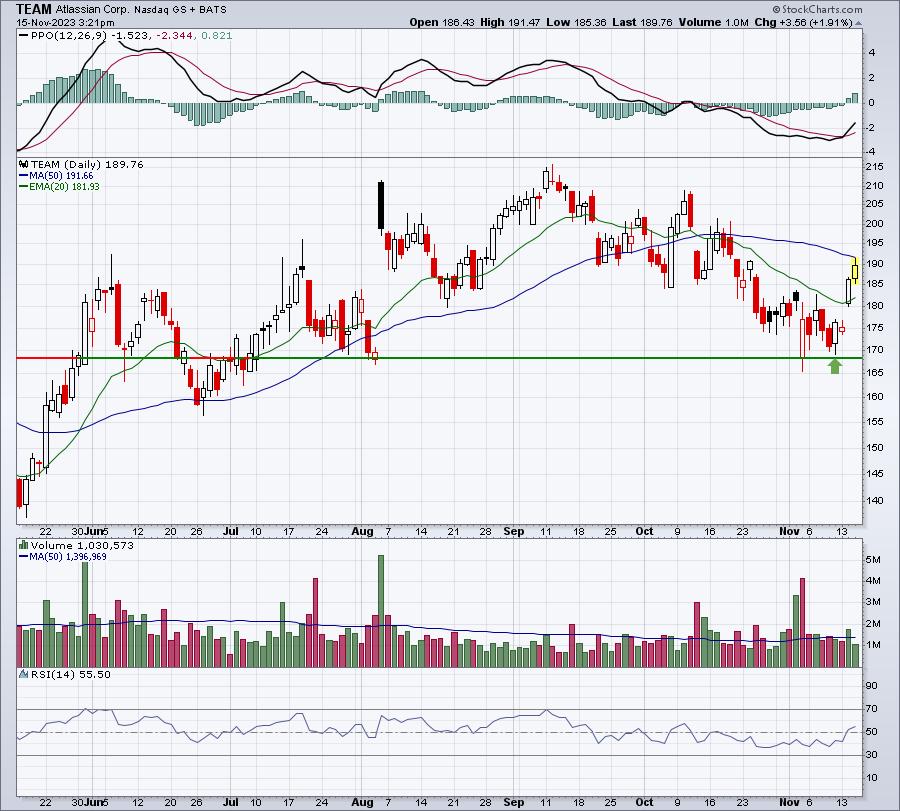
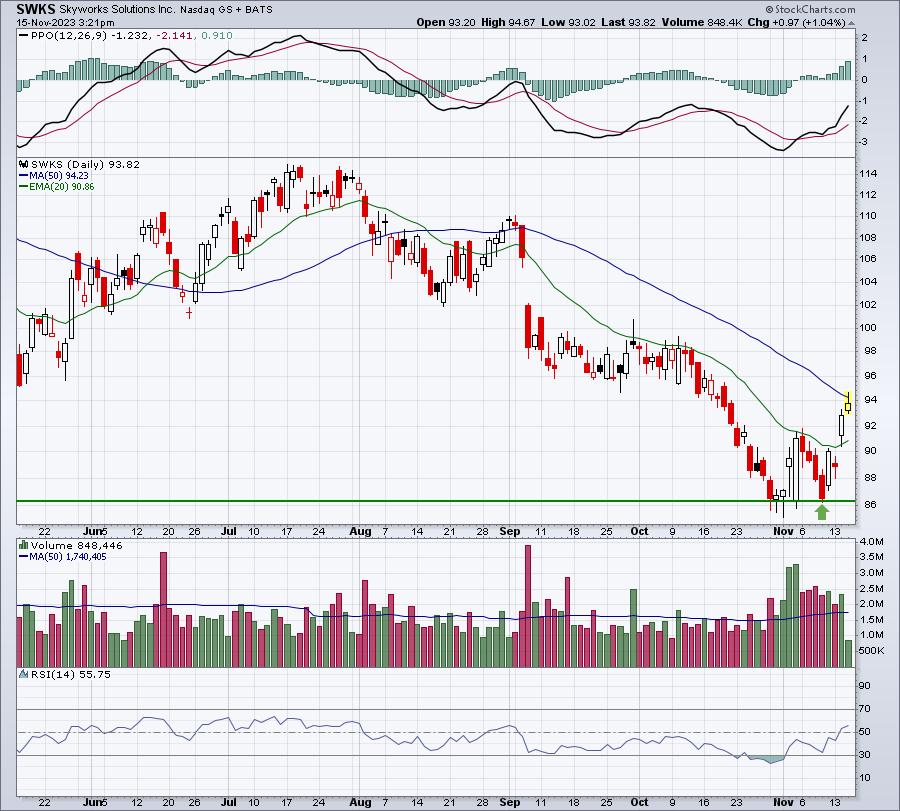
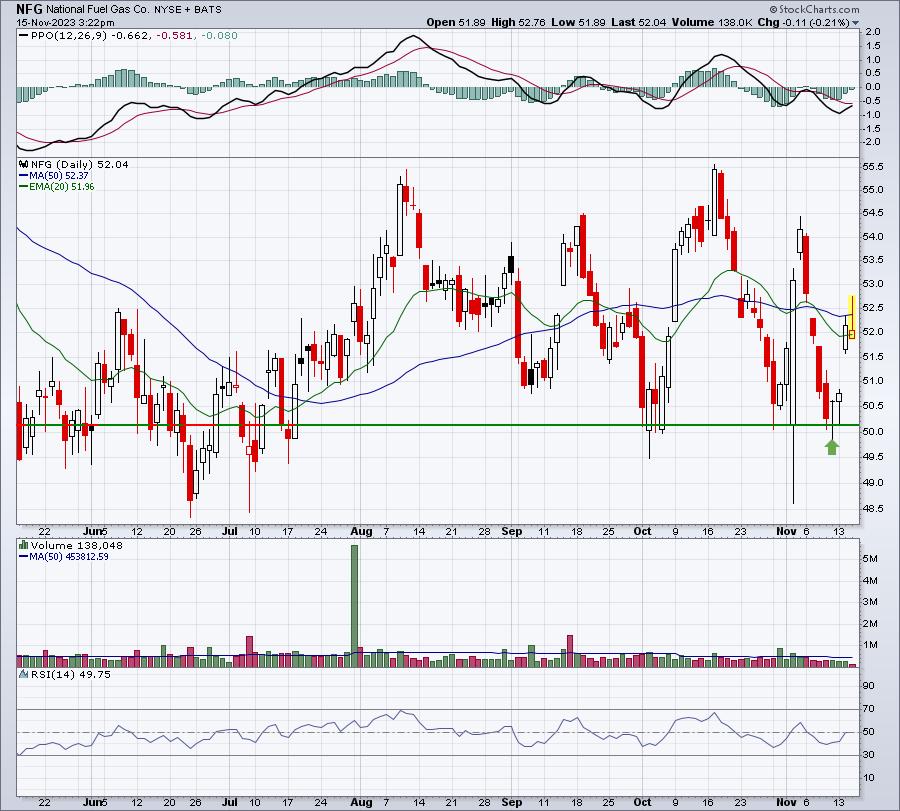
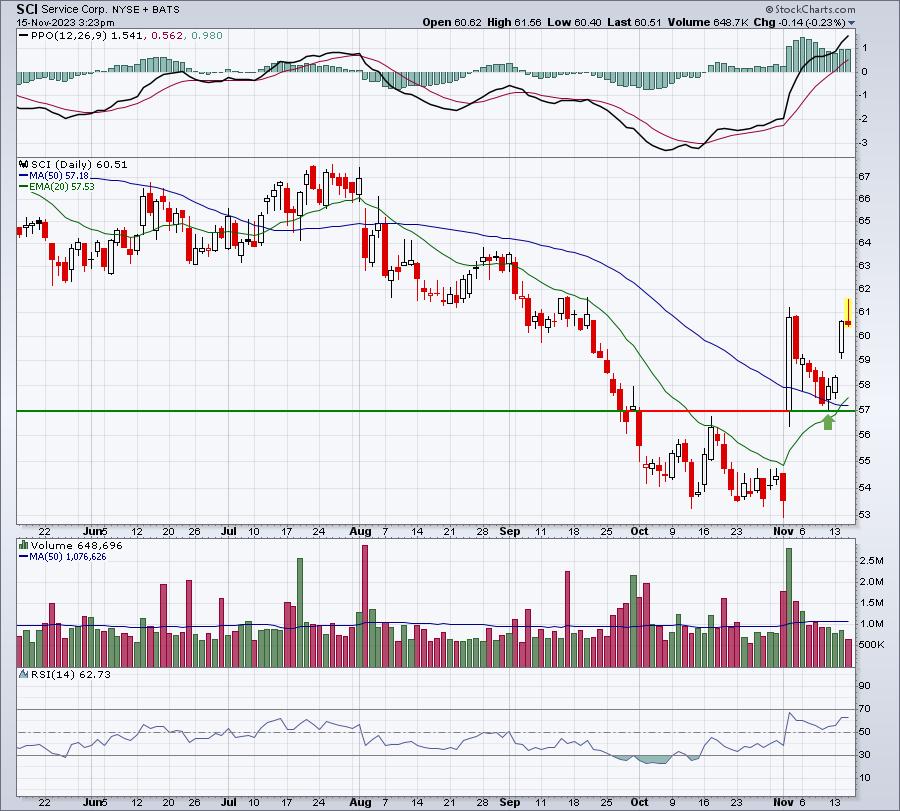
One ChartList that I discussed in pretty good detail was our Earnings AD ChartList (EADCL). I explained that this ChartList provides all of our members an organized list of companies that traded extremely well the day AFTER earnings were reported. In order to get on this list, they must (1) be above $5, (2) trade AT LEAST 200,000 shares per day, and most importantly (3) have an "opening price to closing price" gain of AT LEAST 5%. This ChartList is in order of this intraday gain percentage. The key is having patience to wait on stocks on this list to test the TOP of gap support. This tends to be the best price support on the chart. Check out two stocks on this list that bounced beautifully off this gap support:
TEAM:
SWKS:
NFG:
SCI:
SMG:
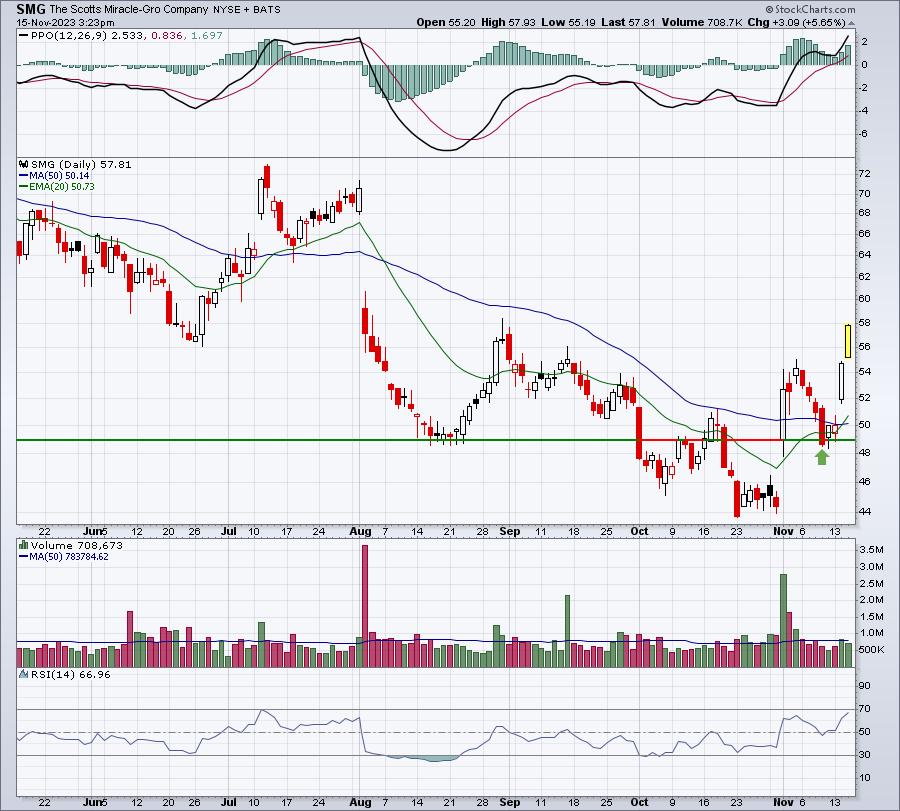
The 2 things to remember about the EADCL is that (1) we're highlighting the price point at which buyers came in in droves just after earnings reports were released, and (2) by entering at gap support, you can keep stop losses fairly tight, while looking for solid short-term gains. We expect buyers to reappear at these gap support levels.
Earnings Reports
Here are the key earnings reports for the next two days, featuring stocks with market caps of more than $10 billion. I also include notable companies with market caps below $10 billion. Finally, any portfolio stocks that will be reporting results are highlighted in BOLD. If you decide to hold a stock into earnings, please understand the significant short-term risk that you are taking. Please be sure to check for earnings dates for any companies that you own or are considering owning.
Wednesday, November 15:
CSCO, TJX, PANW, TGT, JD, SQM, XPEV, TTEK, CTLT, AAP, HI, KLIC, SONO
Thursday, November 16:
WMT, BABA, AMAT, NTES, CPRT, ROST, WMG, ZTO, NICE, WSM, DLB, GLOB, BBWI, GPS, M
Economic Reports
October PPI: -0.5% (actual) vs. +0.1% (estimate)
October Core PPI: +0.0% (actual) vs. +0.3% (estimate)
October retail sales: -0.1% (actual) vs. -0.3% (estimate)
October retail sales less autos: +0.1% (actual) vs. -0.1% (estimate)
November empire state manufacturing index: 9.1 (actual) vs. -3.0 (estimate)
Happy trading!
Tom