
EB Daily Market Report - Thursday, November 16, 2023
Executive Market Summary
- Futures were lower overnight and we gapped down at the opening bell on all of our major indices
- The small caps (IWM, -1.90%) and mid caps (MDY, -1.28%) are the relative laggards today and it's not particularly close, reversing their relative gains over the past two sessions
- Commodities are mostly lower, especially crude oil ($WTIC, -4.64%), which has tumbled to $73 per share
- The 10-year treasury yield ($TNX) is down 6 basis points to 4.47% as the head & shoulders breakdown from Tuesday weighs
- Utilities (XLU, +0.65%) is today's best-performing sector as the group benefits from market weakness AND the drop in treasury yields
- Despite the selling today, the Volatility Index ($VIX, +0.56%) has barely budged higher; if this fear gauge remains low, any selling is likely to be very short-lived
- Cisco Systems (CSCO, -11.65%) is the worst-performing stock in both the Dow Jones and S&P 500, with Walmart (WMT, -7.51%) second on both indices; Wall Street's reaction to both earnings reports obviously wasn't good
Market Outlook
Small caps (IWM) looked much better for about 25-26 hours. Since then, it's been more of the same with an inability to sustain early gains. Today has been consistent selling, from the opening bell to right now, as I publish this DMR. An uptrend is usually characterized by afternoon strength. We didn't see that yesterday. Also, for me, it's all about relative performance. Is the IWM a better trading alternative to the QQQ? For the past few months, the answer to that question has been NO. Look at this 10-day 15-minute chart to look at the absolute price action of the IWM and its relative performance vs. the QQQ in the bottom panel:
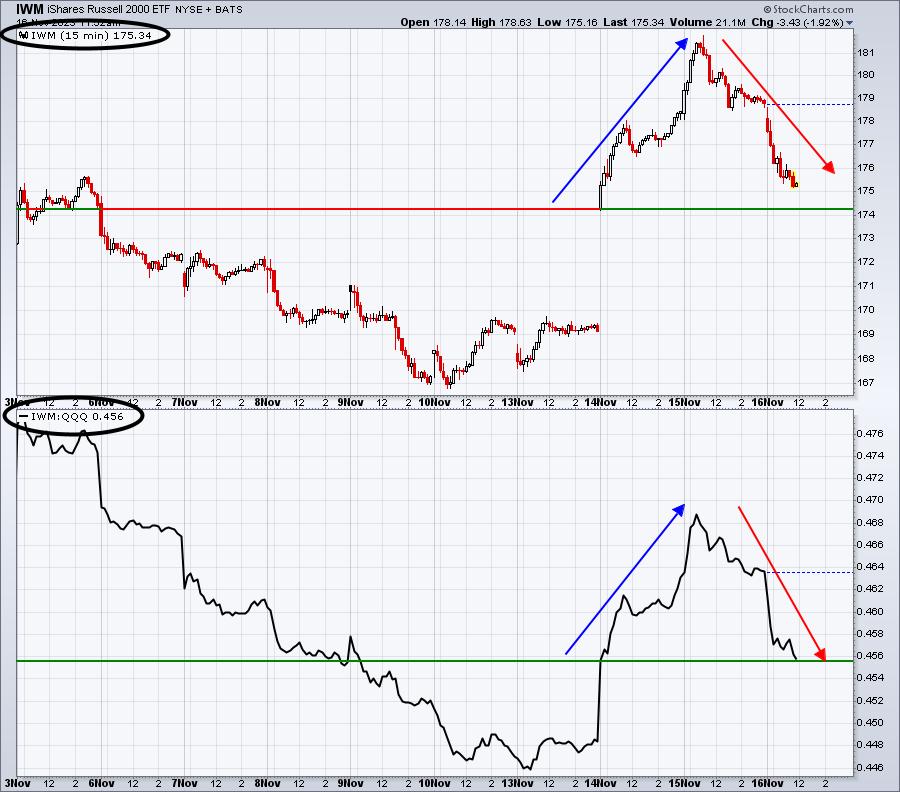
Listen, I remain bullish and I will certainly let you know if my opinion changes. But the above chart isn't about whether we're going up or down. Rather, it's trying to gauge the asset class preference of Wall Street. In other words, should we expect money to rotate towards small caps, with this group leading the next leg of the secular bull market - even if it's only for weeks?
Those red directional lines do not support the IWM outperforming. We're seeing intraday rotation back to the QQQ after a very brief bullish stint for the small cap IWM. The history of late has been for the IWM's relative strength to quickly revert to relative weakness. That's what we've seen since mid-morning on Wednesday. The IWM is rapidly falling toward its opening price on Tuesday after the tame CPI data. I really would like to see that level hold and afternoon strength return. If I don't see that, I cannot maintain my bullish thoughts about the IWM from Tuesday's action. Let's see how we finish today.
For those seeking leverage on the IWM (TNA tracks the IWM at a 3 to 1 clip), the best short-term level to consider it is at current price down to the IWM testing its gap support on the chart above. But I want to remind you that you should ONLY consider the TNA if you consider yourself to be an extreme risk taker. I use leverage from time to time, but I try to keep my risks relatively small. A breakdown on the IWM beneath that gap support would suggest much more caution near-term as the next level of key support on the IWM would be its rising 20-day EMA, currently at 171.47. Dropping to that level would likely send the TNA down 7% or so from its current price. Please be sure you understand the risks of trading these aggressive, leveraged products.
Sector/Industry Focus
Home construction ($DJUSHB) didn't exactly get the best news this morning as the November housing market index fell from 40 in October to 34 this month. But this is a perfect example of the disconnect between technical price action and news. The DJUSHB fell 20% during the correction. At least part of that decline could be attributed to what this industry was looking for in the months ahead. Beginning less than a month ago, however, this group absolutely exploded back to the upside, challenging the July high. I believe it's because Wall Street is looking ahead to a lower interest rate environment and buying the housing stocks accordingly:
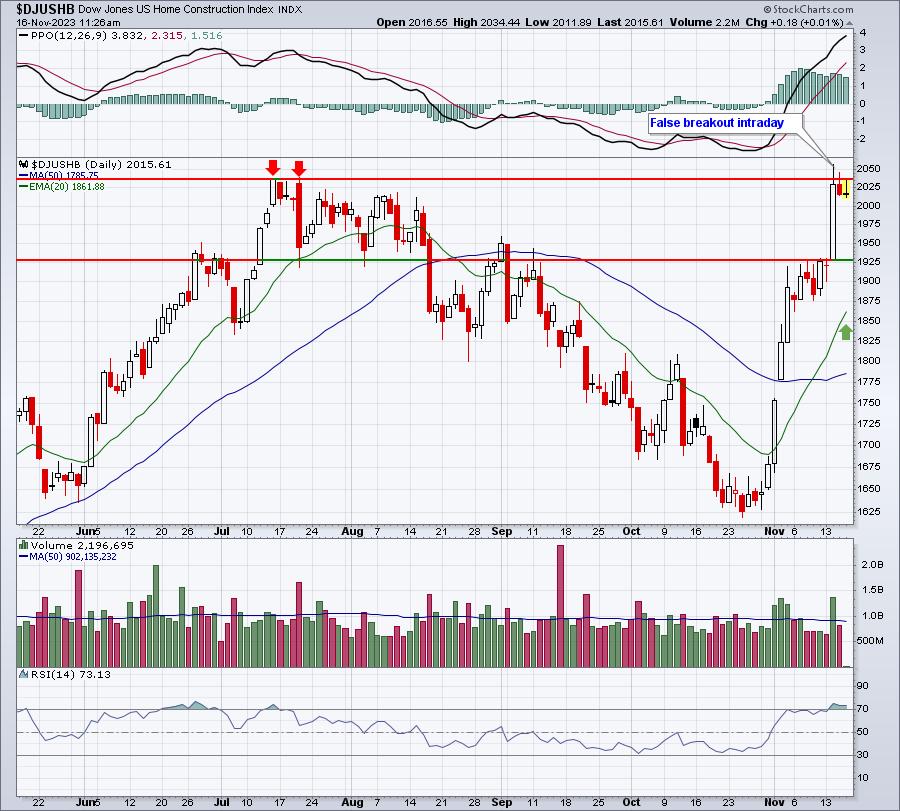
We have to keep things in perspective - not only with this chart, but with all charts. The bigger the advance, the bigger the potential pullback. The DJUSHB just ran up 25% in roughly 3 weeks. That type of advance is unsustainable. The inability to break out could set up the DJUSHB for short-term selling, especially with that false breakout and the bad fundamental news this morning. I do expect, in time, for this group to break above the July high. Let's not forget that we're in the best seasonal period (November through January) of the year for this group. Check out the last 20 years and focus on those average RELATIVE (vs. the S&P 500) gains for November, December, and January:
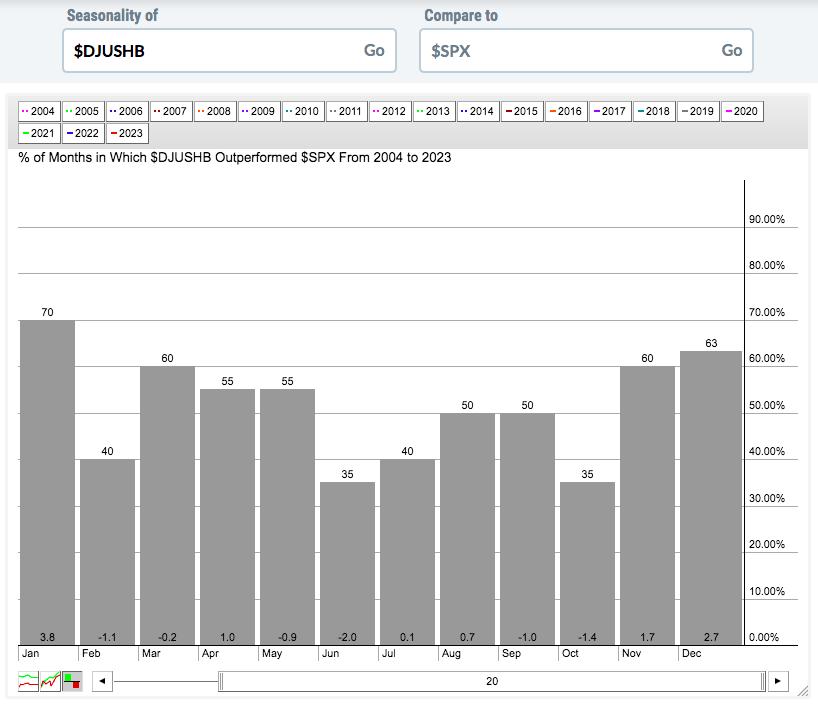
The strength that we've seen in November typically carries right through January. In fact, the relative strength seems to intensify as the average relative gains increase each month.
ChartLists/Strategies
Many times, trading success starts with preparation. Whether or not you own individual stocks, you can research the various ChartLists that we put together for our members. We do the research for you, so that you can spend more time finding high quality trading opportunities. I still need to update our Raised Guidance ChartList (RGCL), but one stock on our somewhat dated list is Universal Display (OLED). I'm watching to see if this key level of resistance can be cleared. Check this out:
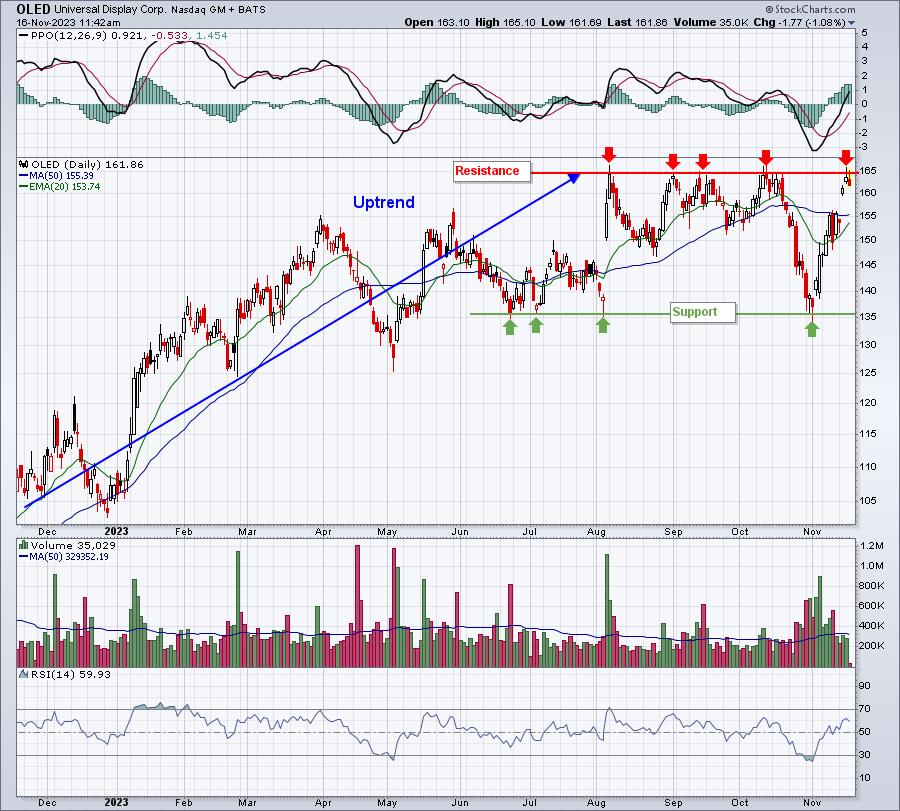
If your preference is to trade breakouts, then OLED should be on your radar. Buying it BEFORE it breaks out can be disastrous. I don't try to anticipate breakouts, I want to SEE them first. But if volume accelerates and OLED trades through the 165 level, a breakout could very well be underway.
Earnings Reports
Here are the key earnings reports for the next two days, featuring stocks with market caps of more than $10 billion. I also include notable companies with market caps below $10 billion. Finally, any portfolio stocks that will be reporting results are highlighted in BOLD. If you decide to hold a stock into earnings, please understand the significant short-term risk that you are taking. Please be sure to check for earnings dates for any companies that you own or are considering owning.
Thursday, November 16:
WMT, BABA, AMAT, NTES, CPRT, ROST, WMG, ZTO, NICE, WSM, DLB, GLOB, BBWI, GPS, M
Friday, November 17:
BJ, ATKR, SPB
Economic Reports
Initial jobless claims: 131,000 (actual) vs. 122,000 (estimate)
November Philadelphia Fed manufacturing index: -5.9 (actual) vs. -11.0 (estimate)
October industrial production: -0.6% (actual) vs. -0.3% (estimate)
October capacity utilization: 78.9% (actual) vs. 79.4% (estimate)
November housing market index: 34 (actual) vs. 40 (estimate)
Happy trading!
Tom