
EB Daily Market Report - Quick Update - Friday, November 24, 2023
Fall Special Reminder!
We have launched our Fall Special, which will run through Sunday, December 3rd at midnight. As most of you know, it doesn't get any better than our Fall Special. The longer you extend your membership, the more FREE bonus months you'll earn. You can earn up to a FREE YEAR with our very best deal. Be sure to take advantage of this opportunity by CLICKING HERE!
Brief Market Update
We're a couple hours before today's abbreviated session ends. It's been a relatively flat day with a bit of relative strength in the small caps as the IWM attempts to clear gap resistance in what appears to already be an uptrend:
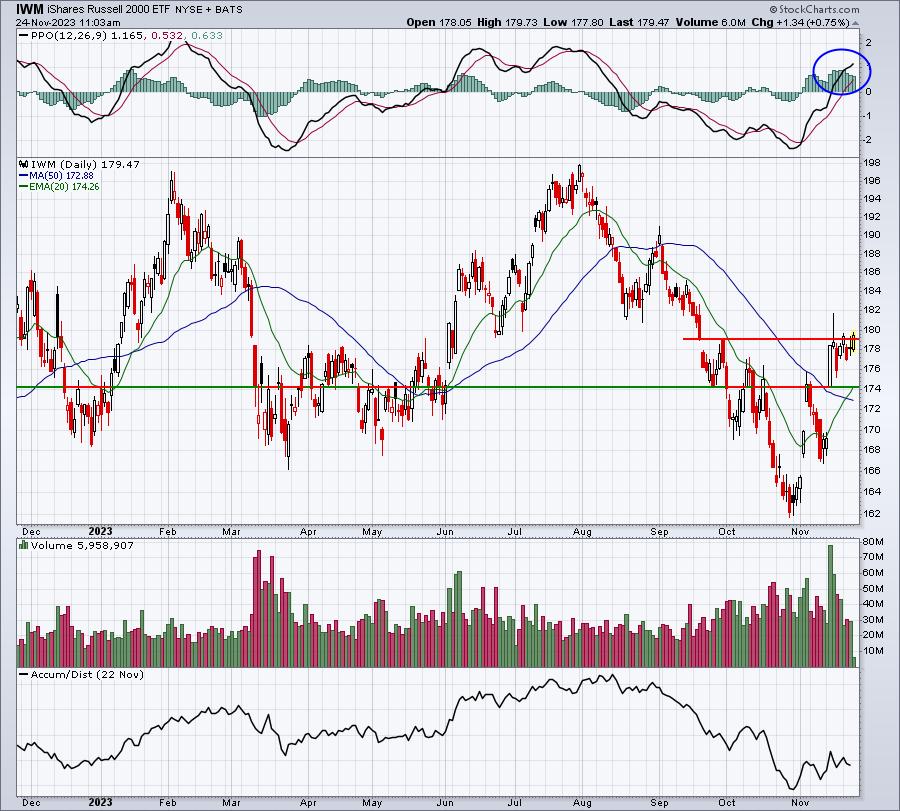
I believe small caps have excellent support just above 174. Gap support resides at 174.23 and the rising 20-day EMA is now at 174.26. If we see a close beneath these two levels, then we'll need to re-evaluate. In the meantime, I'm trading the IWM as if it will continue to trend higher.
Stock Trades
Recently, I had an excellent run on NVIDIA (NVDA) as history suggested that a pre-earnings run would take place and a hammer printed at key price support. The pre-earnings run potential came from our research that's included in The Bowley Trend, two PDFs that summarized (1) overall S&P 500 historical trends, and (2) the historical trends of 16 key individual stocks that really drive the S&P 500 and NASDAQ 100. BOTH of these PDFs are FREE to EarningsBeats.com annual members, yet another value that we pass along to those who are committed and support us here at EarningsBeats. Thank you! If you're not already an Annual Member or if your expiration is coming soon, please consider extending your membership using our Fall Special, as outlined above. It's our best deal of the year and you can save a TON.
For anyone who has yet to download these PDFs, you'll find them on your log in page under "Annual Member Exclusives". We're charging $27 for PDF #2 (unless you're an Annual Member, then it's FREE), which highlights seasonal tendencies for key stocks like AAPL, MSFT, NVDA, TSLA, AMZN, GOOGL, META, and many, many more. These tendencies will help you make money, just like the NVDA trade that I made.
Currently I'm long Tesla (TSLA), because of this seasonal data. It may or may not work out, but TSLA has a very strong tendency to rise from the 24th through the 31st of all calendar months. TSLA's average annual return, if you held since 2013, is 46.69%, which is amazing. But if you only traded TSLA during the last week of calendar months, its annualized return SOARS to 113.89%! Knowing this, AND the fact that TSLA opened this morning fairly close to 20-day EMA support, I decided to increase my TSLA position and use the 20-day EMA as my closing stop. We'll see how this one works out. Here's the current chart:
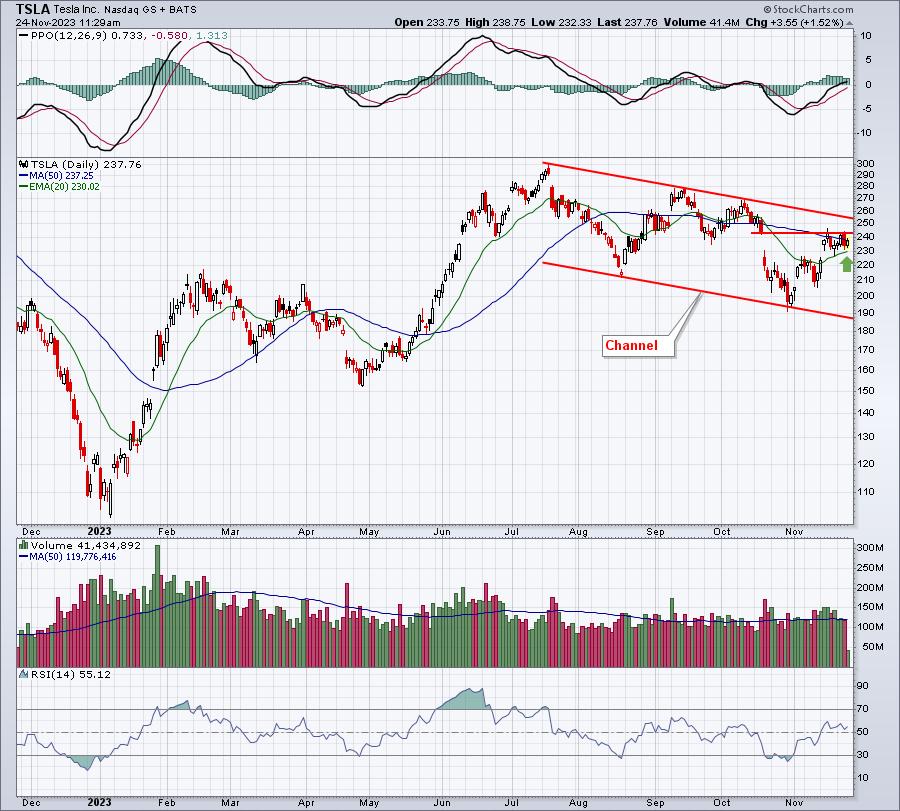
I see the current down channel, but like February through April, these pullbacks and/or corrections tend to be followed by a solid advance, especially during a secular bull market, which I absolutely believe we're in right now. Of course, I also want to make sure I'm objective, so that's why I'm keeping a closing stop beneath the 20-day EMA (green arrow), currently at 230. Ultimately, I see TSLA breaking this channel to the upside. If you look back to late May, when a similar break occurred, you'll see that the resulting uptrend was powerful. The key to making BIG money on these market leaders is to see and ride those crazy strong moves. That's my goal here, hoping first to clear gap resistance at 242.68, then challenge the upper downtrend line in the 250s. A breakout there would get exciting.
I hope you all had a very Happy Thanksgiving! Enjoy your weekend!
Happy trading!
Tom