
EB Daily Market Report - Tuesday, November 28, 2023
Fall Special - 5 Days Left!
Please don't miss out on our BEST DEAL of the entire year. For more information, CLICK HERE.
Executive Market Summary
- Futures were mixed overnight, but we mostly opened slightly lower today
- The Dow Jones has shown relative strength throughout much of the session, while small caps (IWM) has shown relative weakness
- The 10-year treasury yield ($TNX) is down another 4 basis points to 4.35% as rates trek lower and lower
- Bitcoin ($BTCUSD, +3.36%) is leading another crypto surge; etherium ($ETHUSD, +3.24%) is trying to keep pace
- Gold ($GOLD, +1.45%) is gaining as market participants expect the Fed to pause for now
- Crude oil ($WTIC, +2.08%) has jumped back above $76 per barrel ahead of an OPEC meeting
- The Dow Jones, our leader today, is being led by a few large industrials, 3M (MMM, +1.81%), Boeing (BA, +1.68%), and Dow Holdings (DOW, +1.46%)
Market Outlook
Let's take a quick gander at the Dow Jones Industrial Average ($INDU) and highlight key price support and resistance:
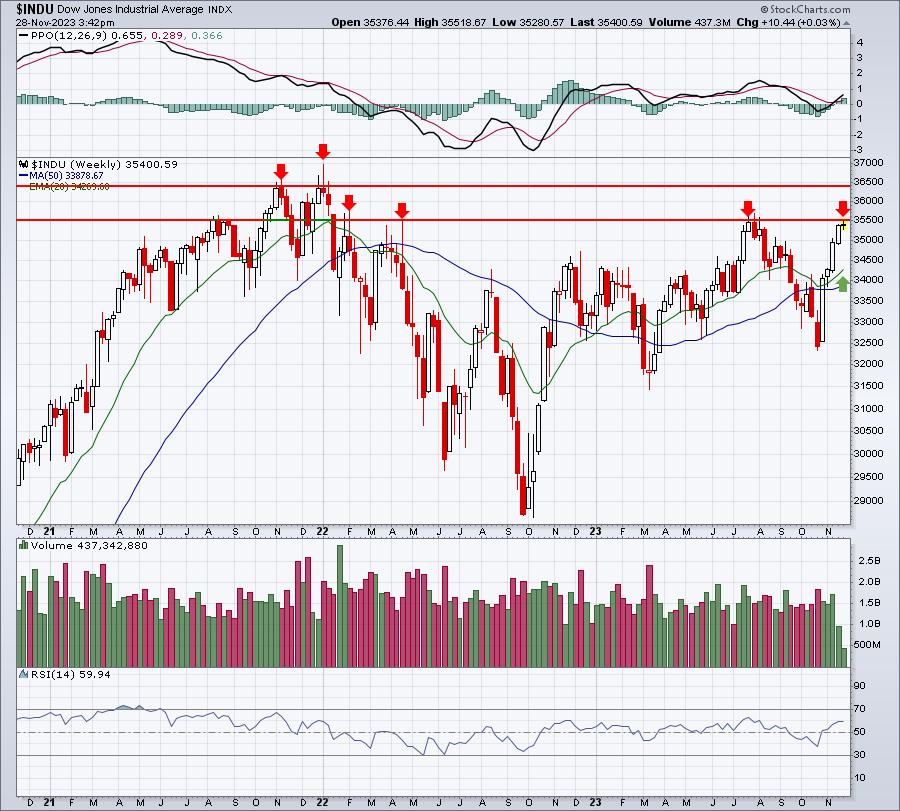
I think the key price resistance is clear. First we have 35500, then 36500. The latter would be testing our all-time high. To the downside, watch the rising 20-week EMA. One very interesting technical indicator to watch is the RSI. We've been battling between RSI 40 support and RSI 60 resistance. Currently, we're at 59.94. If the Dow can keep pushing higher from here, an RSI move through 60 would add yet one more technical piece of evidence that the secular bull market is resuming, and alive and well.
Sector/Industry Focus
It was one month ago that the fortunes changed on Wall Street. The correction ended and a new uptrend emerged, perfect timing based on seasonality. But which sectors and industry groups have been leading the advance? Well, one very quick look at Sector Performance will answer part of that question:
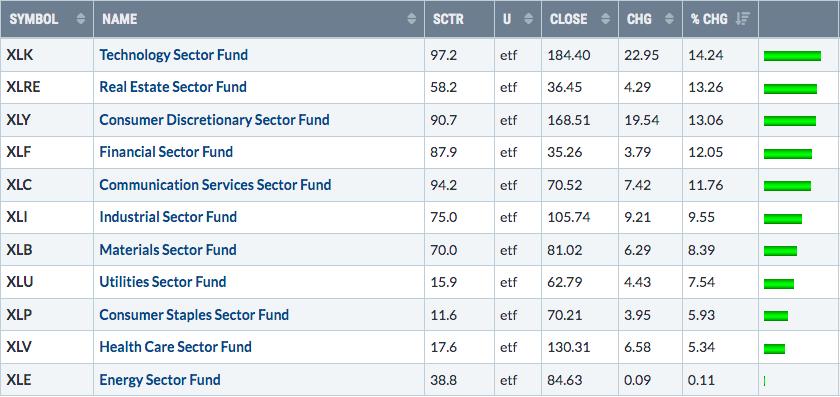
Real estate is among the leaders, rebounding off its 52-week lows in October. Otherwise, it's our key aggressive sectors - all 5 of them. This is absolutely PERFECT bullish behavior. If you care to read it differently, feel free. But in all my years of research, history tells me that betting against an uptrend led by aggressive sectors is a recipe for financial disaster.
As far as industry groups are concerned, here are your top 4:
- Travel & tourism ($DJUSTT): +22.46%
- Home construction ($DJUSHB): +22.06%
- Recreational services ($DJUSRQ): +19.84%
- Specialized consumer services ($DJUSCS): +19.01%
Note that these are all consumer discretionary (XLY) areas. A very simple, common sense question that I'd like for everyone to think about is.....Why would these 4 industries lead the market out of a correction IF a major recession lies ahead of us? If you slow down consumer spending, which is what happens during a recession, wouldn't travel & tourism go "in the tank?" How about home construction? If you're thinking recession ahead, would you park your money in home construction stocks? Recreational services? Specialized consumer services?
I know I rant a lot about CNBC, but why are these questions not asked to all the perma-bears they like to host and parade as "experts"? Why is money rotating into 4 consumer discretionary areas? I'll tell you why. Education is SECONDARY to CNBC. Their shows are for entertainment. They want you to WATCH, not LEARN. They want you to feel as though you NEED them. That drives up viewership and, ultimately, lines their pockets.
Today's rant over.
ChartLists/Strategies
I want to share a couple stocks with you.
TSLA:
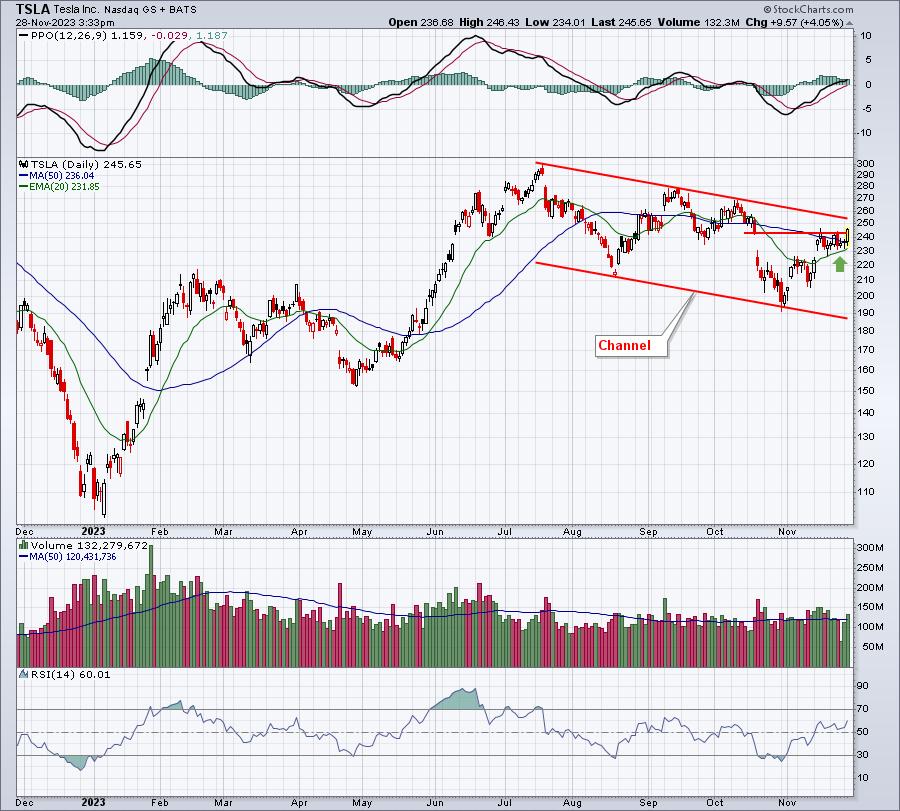
TSLA is trying to finally clear the 242 gap resistance from October. Doing so sets the stock up for a much more significant run higher, in my opinion. The next move is likely to be the mid-250s to challenge its upper downtrend line. If that goes, I see TSLA really accelerating. I believe I shared this with everyone in Friday's DMR. (Disclosure: I own TSLA shares.)
MEDP:
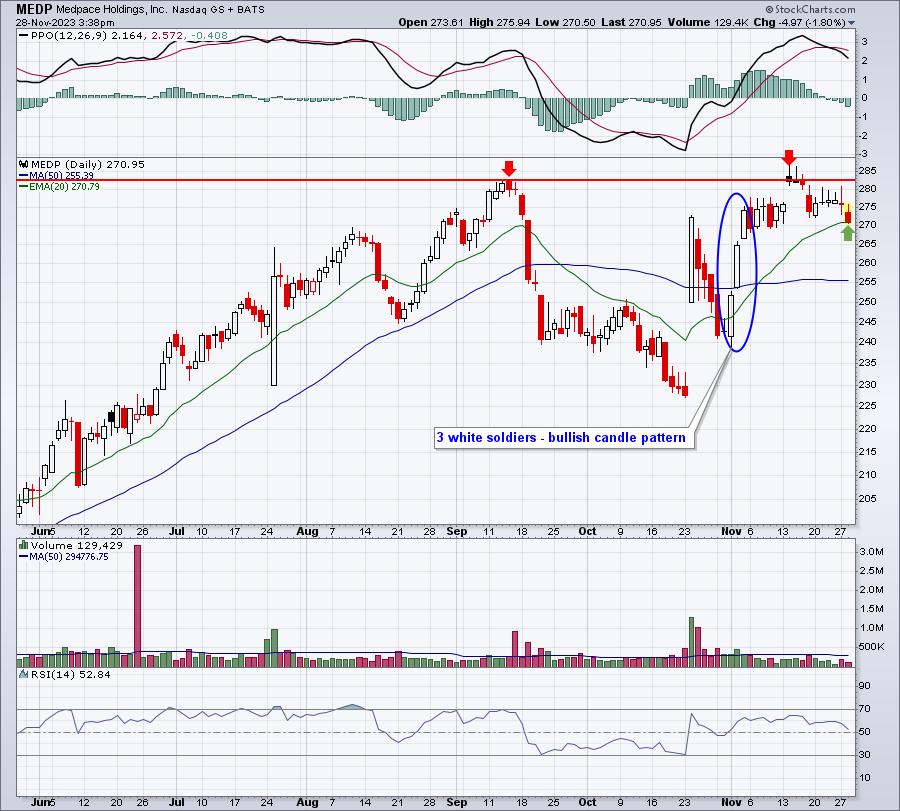
MEDP reported quarterly results and raised its guidance on October 23rd after the market close. You can see the huge surge that took place the next day. We've seen more strength from MEDP since then, but today we're seeing its first 20-day EMA test since crossing above this key moving average to start November. It will be interesting to see if MEDP bounces off this key level.
Speaking of raising guidance, I have completed all of my research and will be adding approximately 400 companies to the updated Raised Guidance ChartList (RGCL) that I hope to complete with annotations tonight. If so, I'll let everyone know tomorrow. If I can't complete tonight, then it'll likely be Thursday. I'm hoping to have all ChartLists updated by the weekend.
Earnings Reports
Here are the key earnings reports for the next two days, featuring stocks with market caps of more than $10 billion. I also include notable companies with market caps below $10 billion. Finally, any portfolio stocks that will be reporting results are highlighted in BOLD. If you decide to hold a stock into earnings, please understand the significant short-term risk that you are taking. Please be sure to check for earnings dates for any companies that you own or are considering owning.
Tuesday, November 28:
INTU, PDD, WDAY, BNS, CRWD, SPLK, HPE, NTAP, ESLT, AZEK, FLNC
Wednesday, November 29:
CRM, SNPS, SNOW, DLTR, HRL, OKTA, PSTG, FIVE, NTNX, DCI, BILI, PVH, NCNO, PDCO, CRDO, FL, VSCO, LZB, ZUO
Economic Reports
September Case-Shiller home price index: +0.7% (actual) vs. +0.7% (estimate)
September FHFA house price index: +0.6% (actual) vs. +0.4% (estimate)
November consumer confidence: 102.0 (actual) vs. 101.5 (estimate)
Happy trading!
Tom