
EB Daily Market Report - Tuesday, December 5, 2023
Fall Special - Extended!
Due to our website issues on Sunday, we decided to extend our Fall Special 3 more days til Wednesday at midnight. For more information, CLICK HERE. We also decided to add two bonuses for anyone that uses our Fall Special to extend membership. First, our annual MarketVision 2024 event, scheduled for Saturday, January 6, 2024, will require non-members to pay us $697 to attend the event. There'll be a significantly lesser charge for members. However, anyone signing up under our Fall Special will be able to attend MV2024 free of charge!
Also, if you've watched our 2-part Bowley Trend series, you know the 2nd part provides a TON of historical tendencies for 16 popular stocks. Well, those who take advantage of the Fall Special will also be able to download all of my Excel data used to compile Part 2. These are just two more examples of us committing to those who commit to us. If you have any questions, let us know at "[email protected]".
Executive Market Summary
- Futures were down overnight and that led to a gap lower at the opening bell
- The NASDAQ 100 (QQQ) has shown a bit of relative strength after its poor showing the past few days
- Despite lower prices, the Volatility Index ($VIX) has just moved to a fresh intraday low at 12.99
- The 10-year treasury yield ($TNX) has fallen another 11 basis points to 4.18%, nearing its initial head & shoulders measurement of 4.10%
- Bitcoin ($BTCUSD, +5.03%) surged near 44,000 and is lifting cryptos higher
- Crude oil ($WTIC, -0.97%) has taken out the November 16th low and now trades at its lowest level since July 7th
- Technology (XLK, +0.29%) and consumer discretionary (XLY, +0.10%) are bouncing today, but are the only two sectors higher on the session
- Meanwhile, materials (XLB, -1.24%) and energy (XLE, -1.03%) are the two worst-performing sectors
Market Outlook
I like to use the 5-day SMA of the equity only put call ratio ($CPCE) as a potential reversal indicator in the short-term. Given that we've seen a nice advance with the S&P 500 touching key price resistance at 4600, it's a good time to check out this fairly reliable indicator. Is that 5-day SMA moving down to the .40-.50 area, where we can see short-term market tops occur?
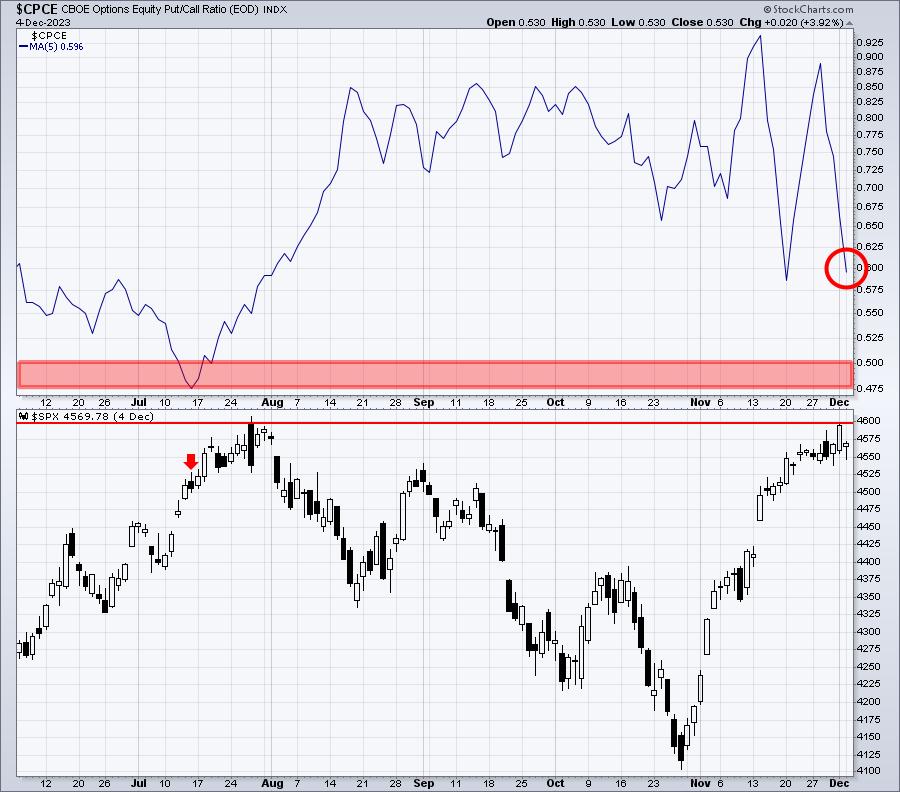
That 5-day SMA is moving lower and lower and has reached .60, but we're not below .50 just yet. One thing to watch for over the next few days is......IF we resume the recent market uptrend and options traders grow more bullish and this 5-day SMA gets down to .50, we should think about growing more cautious short-term. That also lines up with next week's bearish historical period. Here's how the S&P 500 has traded since 1950:
- December 11: -43.95%
- December 12: +0.56%
- December 13: -6.77%
- December 14: -65.40%
- December 15: -17.85%
Those are annualized returns for each day (since 1950). Historical tendencies do not guarantee us certain results. However, if technical conditions look cautious - maybe we see a false breakout above 4600 on Friday after the jobs report (just speculating)? Knowing that history provides headwinds next week, we can potentially use this information to our benefit. I'm sure I'll discuss this more in the days ahead.
Sector/Industry Focus
Broadcasting & entertainment ($DJUSBC) has spent a great deal of time in both absolute and relative downtrends. Recently, the group challenged its absolute price downtrend line, but failed, and is now rolling over once again:
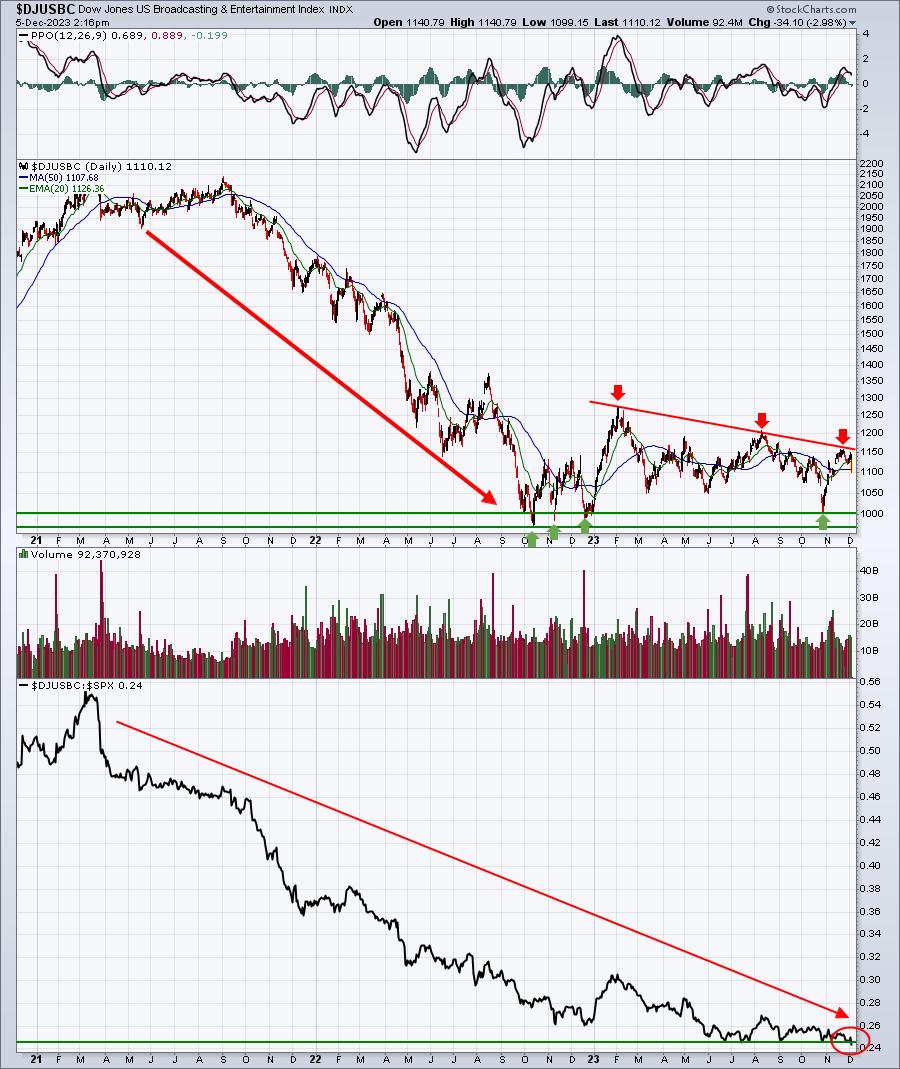
The absolute price pattern appears to be a bear flag. Worse yet, the relative price of the DJUSBC vs. the benchmark S&P 500 just forged to a new multi-year low (red circle in bottom panel). New relative lows are NEVER good.
ChartLists/Strategies
In last week's LIVE Trading room, I discussed a few trades. Check them out:
ADT:
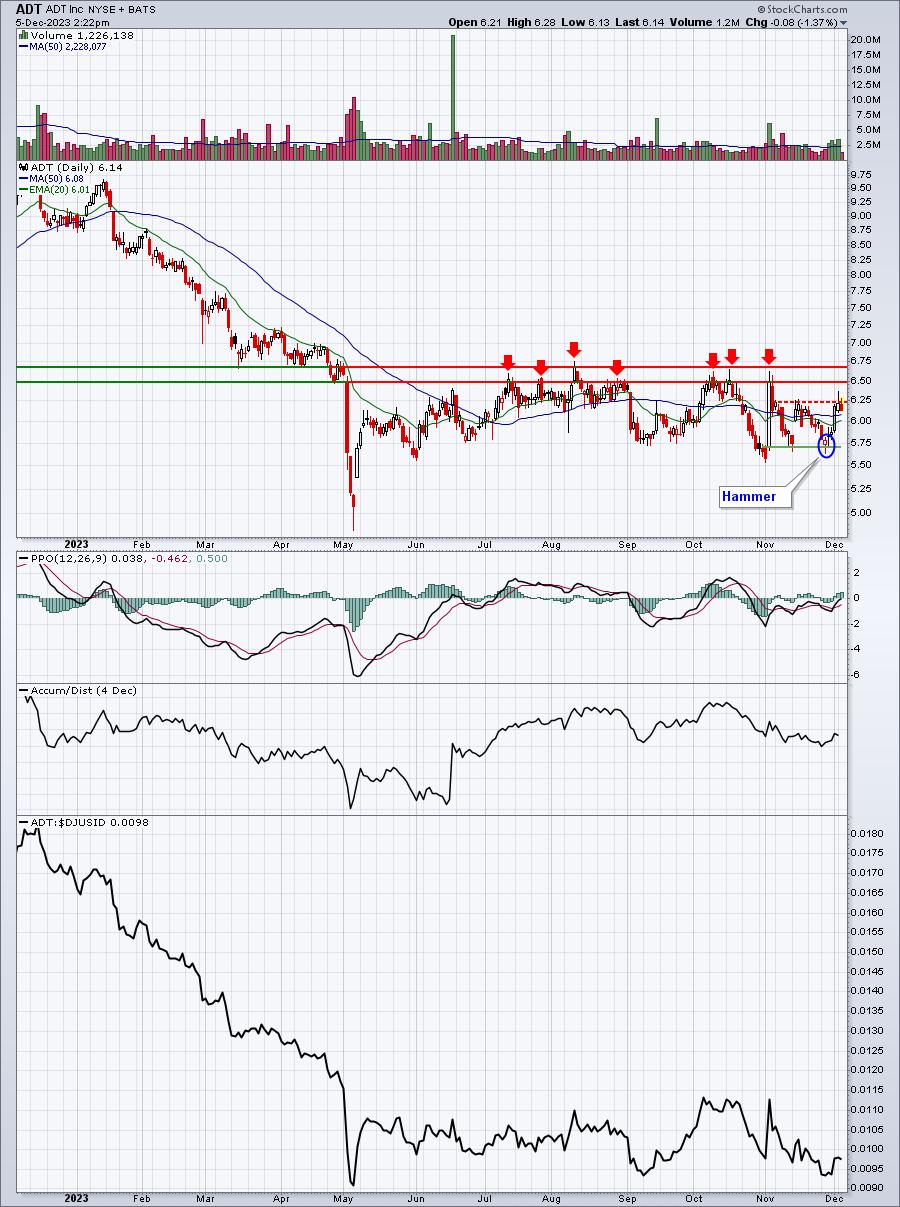
I had two entries at 5.84 and 5.78. Both executed. So my average cost was 5.81. My position size was relatively small for a couple reasons. First, we're talking about a $5 stock. Lower priced stocks tend to interest retail traders more so than professionals, leading to more volatility. I don't want to get caught up in that volatility with a big position. Second, ADT was not a good relative performer among its peers. Therefore, my mindset was "get my money and get out". In a perfect scenario, a trip back to 6.70 price resistance would net roughly a 13%-14% profit. Instead, the failure to clear 6.25 with a long tail above prompted me to sell and take a smaller profit.
CME:
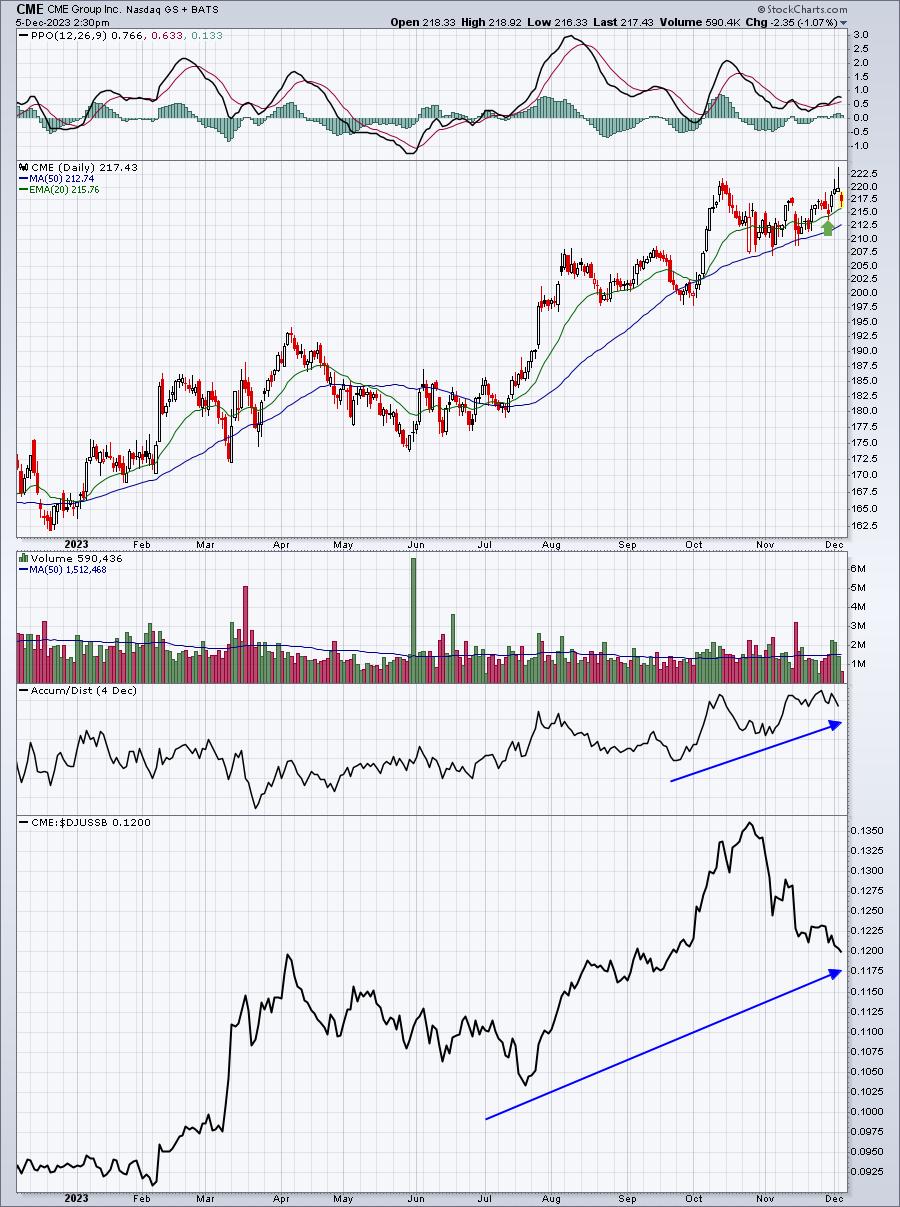
CME was bought last Wednesday off of a 20-day EMA test scan. It also is a leader in the investment services ($DJUSSB) group, which is part of the financials sector (XLF). December tends to be a great month of relative performance for financials, so all of that combined to make CME an attractive trade candidate. As I discussed last week in our LIVE Trading room, CME's first obstacle would be negotiating price resistance near 222. It challenged it, broke above intraday, then left a nasty tail by the end of the day. It turned out to be a false breakout, so I took my profits - again less profits than what I had originally planned, but one of my favorite Wall Street adages is "you can never lose money taking a profit". This is one I may consider re-entering.
POOL:
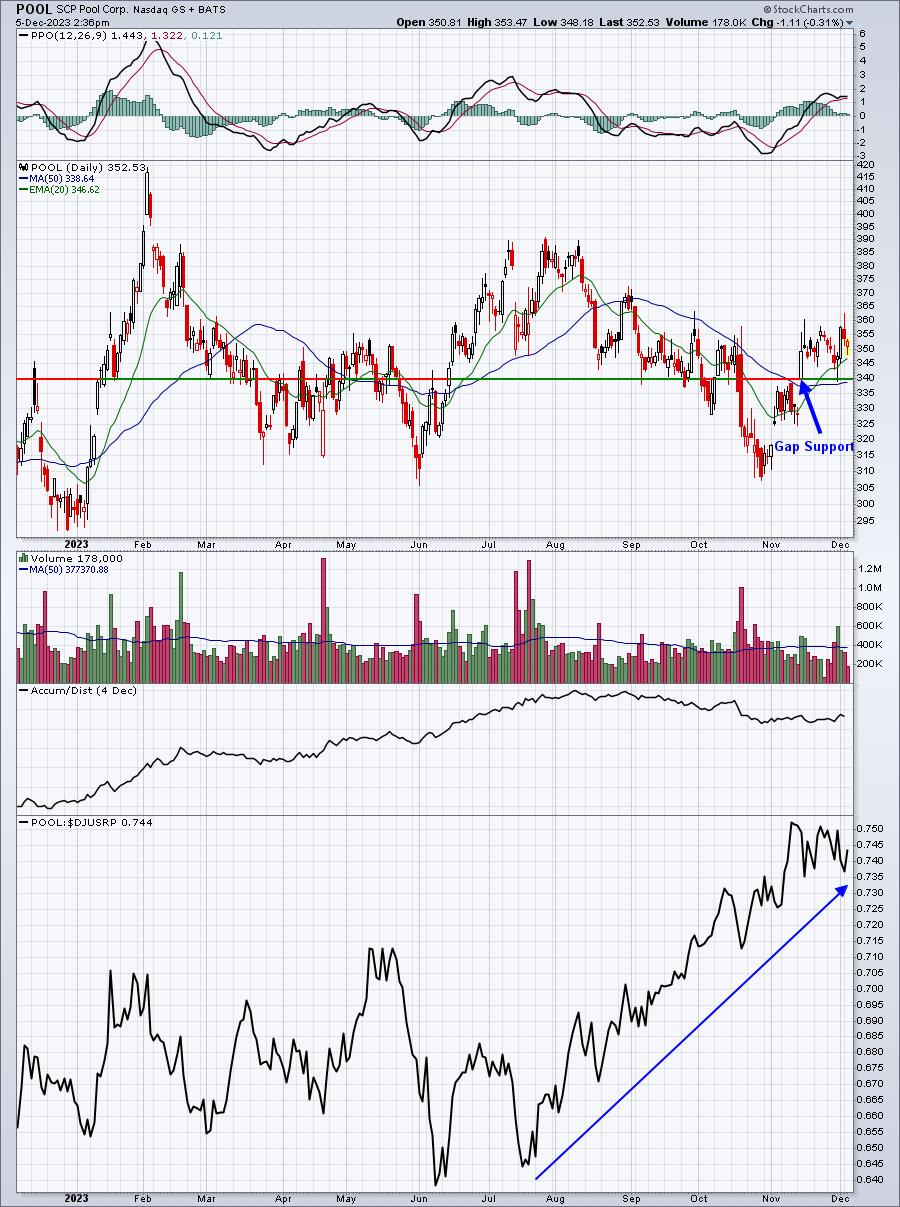
POOL was approaching its 20-day EMA and also was a relative leader among its peers. I set two entries for this trade, the first was a limit order (day only) at 346 at a time last Wednesday when POOL was trading around 349-350. It did move lower that day and my limit order at 346 triggered. A second entry was set at a limit of 340 and that trade was "good til cancelled." On Thursday, it executed, leaving me with an average cost of 343. I saw the overhead price resistance at 355-360 and was looking for a minimum move to this area. It made that move in just two days, moving above 360 briefly before failing into the close, leaving another ominous tail above resistance. Again, I took my profits rather than hoping that POOL would make the breakout. So far, so good, although I still like this one and may re-enter on a 20-day EMA test.
If you can, join me tomorrow morning at 10:00am ET for our next LIVE Trading room, where I'll look to find additional short-term trades.
Earnings Reports
Here are the key earnings reports for the next two days, featuring stocks with market caps of more than $10 billion. I also include notable companies with market caps below $10 billion. Finally, any portfolio stocks that will be reporting results are highlighted in BOLD. If you decide to hold a stock into earnings, please understand the significant short-term risk that you are taking. Please be sure to check for earnings dates for any companies that you own or are considering owning.
Tuesday, December 5:
AZO, FERG, MDB, NIO, SJM, TOL, CNM, DSGX, HQY, S, SIG, BOX, AVAV, PLAY, GIII, PHR, YEXT
Wednesday, December 6:
BF/A, VEEV, CPB, CHWY, BRZE, THO, GME, OLLI, CXM, AI, GEF, KFY, VRNT, OXM, NAPA, SMTC
Economic Reports
November ISM services index: 52.7 (actual) vs. 52.4 (estimate)
Happy trading!
Tom