
EB Daily Market Report - Wednesday, December 6, 2023
Fall Special
Our best deal of the year is scheduled to expire at midnight tonight. To get our best offer of the year, you need to act NOW! We've included MarketVision 2024 (a $697 charge for non-members) as one incentive to use the Fall Special to extend your membership. Those using our Fall Special will be invited to MV2024 free of charge! We're also including all of the Excel data for Bowley Trend, Part 2 as yet another Annual Member exclusive, so if you extend with the Fall Special, you'll get that too! CLICK HERE for more details!
Executive Market Summary
- Futures were higher overnight and although they backed down a bit before the open, all of our major indices still gapped higher
- Crude oil ($WTIC, -4.07%) is tumbling beneath $70 per barrel - more on this below
- Most other commodities are lower as well, but gold ($GOLD, +0.56%) is bucking that trend
- The 10-year treasury yield ($TNX) dipped just below 4.11%, effectively making its measurement to 4.10% based on the topping head & shoulders breakdown at 4.55% in mid-November
- The ADP employment report came in just below expectations, but positive, which U.S. stocks initially reacted to positively this morning; selling has crept in since then, however
- Utilities (XLU, +0.91%) is our leading sector, benefiting from those lower treasury yields, while energy (XLE, -1.44%) breaks down from the tumbling crude price - more on this below
- All eyes will quickly be turning to the nonfarm payrolls report on Friday; it's interesting how the TNX made its way all the way back to 4.10% just before this key economic report
Market Outlook
Discretionary stocks (XLY, +0.29%) are still clinging to gains late this afternoon, while its staples counterparts (XLP, -0.16%) are lagging. I talk over and over and over again about monitoring this intermarket relationship (XLY:XLP) as it gives us a good sense for whether Wall Street firms are favoring offense vs. defense. Here's the current chart:
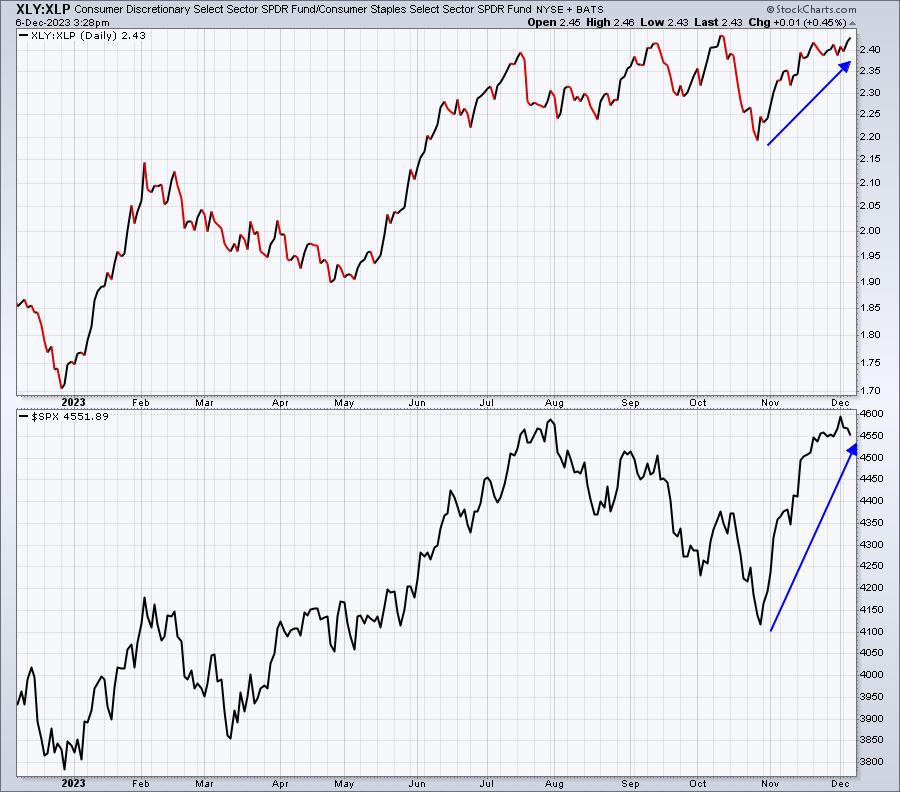
The XLY:XLP ratio is sitting at the door of another breakout. That tells me that any breakout on the S&P 500 is sustainable and fully supported by those big Wall Street firms. I never argue with the Street. They know a lot more than I do.
Sector/Industry Focus
Energy (XLE) is the focus today as crude oil prices ($WTIC) crater. The technical outlook on the XLE and on the WTIC are so difficult to predict. Just when you think you've got a breakout, the group quickly reverses lower. And then a potential breakdown occurs and strength shows up out of nowhere. Well, today we're seeing significant deterioration. Will the energy bulls appear soon to rescue the chart? I don't know, but the weakness here is quite evident:
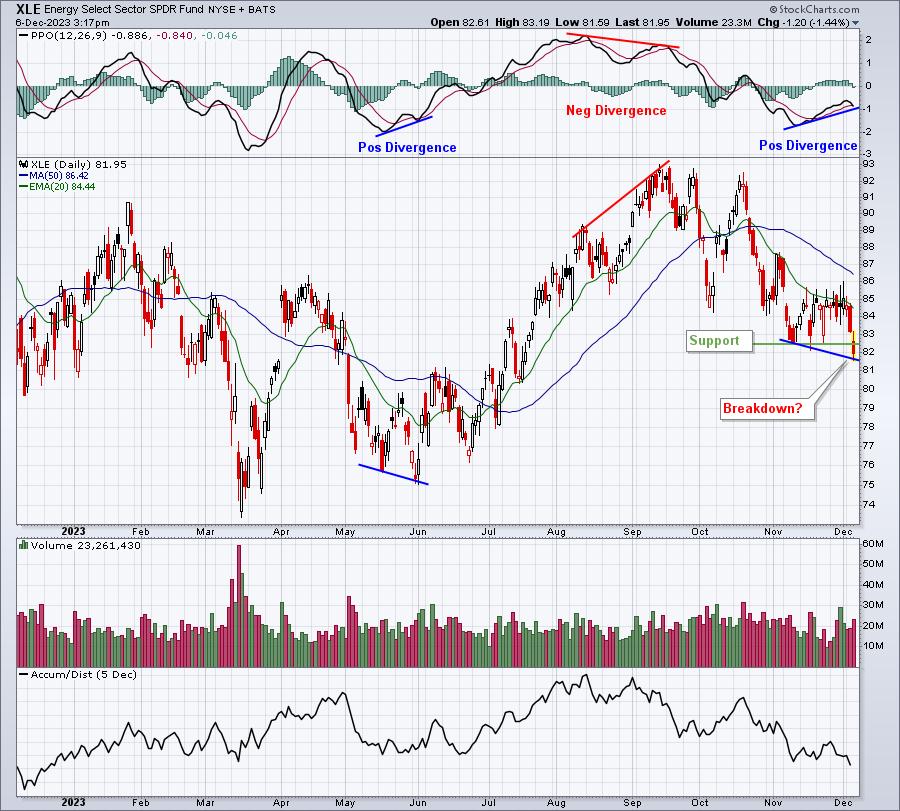
Divergences have worked well at times this year, and a closing breakdown would trigger a positive divergence. That's the good news. I'd still want to see some sort of a bullish reversing candlestick like a hammer or a bullish engulfing candle before taking any chances here.
The reason that the XLE can't seem to catch a bid is that crude oil prices ($WTIC) have moved to multi-month lows. Check this out:
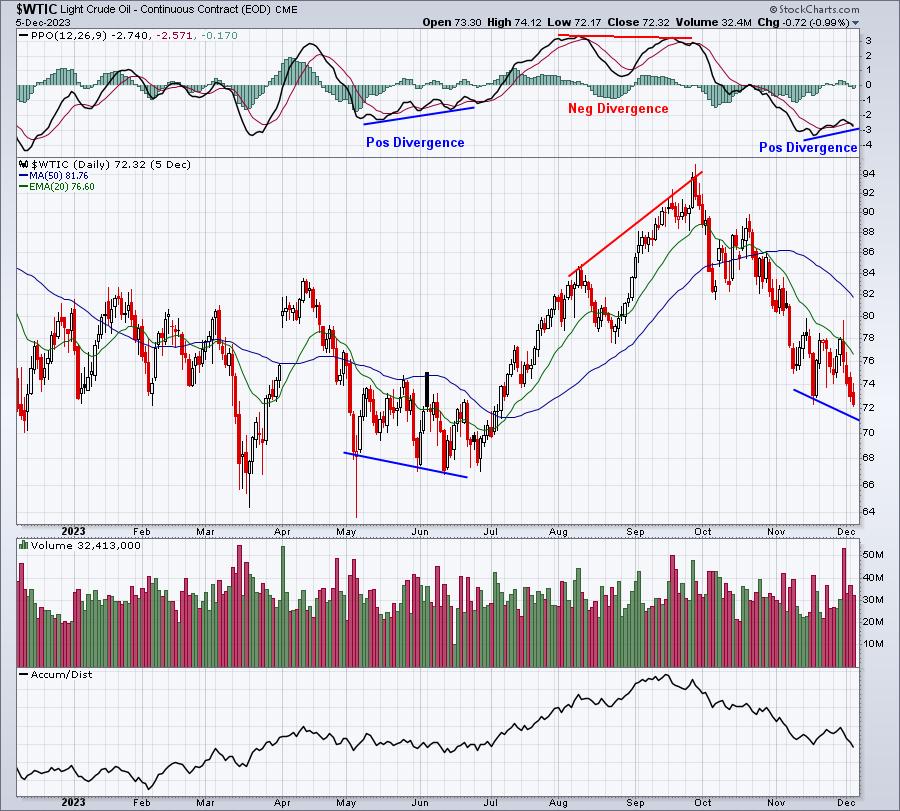
Today's crude price action is a reminder why we should not act on the very sign of a divergence. Crude definitely shows a higher PPO with yesterday's price low, but jumping in would have been costly. Crude is currently at 69.38, 4% lower than yesterday's close. That's why I wait for a reversing candlestick to further support buying on a positive divergence.
ChartLists/Strategies
I've received many questions about TG Therapeutics (TGTX), which was provided here a few weeks ago as a Short Squeeze candidate from our Short Squeeze ChartList (SSCL). It continues pushing higher and is up another 16.1% today alone. Volume is expanding today more than any other day since its November 17th breakout, so it's starting to look more and more like a short squeeze could be getting underway. Whether it's a short squeeze or not, though, it's been a tremendous trade, up nearly 40% in less than 3 weeks. Here's the current look at the chart:
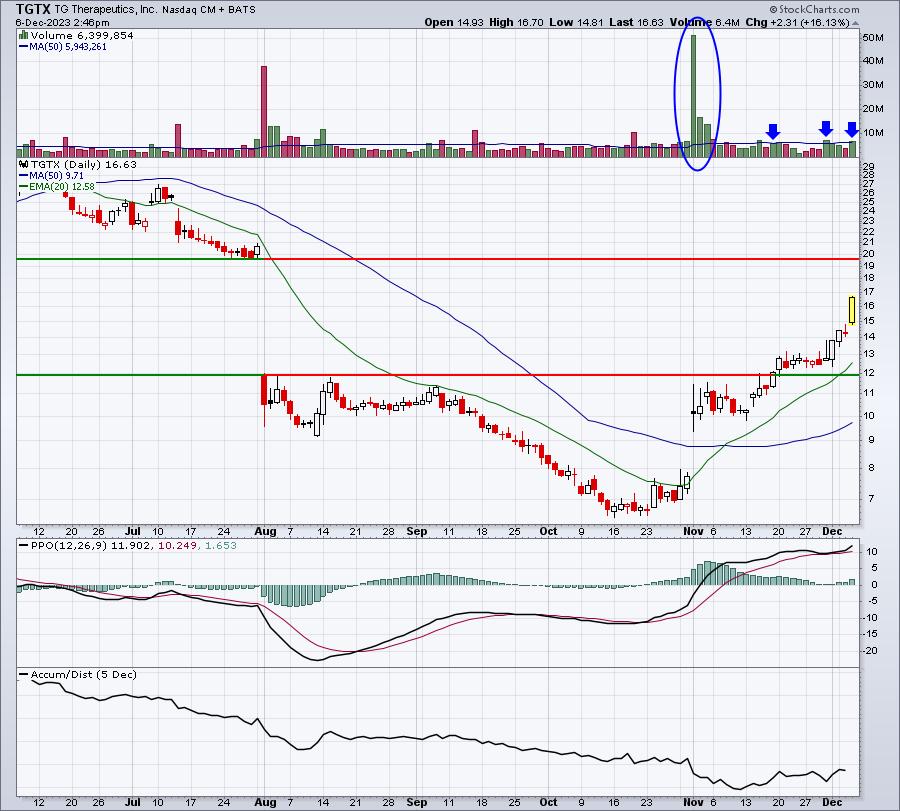
The only real missing ingredient right now is a surge in volume to 10 million shares a day or possibly much more. That would tell us that those on the short side are beginning to panic and cover at ANY COST! Watch in the final 45-60 minutes to see if volume expands similar to this morning's first hour.
Earnings Reports
Here are the key earnings reports for the next two days, featuring stocks with market caps of more than $10 billion. I also include notable companies with market caps below $10 billion. Finally, any portfolio stocks that will be reporting results are highlighted in BOLD. If you decide to hold a stock into earnings, please understand the significant short-term risk that you are taking. Please be sure to check for earnings dates for any companies that you own or are considering owning.
Wednesday, December 6:
BF/A, VEEV, CPB, CHWY, BRZE, THO, GME, OLLI, CXM, AI, GEF, KFY, VRNT, OXM, NAPA, SMTC
Thursday, December 7:
AVGO, LULU, DG, COO, DOCU, MTN, GWRE, CIEN, SMAR, RH
Economic Reports
November ADP employment report: 103,000 (actual) vs. 123,000 (estimate)
Q3 productivity: 5.2% (actual) vs. 4.8% (estimate)
Q3 unit labor costs: -1.2% (actual) vs. -0.9% (estimate)
Happy trading!
Tom