
EB Daily Market Report - Special Report - Friday, December 8, 2023
The November nonfarm payrolls report was released this morning and it came in a bit higher than expected (199,000 vs. 180,000) and the unemployment rate unexpectedly dropped from 3.9% to 3.7%. To me, this was not the goldilocks scenario I was looking for. The actual number was higher than expected, suggesting that the economy remains resilient. The bearish argument is that if the economy is stronger than expected, there could still be pressure on the Fed to consider another interest rate increase. That's confirmed by the 10-year treasury yield ($TNX) jumping nearly 15 basis points this morning, touching a high near 4.28%. It's since settled back to 4.22%, but it's still up 9 basis points.
U.S. equities initially traded lower, particularly the NASDAQ 100 ($NDX or QQQ) and S&P 500 ($SPX or SPY). The small cap Russell 2000 (IWM) once again is showing relative strength. Here are two charts that I've been and continue to watch closely:
S&P 500 ($SPX)
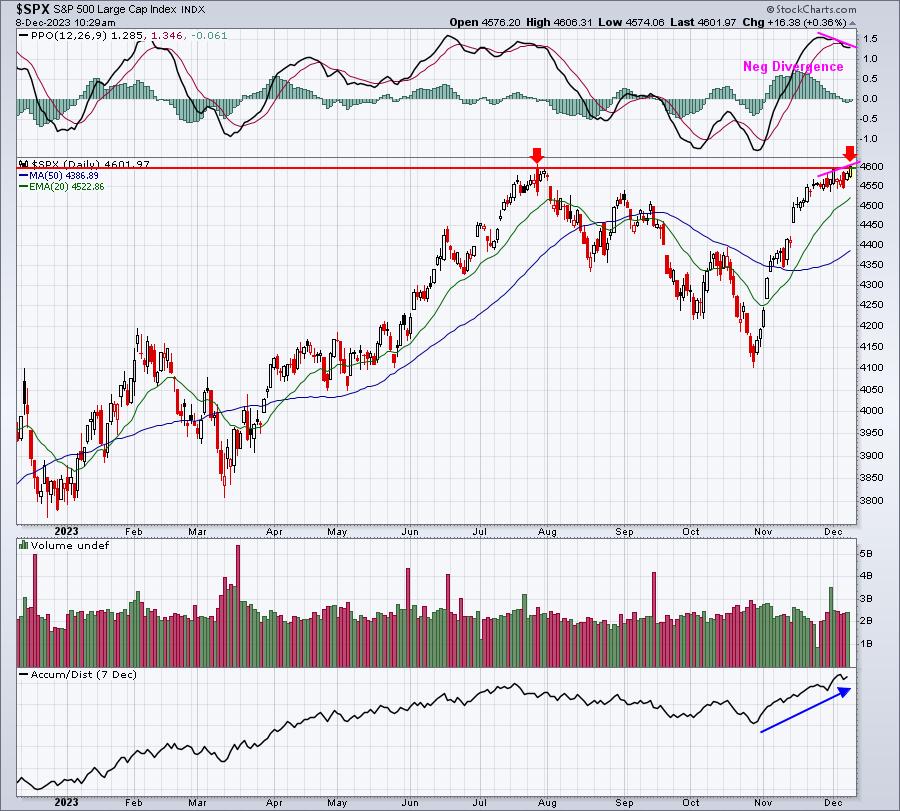
We have cleared 4600 resistance intraday. I am VERY interested to see how we close today, though. Remember, next week is NOT very nice to the bulls historically. As a reminder, here are the S&P 500 annualized returns by day next week:
- December 11: -43.95%
- December 12: +0.56%
- December 13: -6.77%
- December 14: -65.40%
- December 15: -17.85%
This is from data since 1950, or the last 73 years. After December 15th, we do tend to see historical strength return. The most significant strength in December, though, occurs from December 21 through year end. A false breakout on the S&P 500 today with historical headwinds next week wouldn't be ideal. I'll very likely be taking risk off the table throughout this afternoon.
I should also mention that any close above 4600 would print a negative divergence. So even a breakout will need to be watched closely next week.
Russell 2000 (IWM)
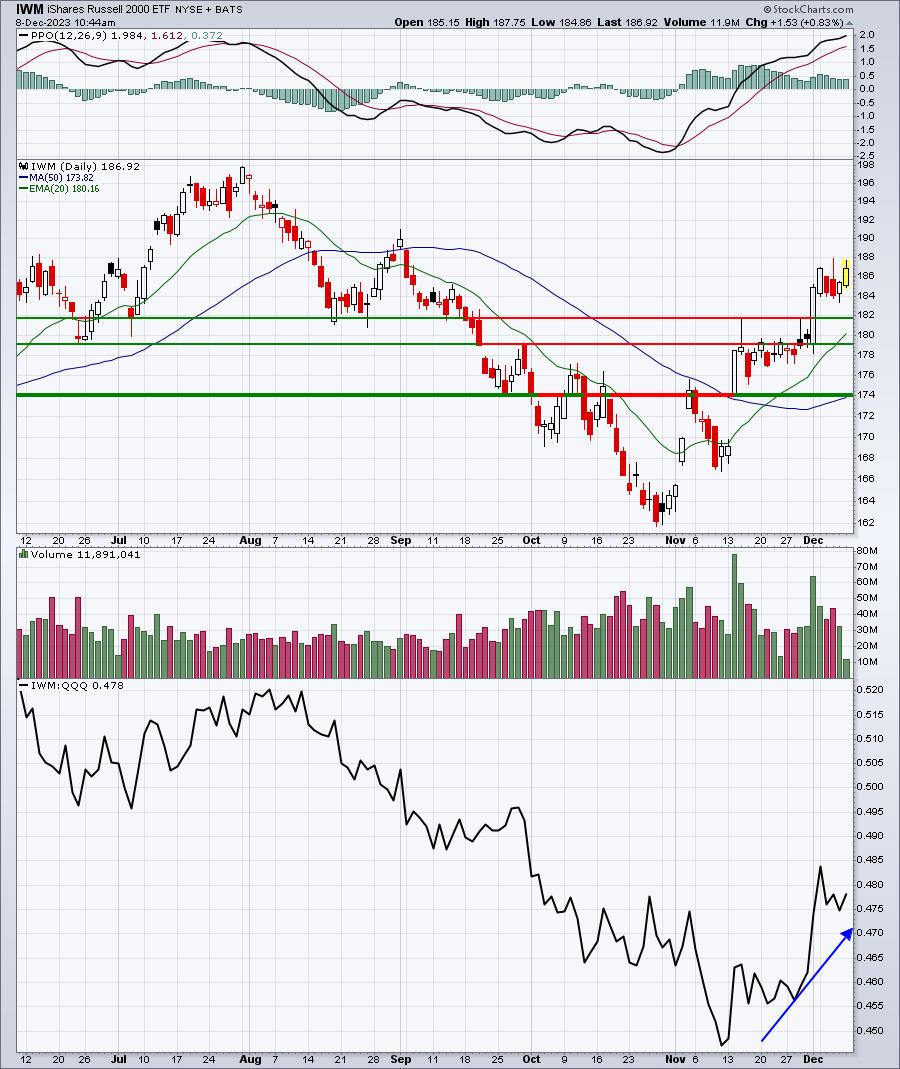
The IWM has been performing exceptionally well on both an absolute and relative basis (relative to the QQQ as shown above in the bottom panel). This lines up historically as well. Check out this 20-year relative seasonal chart and focus on the November and December relative strength:
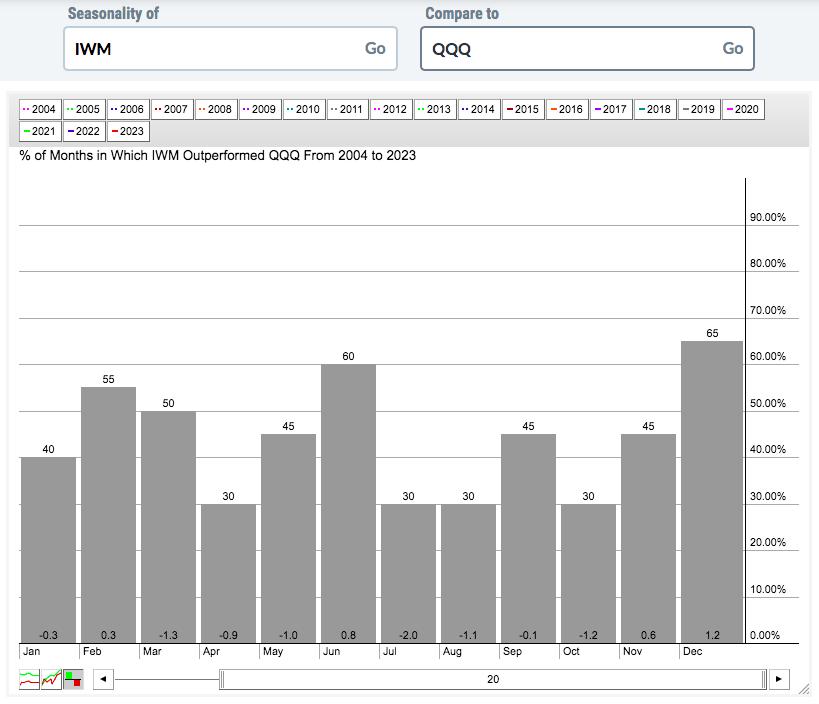
December is easily the IWM's best relative performance month, rising more than the QQQ in 65% of Decembers over the past two decades. Also, December's average outperformance is also the IWM's best. You can see that the relative strength of the IWM begins to strengthen in November and is typically quite strong in December. Now, go back up to that IWM sharp chart and look at the bottom panel again. Note how the IWM's relative strength vs. the QQQ began turning up in mid-November? The current action in the stock market is showing rotation to small cap stocks, which is EXACTLY what history tells us.
Next week could be dicey from a historical perspective, but I do love the absolute and relative strength in the IWM right now.
Happy trading!
Tom