
EB Weekly Market Report - Monday, December 11, 2023
Weekly Market Recap
Major Indices
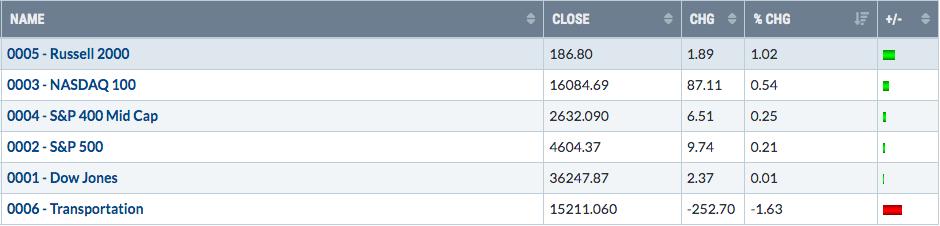
The Dow Jones ($INDU) was flat last week, but that wasn't a bad thing. After soaring the week prior, simply holding onto gains should be viewed favorably. It tells us the bulls remain in charge - at least for now. The NASDAQ, which did see a bounce last week after selling the week before, is only slightly more than 600 points from an all-time high:
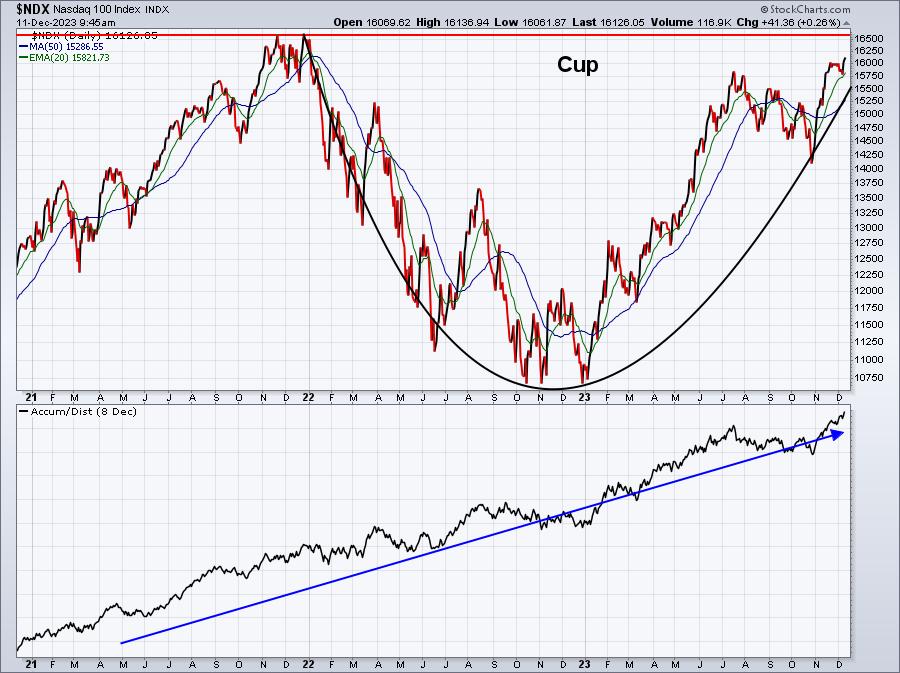
While you can't see the prior long-term uptrend in place from this chart, trust me, it's there. Since the late-2021 high, the NDX fell back during the 2022 cyclical bear market, which marked the left side of the cup and its subsequent recovery is printing the right side of a cup. The AD line continues to set new highs, which simply reminds me that Wall Street is participating in this advance and that's confirmation that I like to see.
There is one short-term issue on the NDX. I didn't show the daily PPO, but this latest breakout on the NDX does come with a much lower PPO, so any type of reversal could result in more short-term selling to reset the PPO and potentially lead to a 50-day SMA test. It's just something that I'm keeping in the back of my mind.
Transports ($TRAN) were an obvious laggard last week, but the pullback sets the group up for another advance soon:
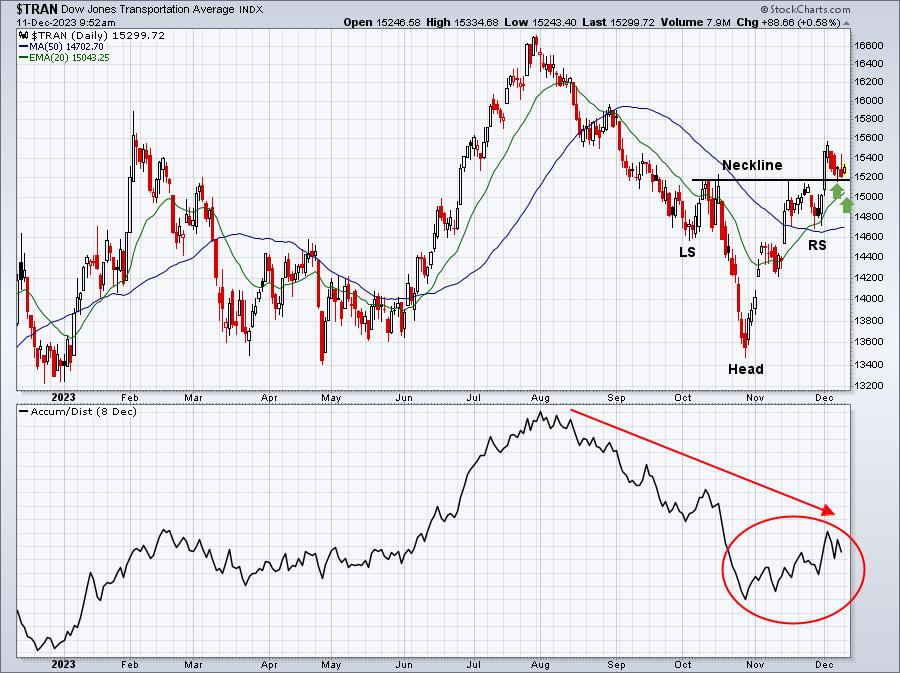
Yes, I am a bit concerned about the AD line struggling to break its 4+ months of downtrending. It has turned up, but I'd like to see more. Having said this, just remember that the AD line, like just about every other indicator, is a secondary indicator. The #1 indicator is always the combination of price and volume. I would respect neckline AND 20-day EMA support (green arrows). As long as that combination keeps transports in an uptrend, I like the group. Failure to hold support would be another story and we'd need to re-evaluate the transportation group.
Sectors
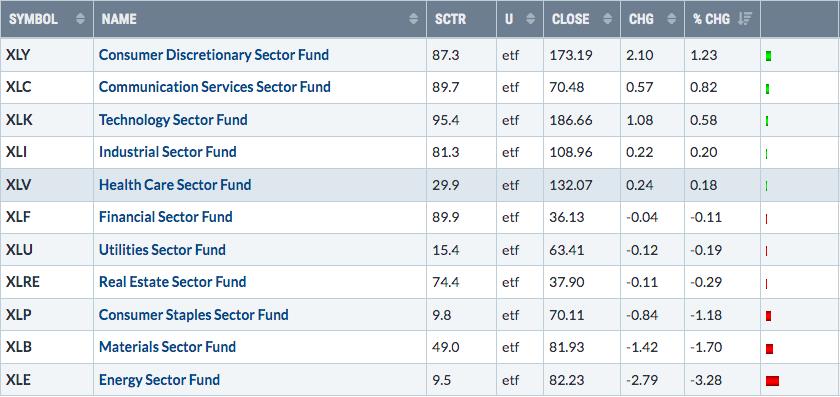
I mentioned the negative divergence on the NDX earlier. The reason we're seeing it is because we're also seeing it on the technology (XLK) chart. While not every divergence works accordingly to plan, it is one little red flag waving:
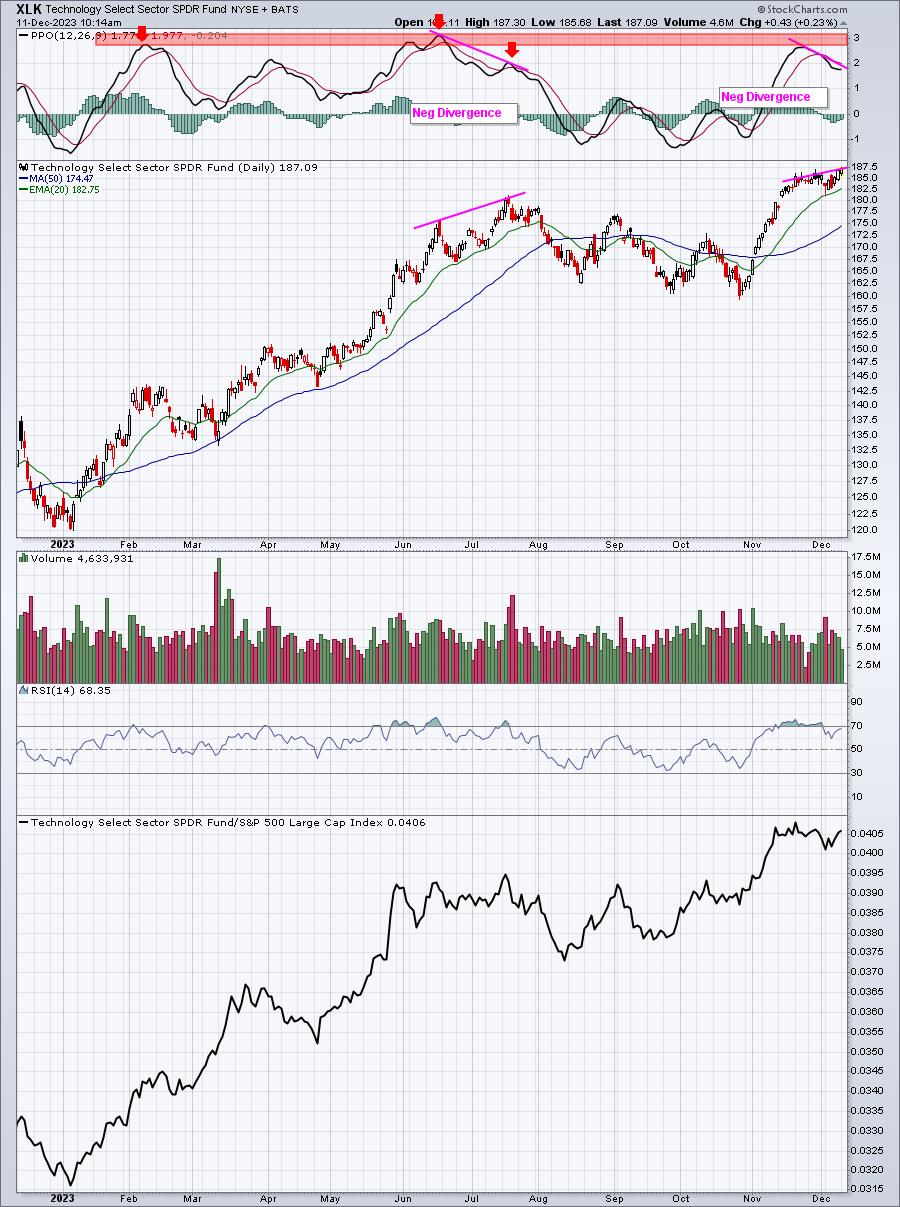
Over the course of 2023, any time we've seen the daily PPO approach or reach 2, it's been time for a break on the XLK. Will this time be any different?
The AD line is strong and I do believe the XLK is going higher. My question is very simply will we see a short-term pullback first? Or maybe just a period of consolidation?
Top 10 Industries Last Week
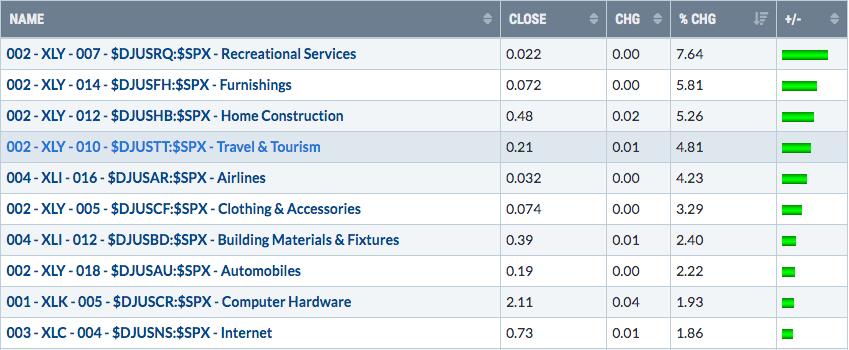
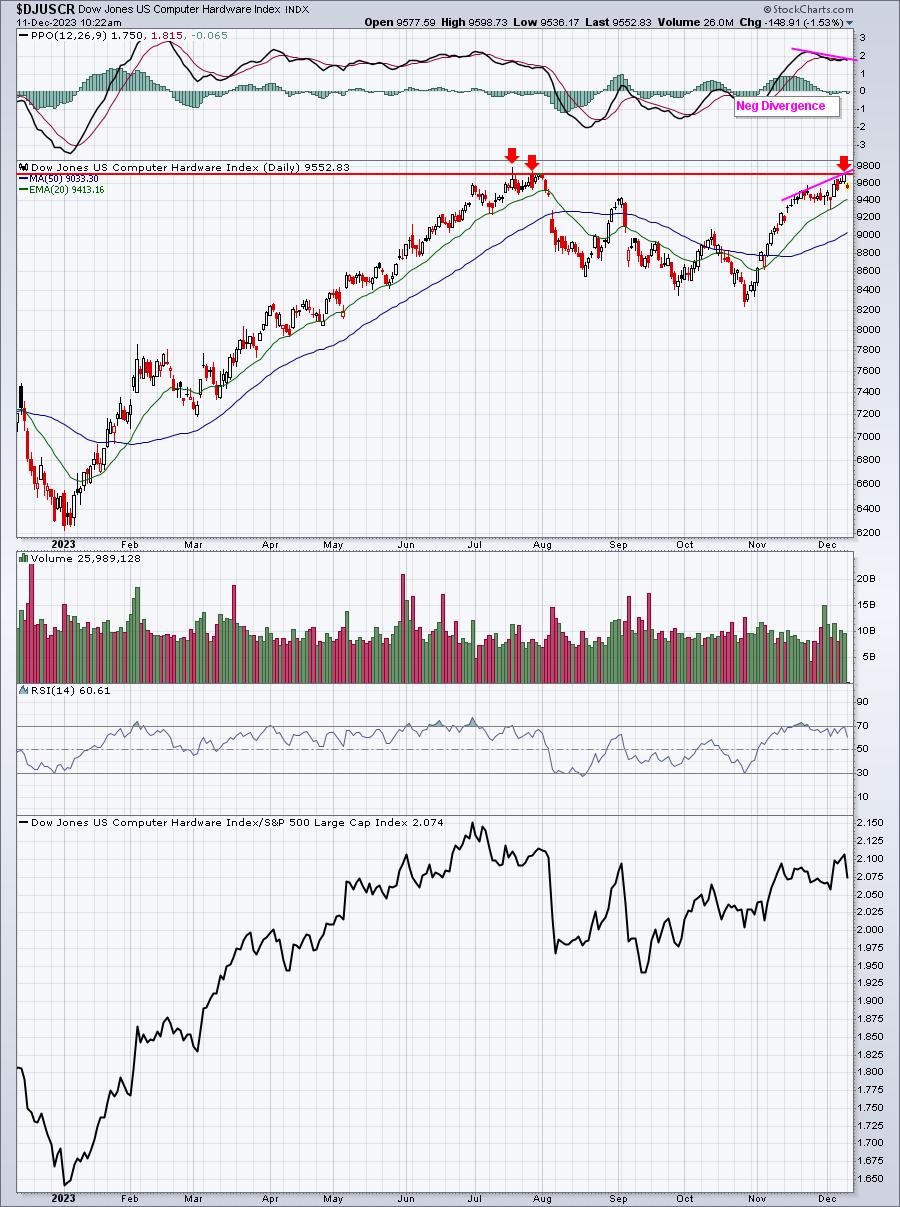
The computer hardware group ($DJUSCR) is an example of a strong industry running into price resistance with a negative divergence:
Automobiles ($DJUSAU), on the other hand, haven't really participated the way some other aggressive industry groups have. The DJUSAU has gone up, but it's still far from its July high and it must negotiate a key channel line:
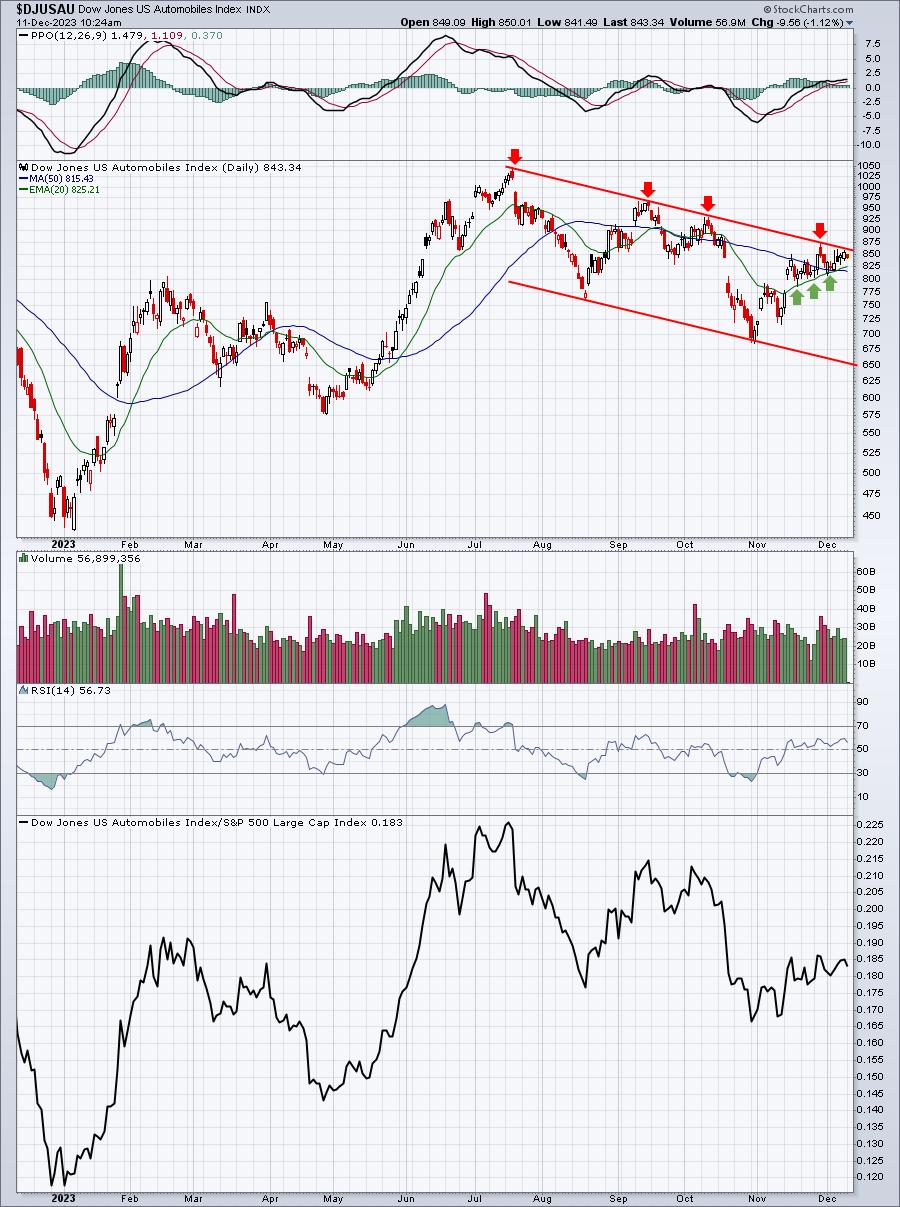
The DJUSAU is a case of short-term support (20-day EMA) battling intermediate-term resistance (downtrend channel line). I believe we'll eventually break out and through this channel, but it's going to be difficult trading stocks like Tesla (TSLA) until a breakout in the index occurs.
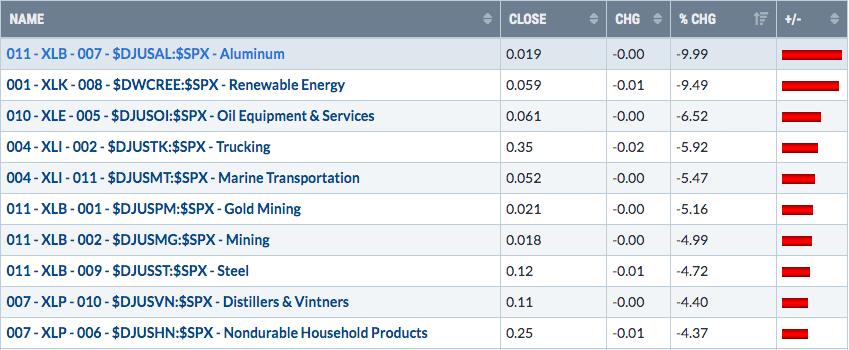
Bottom 10 Industries Last Week
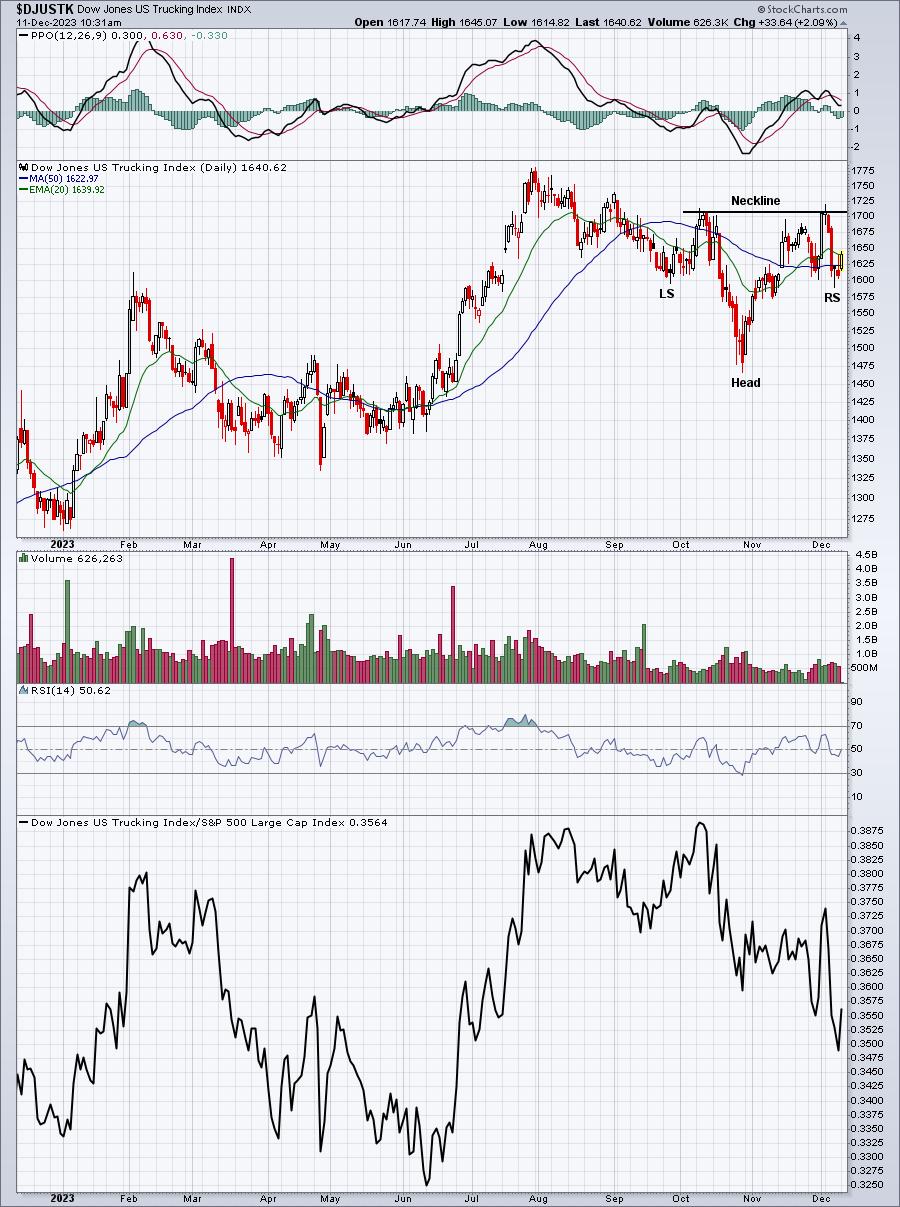
Have truckers ($DJUSTK) just completed a bullish inverse head & shoulders continuation pattern?
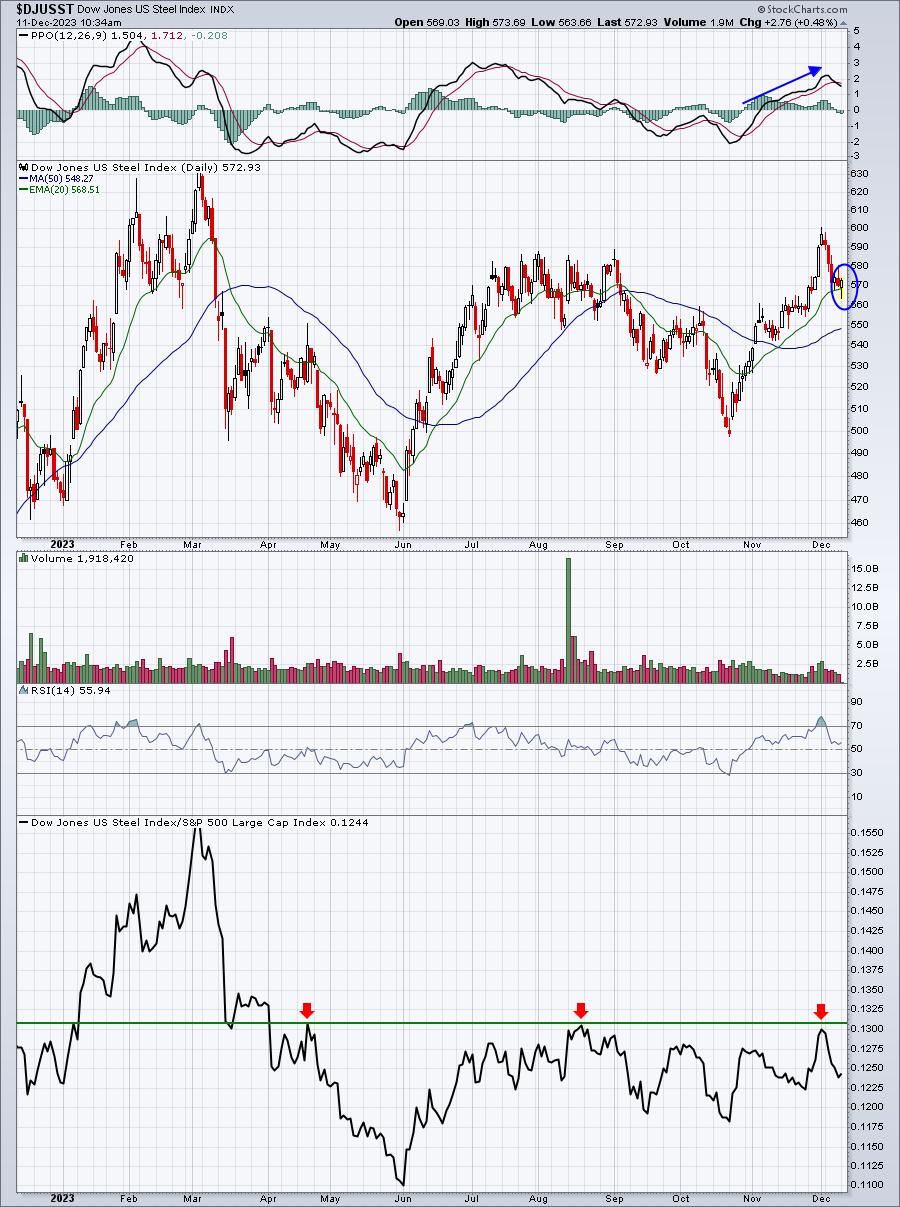
Also, steel ($DJUSST) looks like it COULD be reversing on its rising 20-day EMA. If so, it would certainly help the materials (XLB) group:
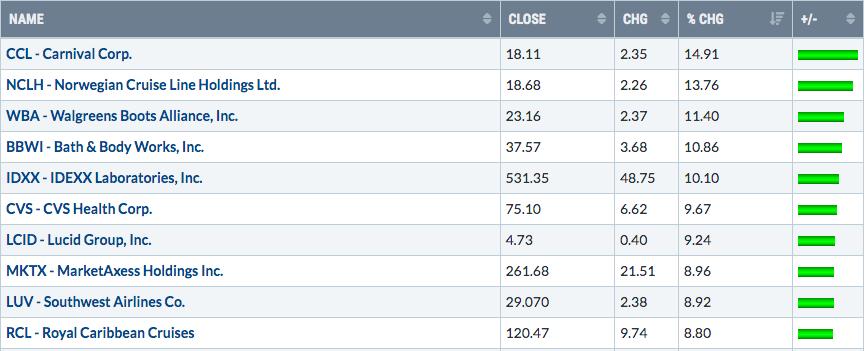
Top 10 Stocks - S&P 500/NASDAQ 100
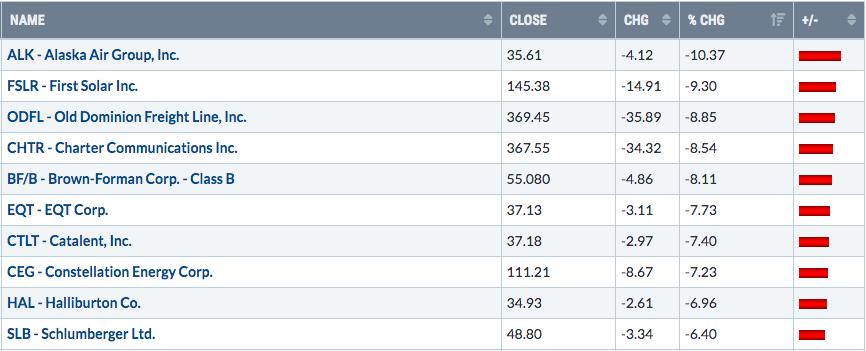
Bottom 10 Stocks - S&P 500/NASDAQ 100
Big Picture
It may just be for a day or two, but the S&P 500 cleared 4600 on Friday. You really can't notice it on this Big Picture 100-year chart, but it does now set us up for a strong finish to 2023. At MarketVision 2023, back in the first week of January, I provided my year end target of 4700:
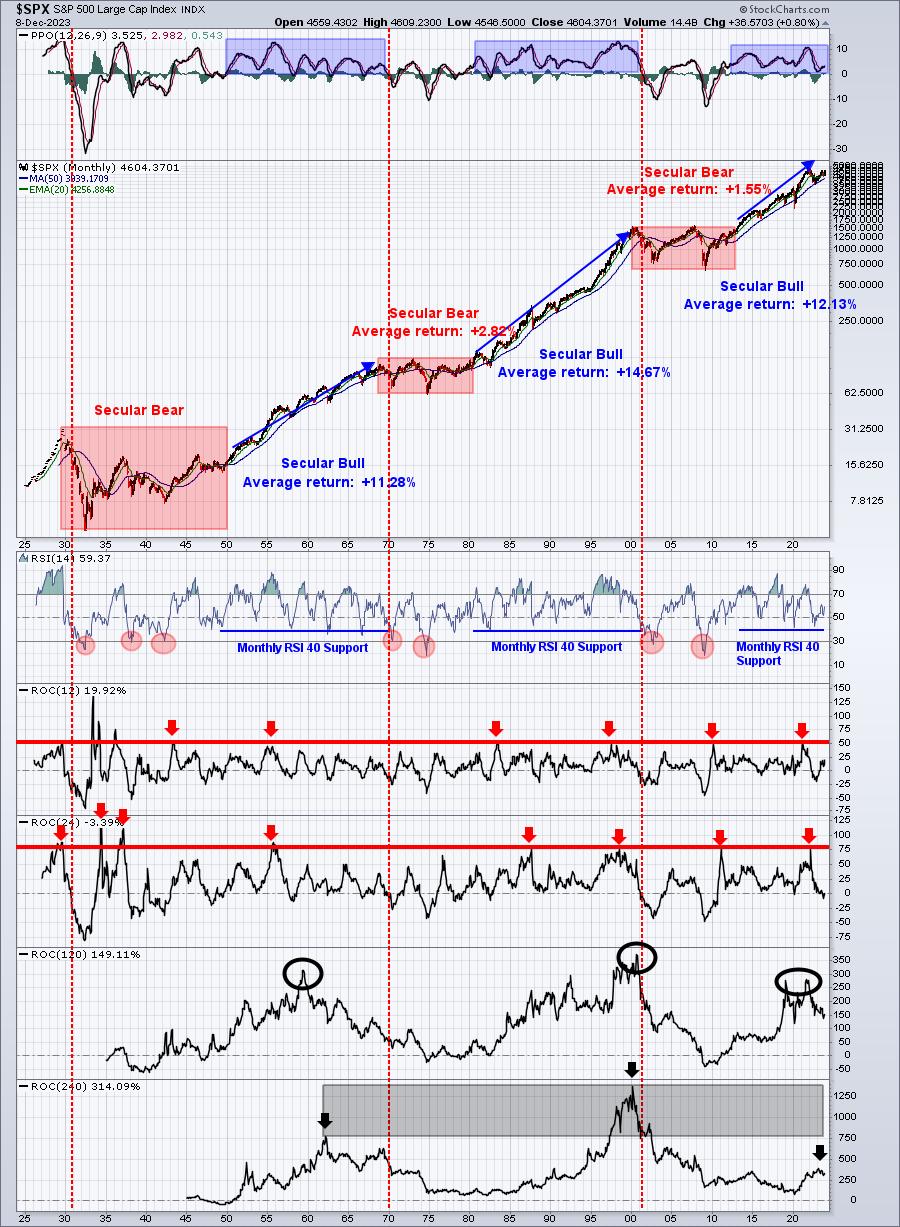
Last week, I mentioned that I'm watching the monthly RSI to see if it can climb back above 60, which is a solid confirmation that a secular bull market remains in play. We closed last week with this monthly RSI at 59.37. Close.
Intermarket Relationships
QQQ vs. SPY
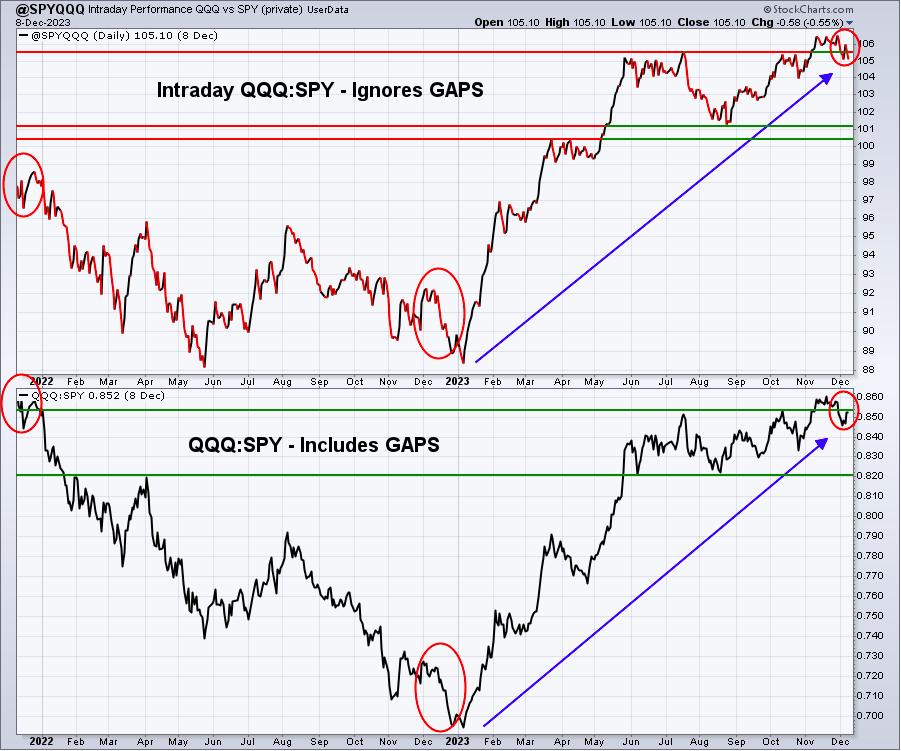
We've seen the QQQ:SPY ratio dropping in December, but don't forget that the SPY tends to outperform the QQQ during the month of December. From the below relative seasonality chart, you can see that the QQQ, relative to the SPY, performs worst during December:
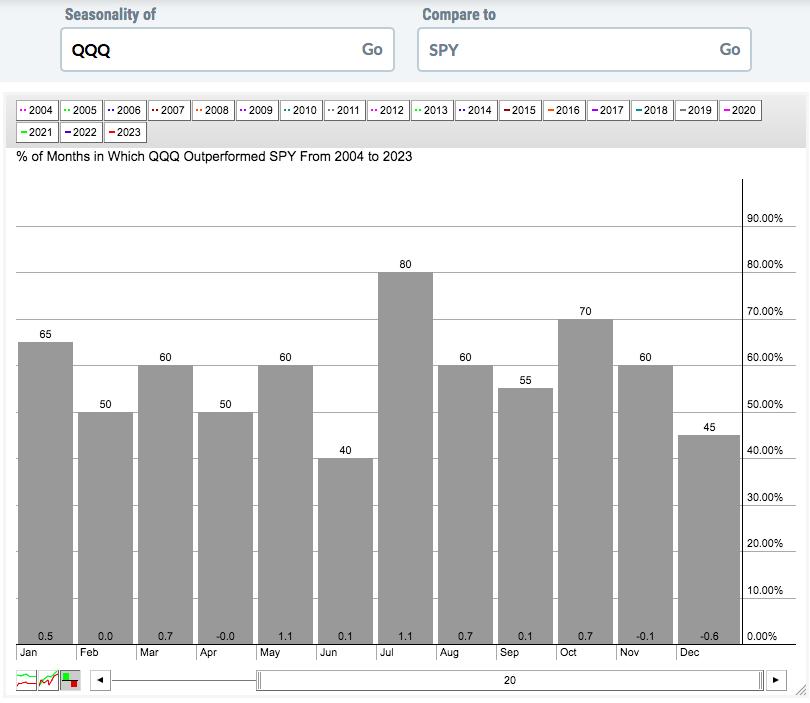
The QQQ averages trailing the SPY by 0.6% over the past two decades. And if we look at all 12 months, there is no month that shows worse relative performance than December. November is the only other month that's negative.
XLY:XLP
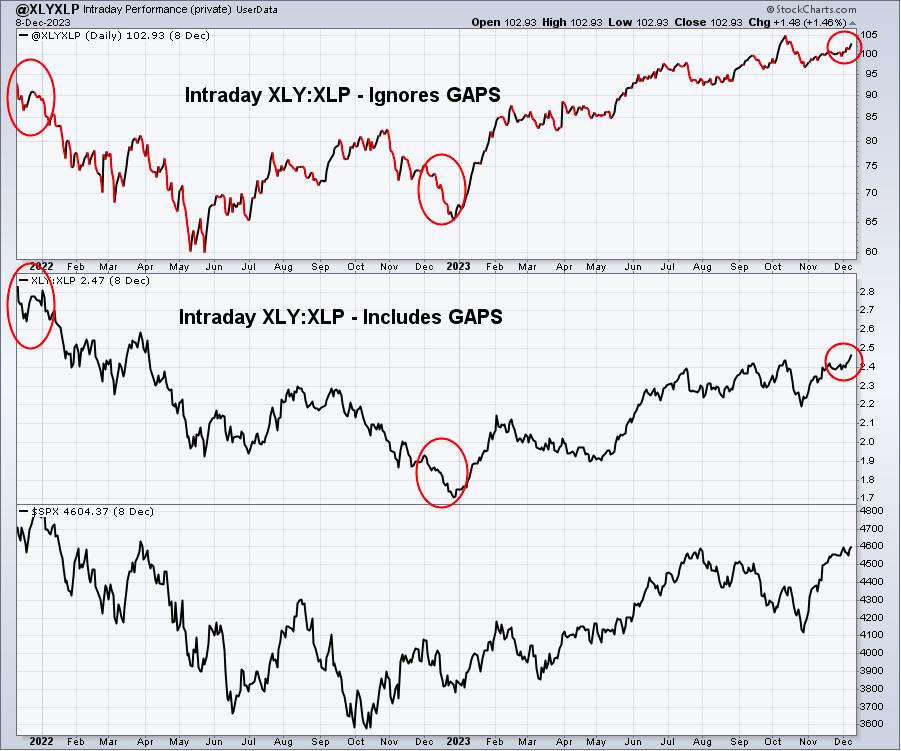
I always like to see the XLY:XLP ratio following the S&P 500 and that's what we're seeing right now. This simply suggests to me that the current rally is sustainable.
IWM:QQQ
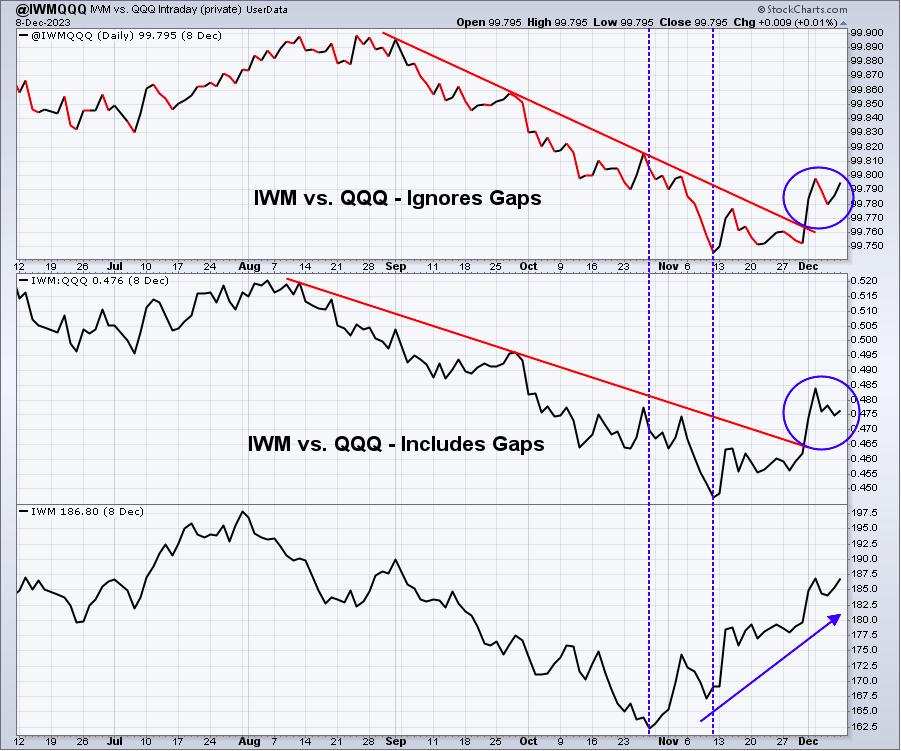
The IWM's relative strength vs. the QQQ is obvious since mid-November. If we ignore the opening gaps and only concentrate on what's happening during the trading session, the IWM:QQQ ratio (top panel) is nearing another breakout.
Sentiment
Equity-only put-call ratio ($CPCE)
Friday marked the 7th consecutive day of the equity-only put-call ratio ($CPCE) finishing at .60 or lower. The last time we saw bullishness in the options world like this was in July, when the CPCE closed at or below .60 for 17 consecutive sessions. It was one factor in my call for short-term cautiousness in mid-July. I don't think we're back at that level of bullishness, but it's at least worth noting that options traders are growing more confident that this rally lasts. We need to all be aware that it's options-expiration week. This Friday is the 3rd Friday of December, so December monthly options will be expiring this week. We know from past experience that can increase volatility for the next week to ten days. It also coincides with historical trends that tell us the 11th through 15th of December is the WORST time of the month, producing annualized negative returns since 1950.
Here's a longer-term chart of the CPCE's 5-day moving average and the job it does foreshadowing potential tops and bottoms:
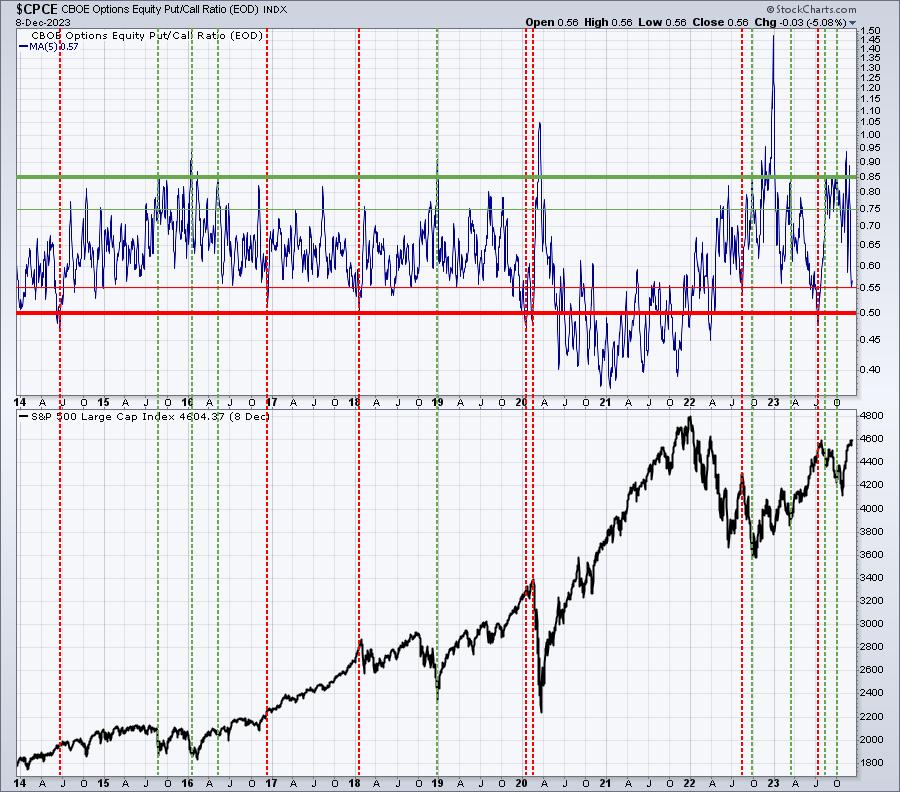
You can look at this chart and draw your own conclusions. Remember, the CPCE is a contrarian indicator, meaning that the market usually does the opposite of the traders' opinion. When traders reach an extreme consensus, be ready for a market reversal. A high CPCE means that options traders are growing EXTREMELY bearish. The .75 level is when I start taking notice, but readings at .85 or higher suggests a major reversal is at hand. When that occurs, I've marked the CPCE with a green-dotted vertical line, expecting that we'll see a reversal off a downtrend.
On the other hand, when traders grow too bullish, we'll see the 5-day moving average of the CPCE reach lows around .55. A trip to .50 or below begins to suggest EXTREME bullishness. At that point, we can begin looking for a reversal and a market top. These signals are marked above with red-dotted vertical lines. Again, you be the judge on whether these signals are useful.
Volatility ($VIX)
I wrote an article two weeks or so ago, discussing how the S&P 500 trades at various levels of the VIX. One key thing to understand is that the VIX is priced off short-term S&P 500 options. When premiums are high on these options, market makers are expecting high volatility ahead and high volatility nearly always means lower prices. When premiums are low, market makers are essentially telling us that they don't believe there'll be much volatility ahead. Low VIX readings are typically associated with bullish upside moves. In effect, by following the VIX, we learn about market maker sentiment. With the CPCE, we learn about traders' sentiment. I like analyzing both, because it gives me two different perspectives. From my article, and since this secular bull market began in 2013, here is the annualized return of the S&P 500 when the VIX trades within various ranges:
- VIX above 20: -36.74%
- VIX between 17-20: +15.29%
- VIX between 13-17: +30.97%
- VIX below 13: +47.26%
This analysis tells me that market makers provide us a VERY important signal and they communicate it to us via the VIX. Today, the VIX is at 12.76, within that most bullish level. So while I could see short-term weakness or consolidation, I maintain a VERY BULLISH stance as we head towards year end. Any selling this week with the Fed meeting and two key inflation reports - November CPI and PPI - sets us up for a rally into year end. At least that's my call.
Trade Setup
Since beginning this Weekly Market Report in early September, I've discussed the long-term trade candidates below that I really like. Generally, these stocks have excellent long-term track records. Only in very specific cases (exceptions) would I consider a long-term entry into a stock that has a poor or limited long-term track record. Check these out:
- JPM
- BA
- FFIV
- UPWK (exception, limited history) - a heavy volume push through 16 would be very bullish here
- MA
- GS - breaking trendline resistance near 350-355 would be very bullish
- FDX
- AAPL
- CHRW
- JBHT
- STX
- HSY
I'm going to pass adding another stock this week as options expiration, the Fed meeting, and November CPI and PPI could yield better opportunities a week from now.
Looking Ahead
Upcoming Earnings:
The following earnings reports (market cap in parenthesis) are, in my opinion, at least relatively significant and worth watching. This is NOT a list of ALL companies reporting this week, so please be sure to check for earnings of any companies that you own or add:
- Monday: ORCL ($309 billion)
- Tuesday: JCI ($38 billion)
- Wednesday: ADBE ($277 billion)
- Thursday: COST ($270 billion), LEN ($39 billion)
- Friday: None
Key Economic Reports:
- Monday: None
- Tuesday: FOMC meeting begins, November CPI
- Wednesday: November PPI, FOMC announcement
- Thursday: Initial jobless claims, November retail sales, October business inventories
- Friday: December empire state mfg index, November industrial production/capacity utilization, December PMI
Historical Data
I'm a true stock market historian. I am absolutely PASSIONATE about studying stock market history to provide us more clues about likely stock market direction and potential sectors/industries/stocks to trade. While I don't use history as a primary indicator, I'm always very aware of it as a secondary indicator. I love it when history lines up with my technical signals, providing me much more confidence to make particular trades.
Each week, I'll provide you the average annualized returns for each calendar day and by index. Here are the historical numbers for this week:
S&P 500
- December 11: -43.95%
- December 12: +0.56%
- December 13: -6.77%
- December 14: -65.40%
- December 15: -17.85%
NASDAQ
- December 11: -12.80%
- December 12: -2.95%
- December 13: -10.67%
- December 14: -17.02%
- December 15: -4.83%
Russell 2000
- December 11: -110.08%
- December 12: +18.42%
- December 13: -74.37%
- December 14: -116.17%
- December 15: -30.14%
The S&P 500 data dates back to 1950, while the NASDAQ and Russell 2000 information date back to 1971 and 1987, respectively.
We are now in the most bullish period of the calendar year. The close on October 27th through the close on January 18th is THE ABSOLUTE BEST TIME OF THE YEAR FOR U.S. EQUITIES - HISTORICALLY SPEAKING. This week tends to be the most bearish week of December. If you look at those numbers on the Russell 2000, then it might make sense to avoid leveraged ETFs on this index. The NASDAQ's historical losses are much more modest, while the S&P 500 falls in between the other two. Historically-speaking, it just makes sense to be a bit more cautious. The better historical period begins in roughly 10 days or so. More on that next week.
Final Thoughts
We have reason to check our enthusiasm at the door right now. Several factors could play a role this week and we need to at least be aware of them:
- The Fed's last meeting of 2023 begins tomorrow, with its policy statement due out on Wednesday at 2pm. There is noo expected change in the fed funds rate, but it'll be important to listen to what the Fed has to say
- Volatility can be severe with an FOMC announcement and, many times, we see multiple head fakes the first 30-60 minutes after the announcement.
- We'll get two key inflation reports - the November CPI (Tuesday) and November PPI (Wednesday) - and the Fed will take these two reports into account when they discuss policy at Wednesday 2pm ET.
- December monthly options expire this Friday, which can also increase volatility; after the huge advance we've seen since last October, there are TONS of net in-the-money call premium that we'll discuss at our Tuesday December Max Pain event. I hope to see you there.
- While December is a seasonally strong month, it can be difficult this week, as you can see from the historical numbers I laid out earlier; While small caps (IWM) generally love the month of December, the 11th to 15th can pose significant headwinds. Again, check those number above.
- The S&P 500 closed last week above 4600, but barely. Do we build on it this week or will we have to wait for further gains until the second half of December? We're currently flat today.
Feedback
If you'd like to share your thoughts on our Weekly Market Report, positive or negative, you can reach us at "[email protected]".
Happy trading!
Tom