
EB Daily Market Report - Friday, December 15, 2023
Executive Market Summary
- Futures were mixed on the open, sold off a bit intraday, but are closing in fairly strong fashion
- Commodity prices are mixed, with crude oil ($WTIC, +0.03%) relatively flat, while silver ($SILVER, -0.99%) showing relative weakness
- The 10-year treasury yield ($TNX) is down 2 basis points to 3.91%
- Technology (XLK, +0.74%), after showing a bit of relative weakness this week, rebounded today and is our top-performing sector
- Consumer discretionary (XLY, +0.21%) is our only other sector in positive territory - more on the XLY below
- Meanwhile, utilities (XLU, -1.20%) and real estate (XLRE, -1.38%), recent leaders, are trailing significantly today
- The renewable energy stocks ($DWCREE, +6.46%) are breaking from a bottoming reverse head & shoulders pattern and look to move higher into year end
Market Outlook
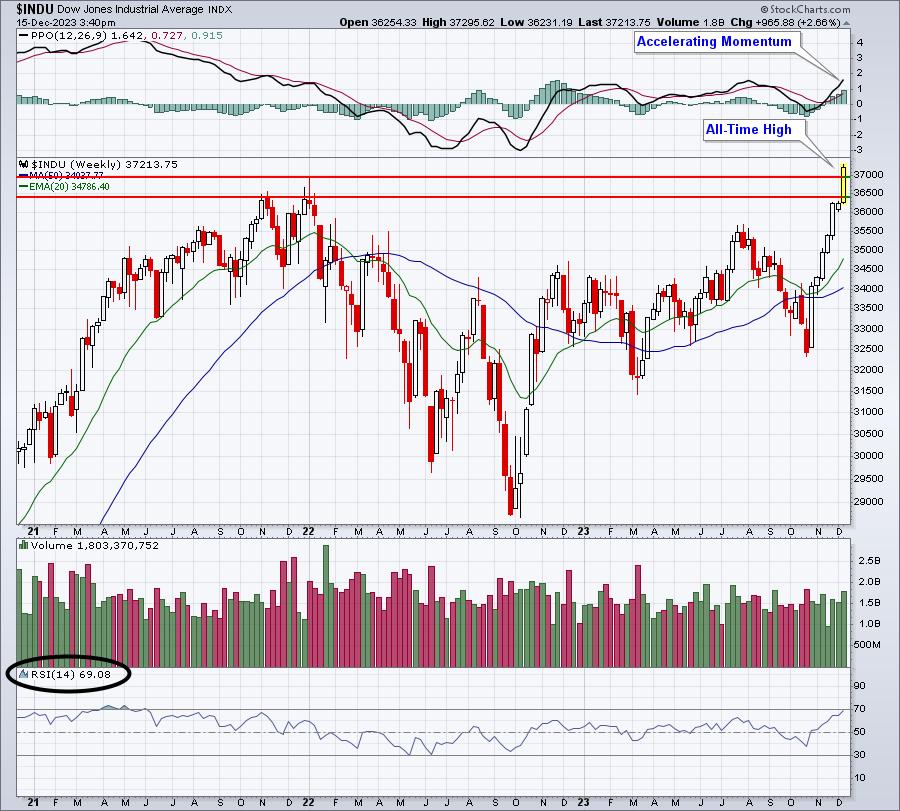
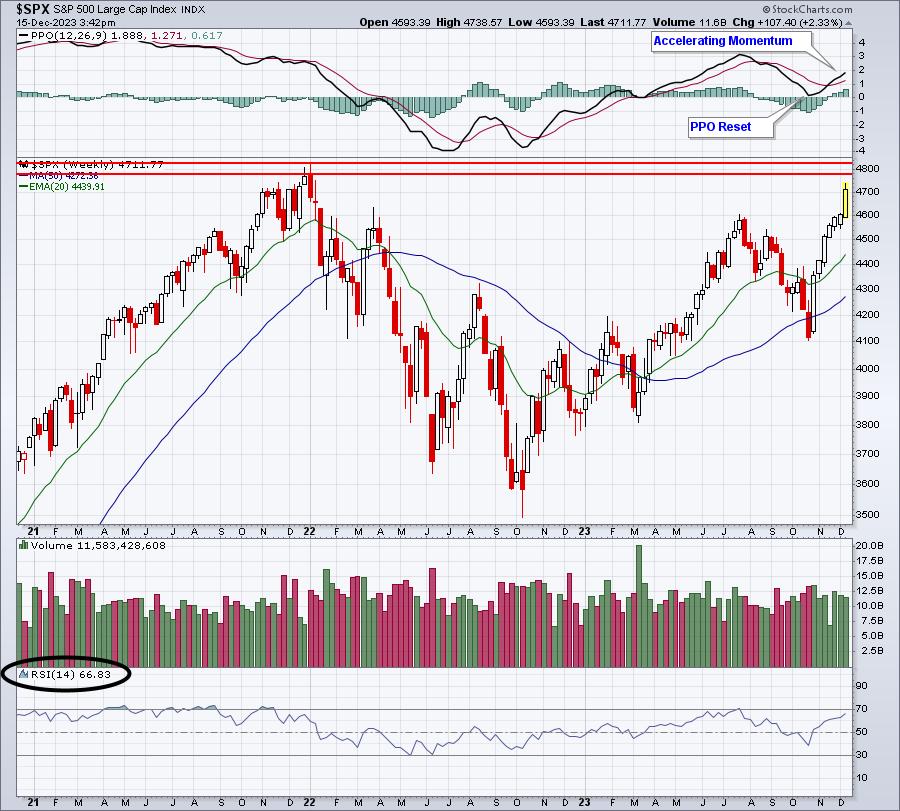
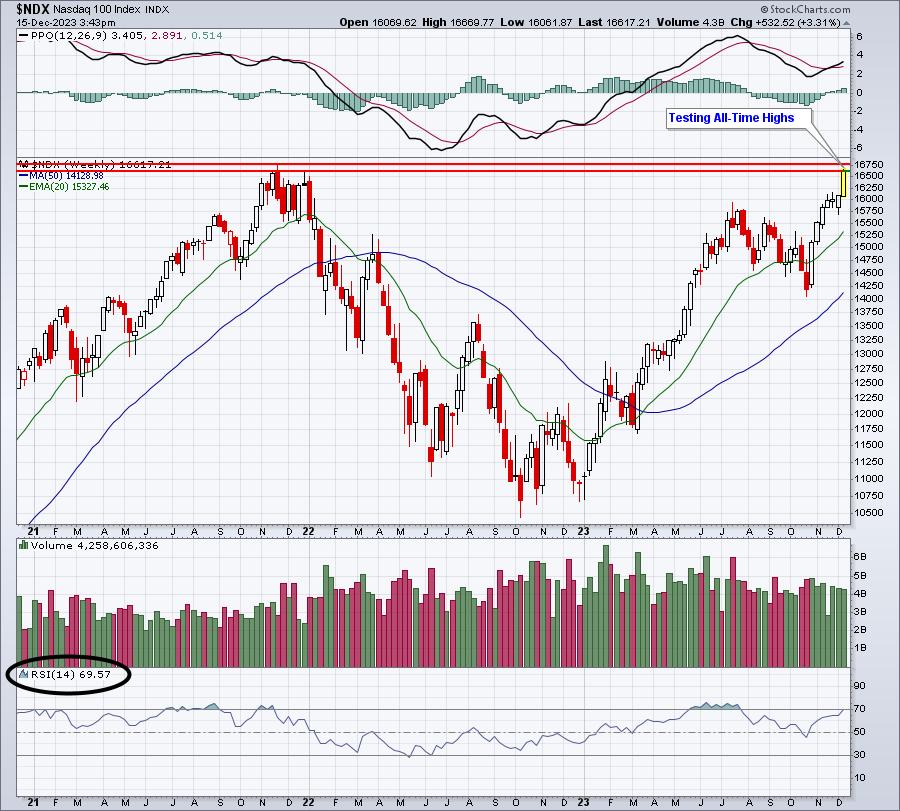
I know there's a general sense of overbought conditions, which on a daily chart is quite true. But if we step back and look at the Dow Jones, S&P 500, NASDAQ 100, and Russell 2000 on a weekly basis, I believe the picture is quite different. Weekly RSI has yet to even hit 70:
Dow Jones:
S&P 500:
NASDAQ 100:
Russell 2000 (IWM):
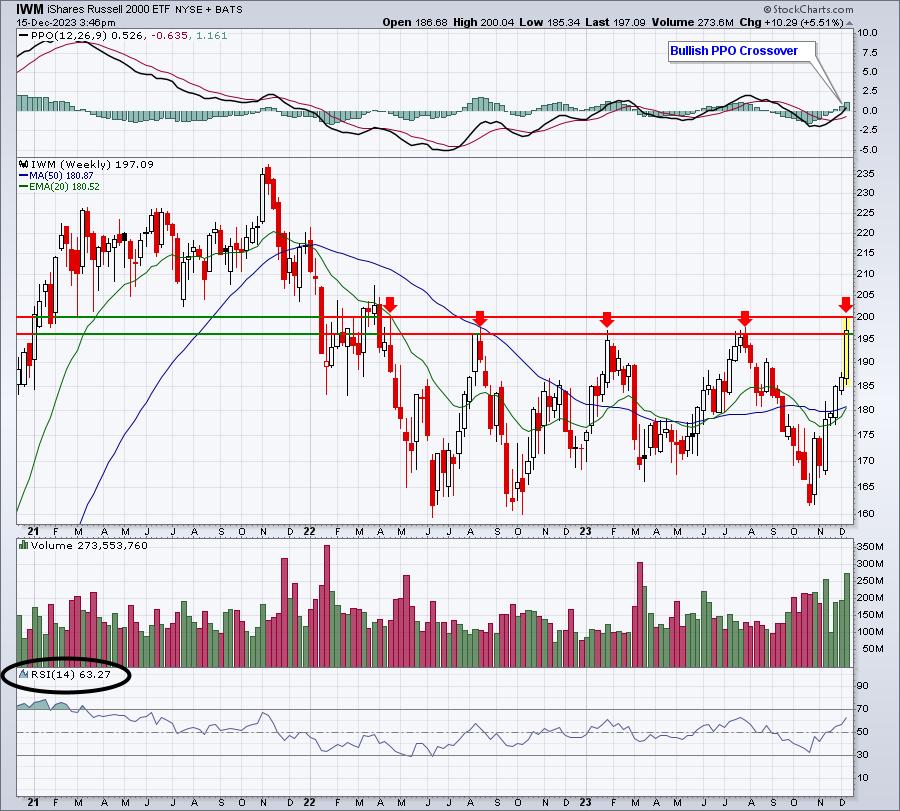
If you look at history, you'll see that weekly RSI hitting 70, and even remaining in the 70s for awhile, is not all that rare. We've struggled the past two years during the 2022 cyclical bear market and the 2023 recovery and correction, which doesn't really allow for the weekly RSI to become overbought and stay there. If you check out prior years, however, that does happen fairly frequently.
None of the weekly RSIs have yet to pierce the 70 level. Remember, overbought indications are SECONDARY indicators. Price and volume is our PRIMARY indicator and both remain strong.
Sector/Industry Focus
It's always important to check out the consumer stocks, especially given that this represents two-thirds of our GDP. It's difficult to argue with a strengthening consumer discretionary (XLY) space:
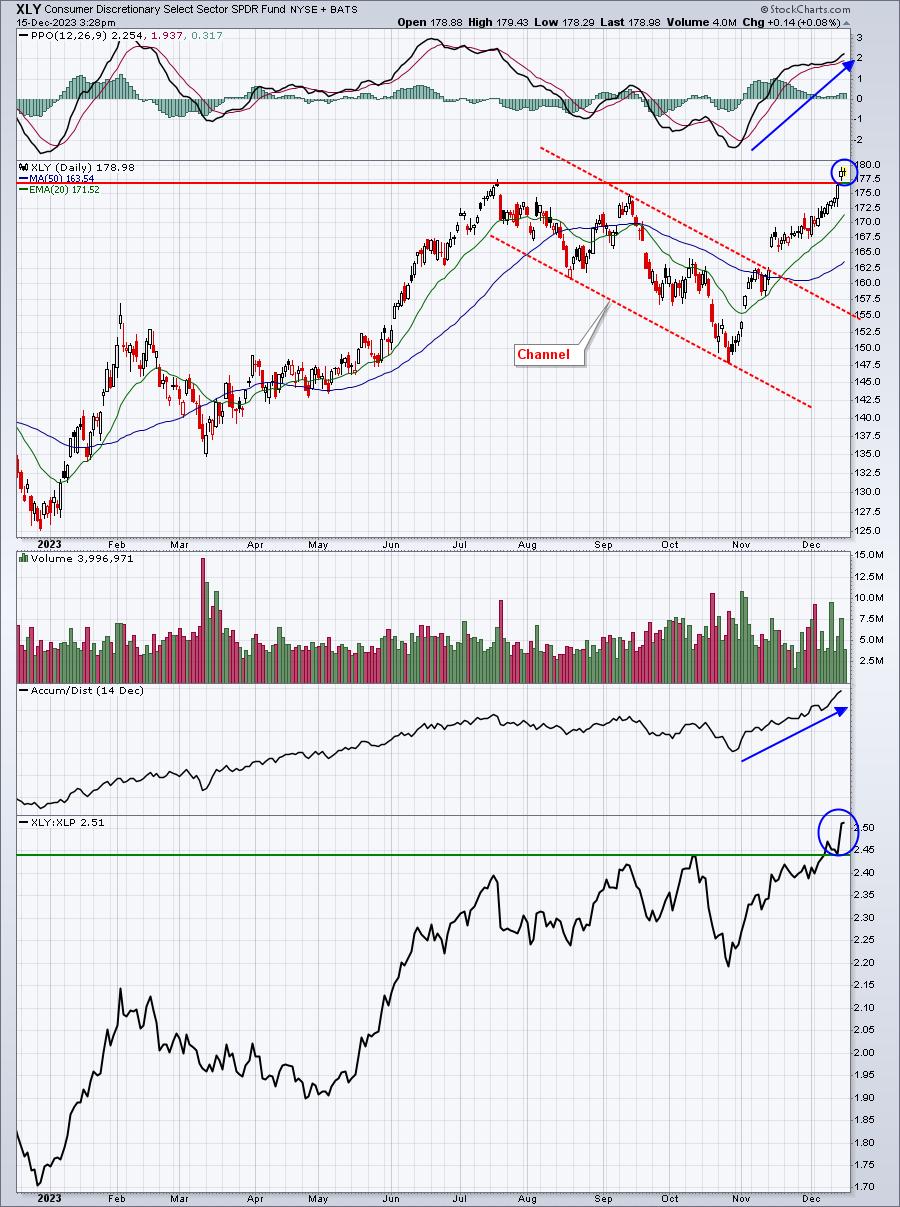
There's so much to like on this chart. To me, the keys on this chart are:
- XLY:XLP ratio breaking out to new highs, suggesting the S&P 500 rally in Q4 is sustainable
- The AD line breaking to new highs, supporting the price breakout above the July high
- The accelerating bullish momentum (PPO) as it's turned up with price action
- Volume accompanying the rally off the October low is solid
ChartLists/Strategies
I was looking through tons of charts on many of our ChartLists and wanted to point out two that could be poised for BIG moves:
NEO:
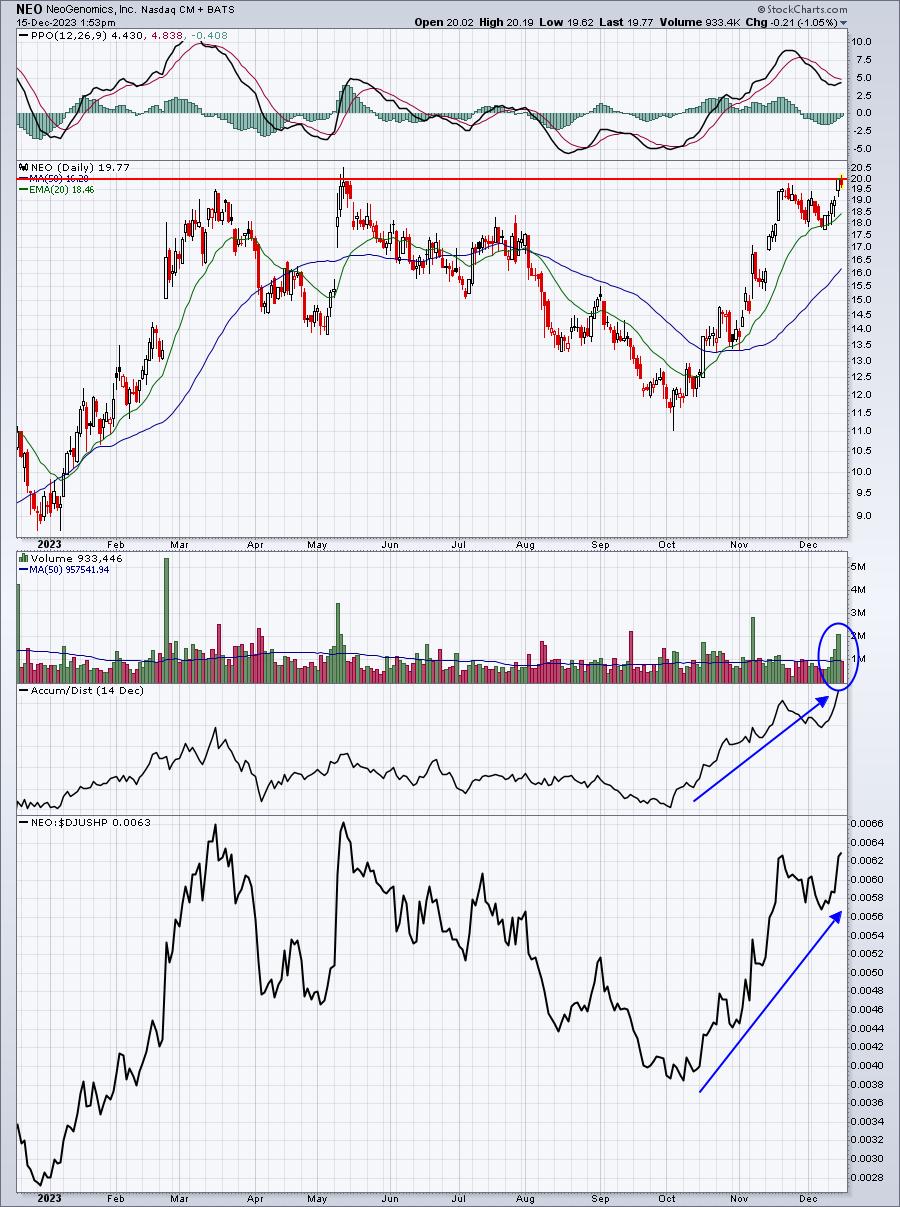
The AD line is soaring, relative strength among its peers is very strong, and now I'm simply waiting on a price breakout. Volume is already expanding, so a move through 20 could lead to very nice gains down the road.
CME:
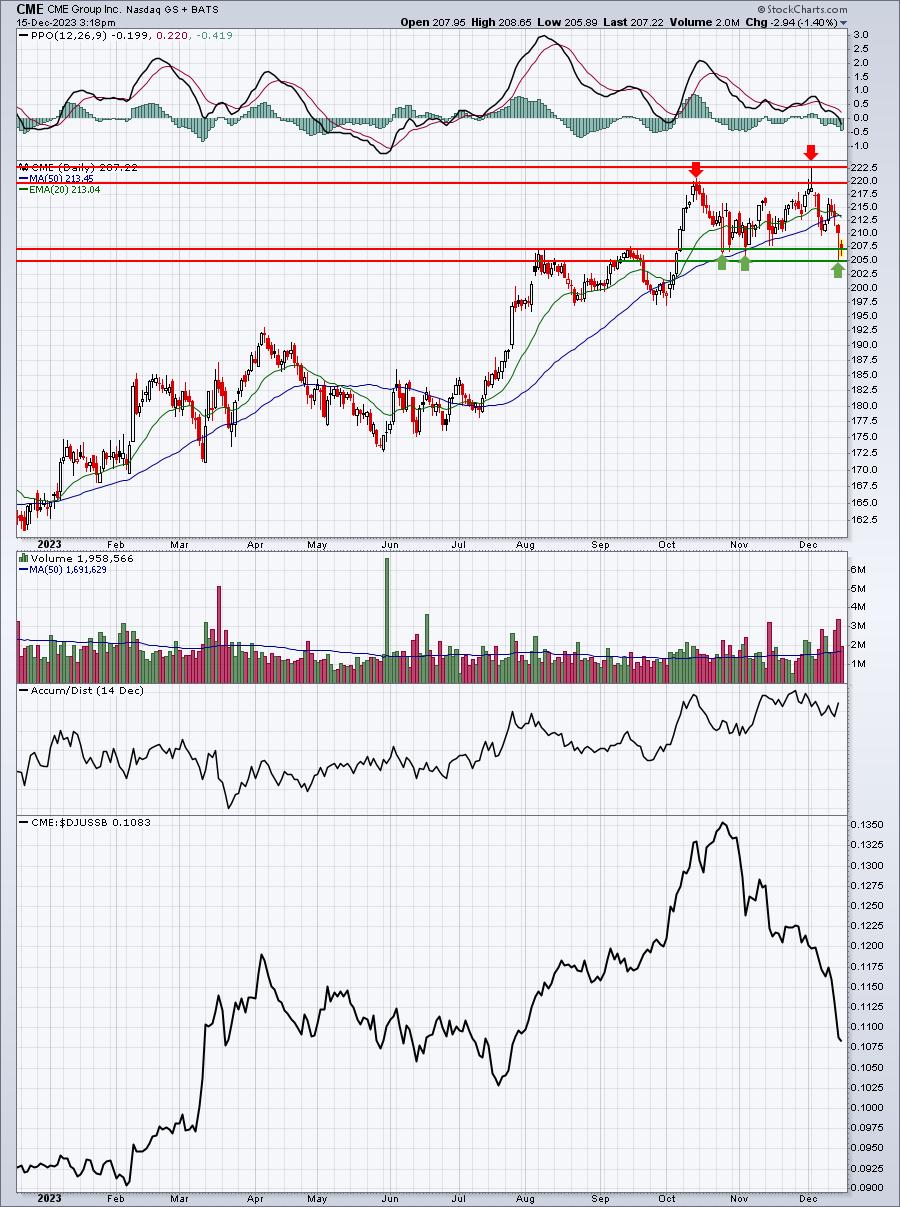
This is a stock that I've traded twice over the past few weeks. The first time was a success, the second a failure, but I believe CME is currently at the most important price point on its chart. The failed breakout to open December established significant resistance from 220.00 to 222.50, while we've now pulled back to a clear support zone from 205.00 to 207.00.
Earnings Reports
Here are the key earnings reports for the next two days, featuring stocks with market caps of more than $10 billion. I also include notable companies with market caps below $10 billion. Finally, any portfolio stocks that will be reporting results are highlighted in BOLD. If you decide to hold a stock into earnings, please understand the significant short-term risk that you are taking. Please be sure to check for earnings dates for any companies that you own or are considering owning.
Friday, December 14:
DRI
Monday, December 15:
HEI
Economic Reports
December empire state manufacturing index: -14.5 (actual) vs. 3.7 (estimate)
November industrial production: +0.2% (actual) vs. +0.3% (estimate)
November capacity utilization: 78.8% (actual) vs. 79.1% (estimate)
Happy trading!
Tom