
EB Daily Market Report - Wednesday, December 20, 2023
MarketVision 2024
MarketVision 2024 has been announced and it's scheduled for Saturday, January 6th, 2024. I'll be providing my roadmap, or forecast, for the entirety of 2024 at this virtual conference. For more information, be sure to CLICK HERE.
All Annual Members will be invited at ZERO cost. If you're not currently an annual member, now would be a great time become one.
Executive Market Summary
- Futures were lower overnight and after starting the day in negative territory, we quickly moved into positive territory once again
- For the first time in awhile, our major indices saw significant afternoon selling and we're threatening to close on the day's low
- The Volatility Index ($VIX, +7.58%), which has been drifting lower and lower as stock prices have soared, came back to life and has jumped back above 13
- Cryptocurrencies have made another big push higher today, with bitcoin ($BTCUSD, +3.37%) leading the way
- Commodities are mostly lower, though fractionally so in most cases
- The 10-year treasury yield ($TNX) continues its free fall, dropping another 6 basis points to 3.86%, a new recent low
- All 11 sectors are lower today, led by utilities (XLU, -1.65%) and consumer staples (XLP, -1.65%), two defensive sectors
- FedEx (FDX, -11.64%) disappointed Wall Street with its most recent quarterly results; it's the worst-performing stock in the S&P 500 today
Market Outlook
It's unusual to see such a blatant change of direction in a low volatility environment, but the initial selling started rather indiscreet as volume was light. As our major indices fell further the volume began to accelerate. Let's look at the SPY as an example:
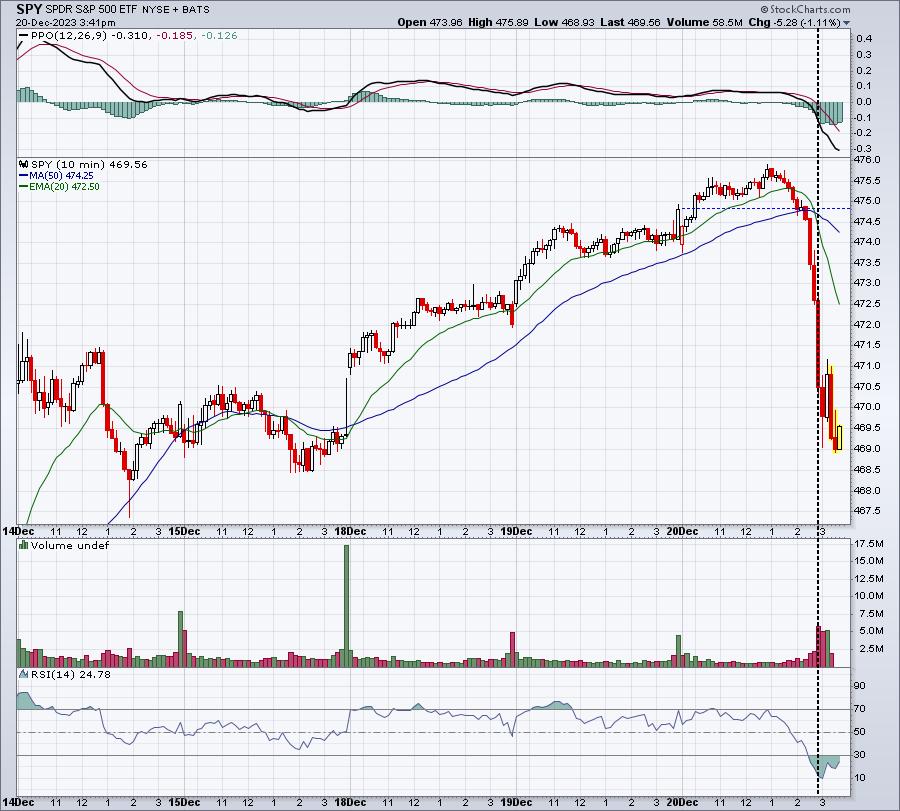
This selling started off quite slowly and only accelerated AFTER the SPY fell close to 1% from its earlier high. In my opinion, market makers grabbed control of the action quite easily and retail traders began to jump on board this selloff after it was well underway. Today's high was an important top, in my view. For now, I'd view the trading range to be today's high as price resistance and the rising 20-day EMA (not pictured above, but currently at 460.53 and rising rapidly) to be the critical support.
Sector/Industry Focus
Earlier today, we had a mixture of sectors moving higher and sectors moving lower. But looking now, ALL 11 sectors are red and it's the first time we've seen this in awhile. I believe market makers began selling this afternoon, which puts the stock market at significant risk in the very near-term. The sector we typically look to for leadership is technology (XLK), but the negative divergence and key reversal today makes this group look riskier in the near-term:
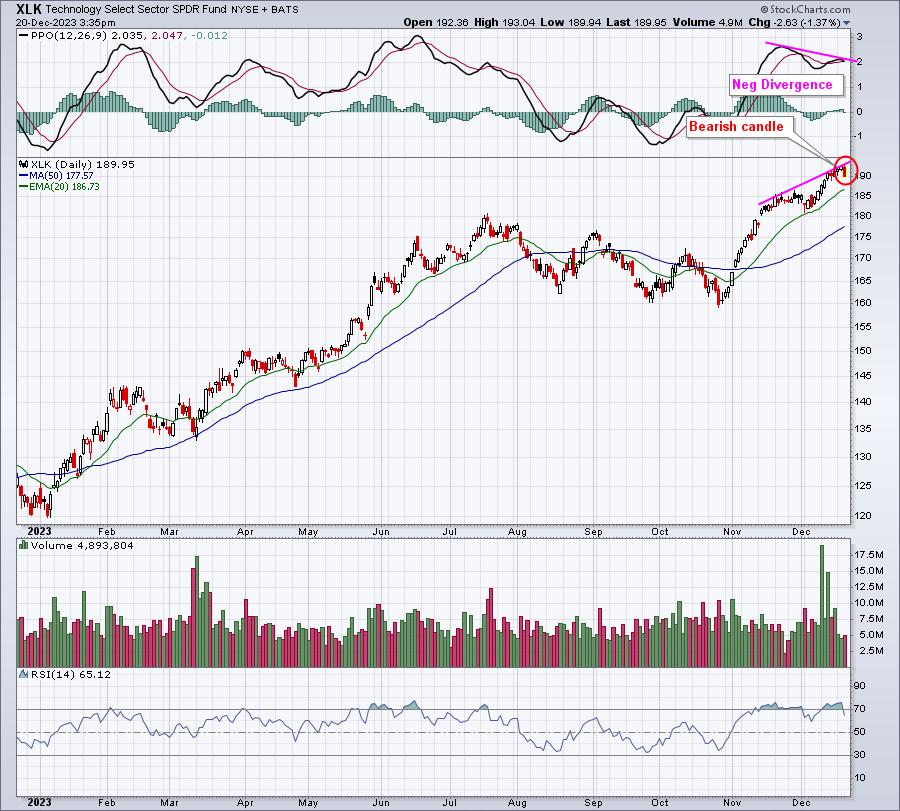
Finishing on the low of the day never is a good look, especially when you take out the low from the last 3 trading days as well. Those with little risk tolerance could back off of long positions in the near-term.
ChartLists/Strategies
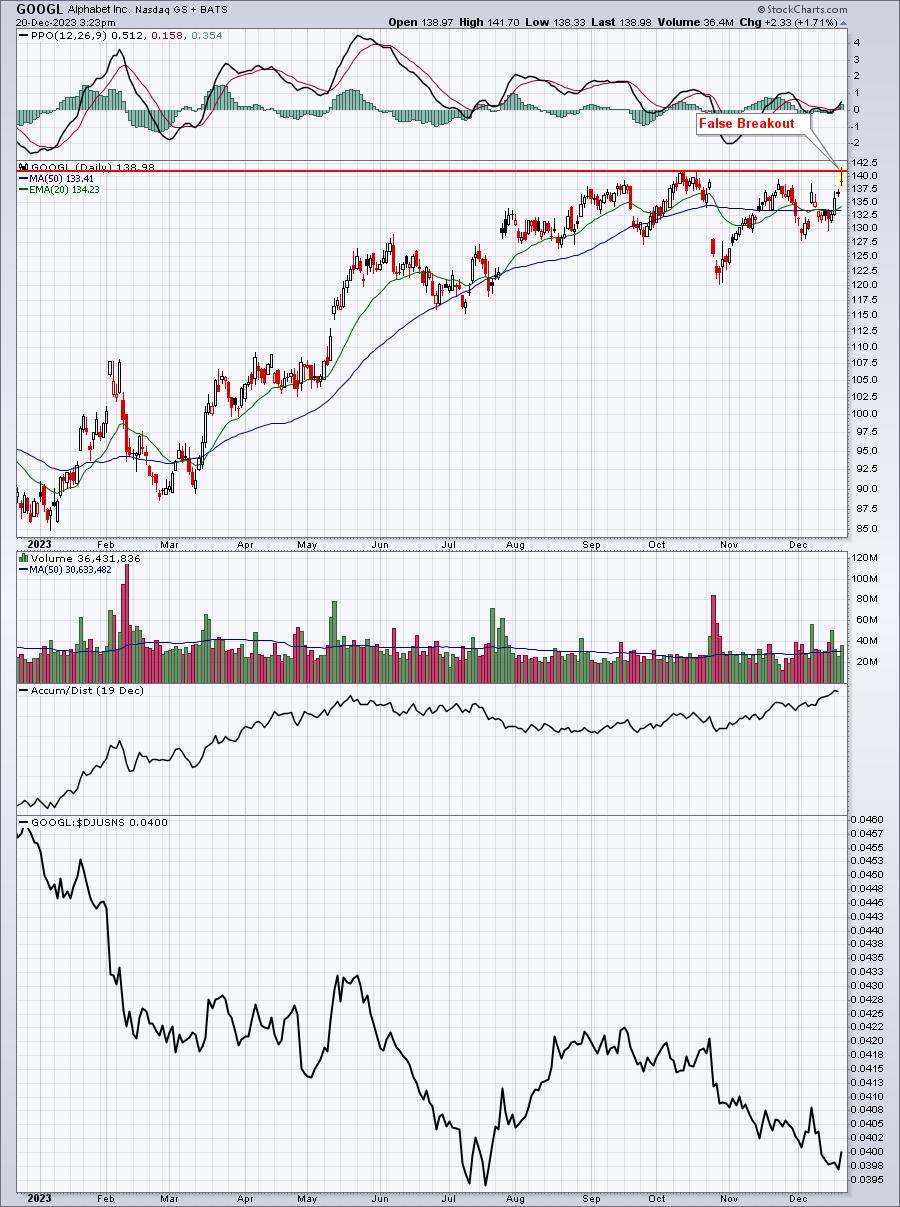
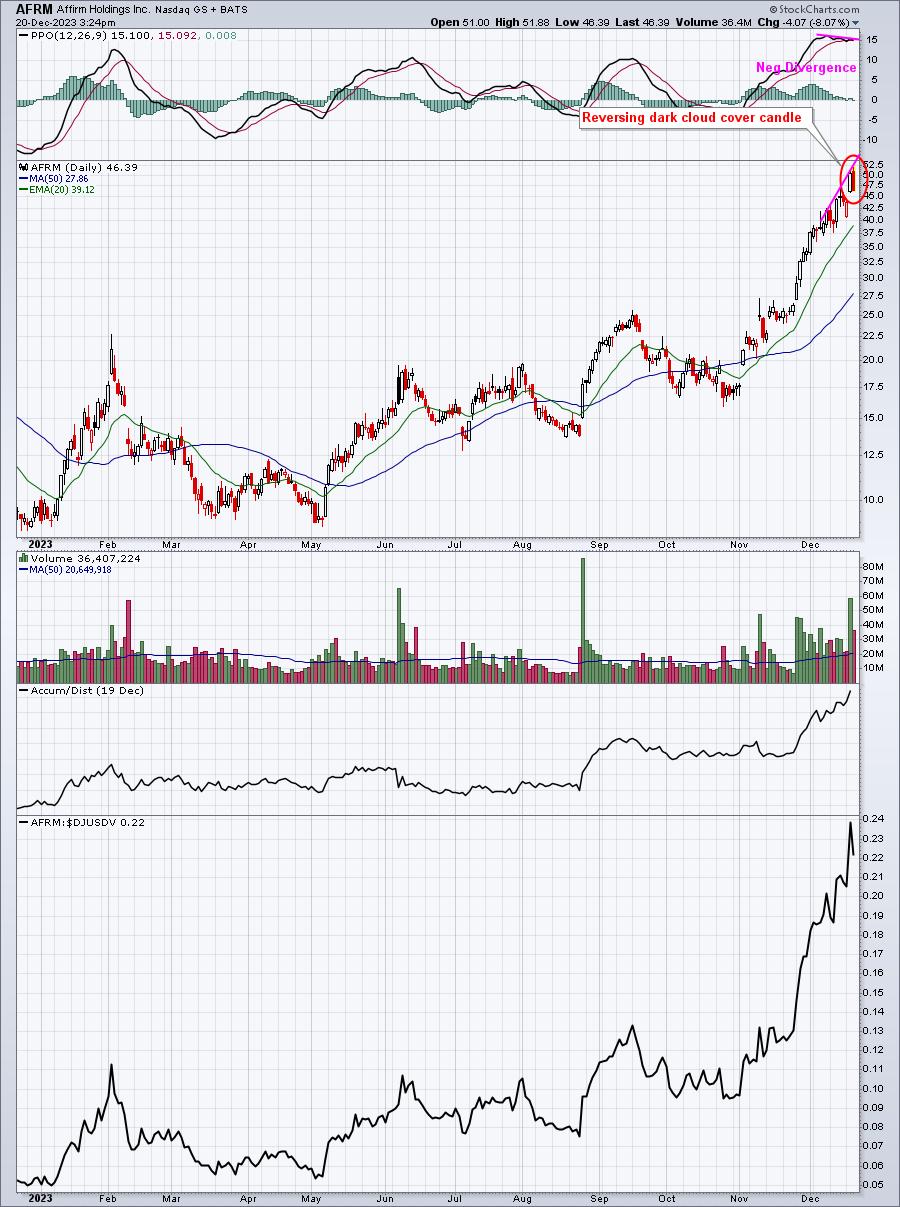
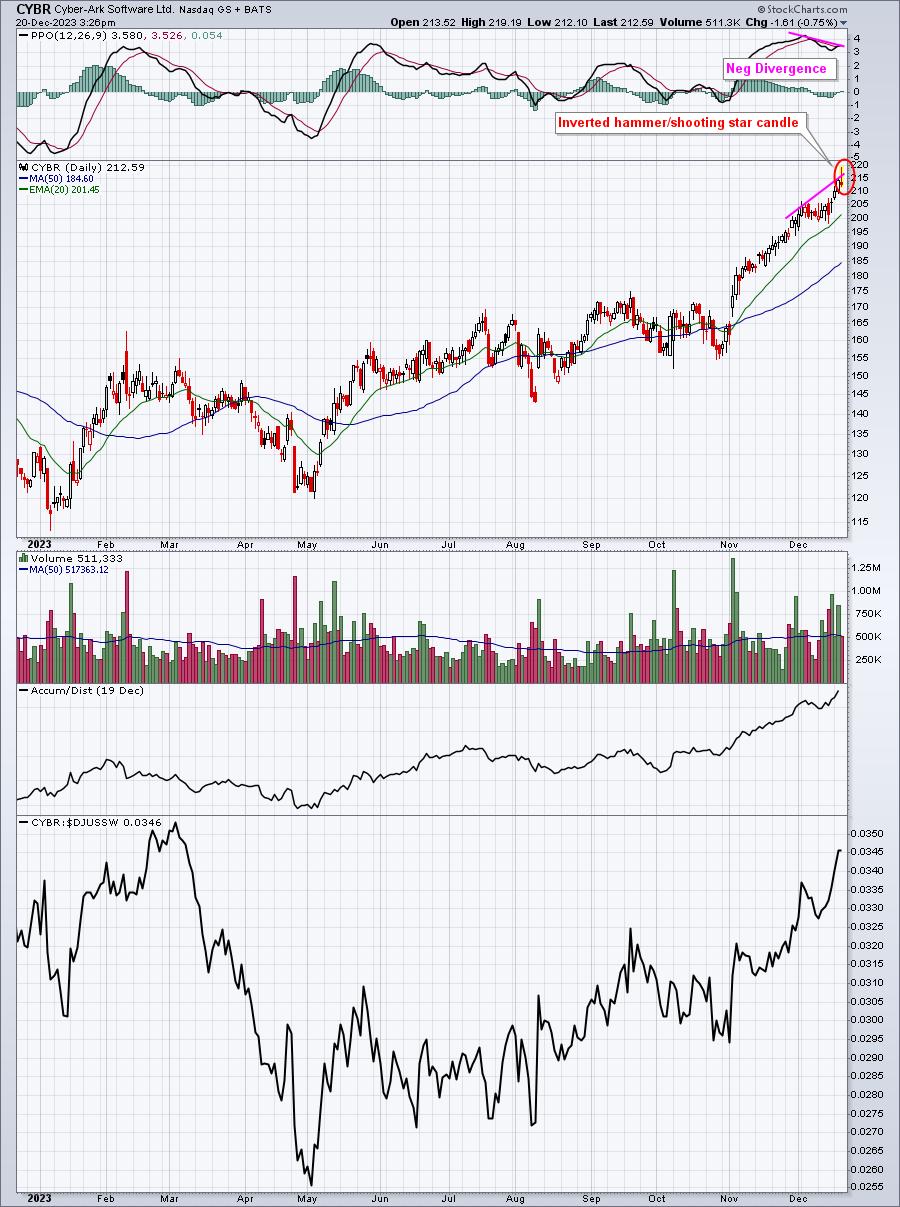
As I mentioned above, we're seeing more weakness this afternoon than we've seen in quite awhile. We already knew we were overbought. If we finish weak, then the odds have at least shifted a bit more bearishly near-term - which is okay by the way. No market goes up every single day. Here are a few stocks that look somewhat damaged from today's reversal (false breakout):
GOOGL:
AFRM:
CYBR:
STRL:
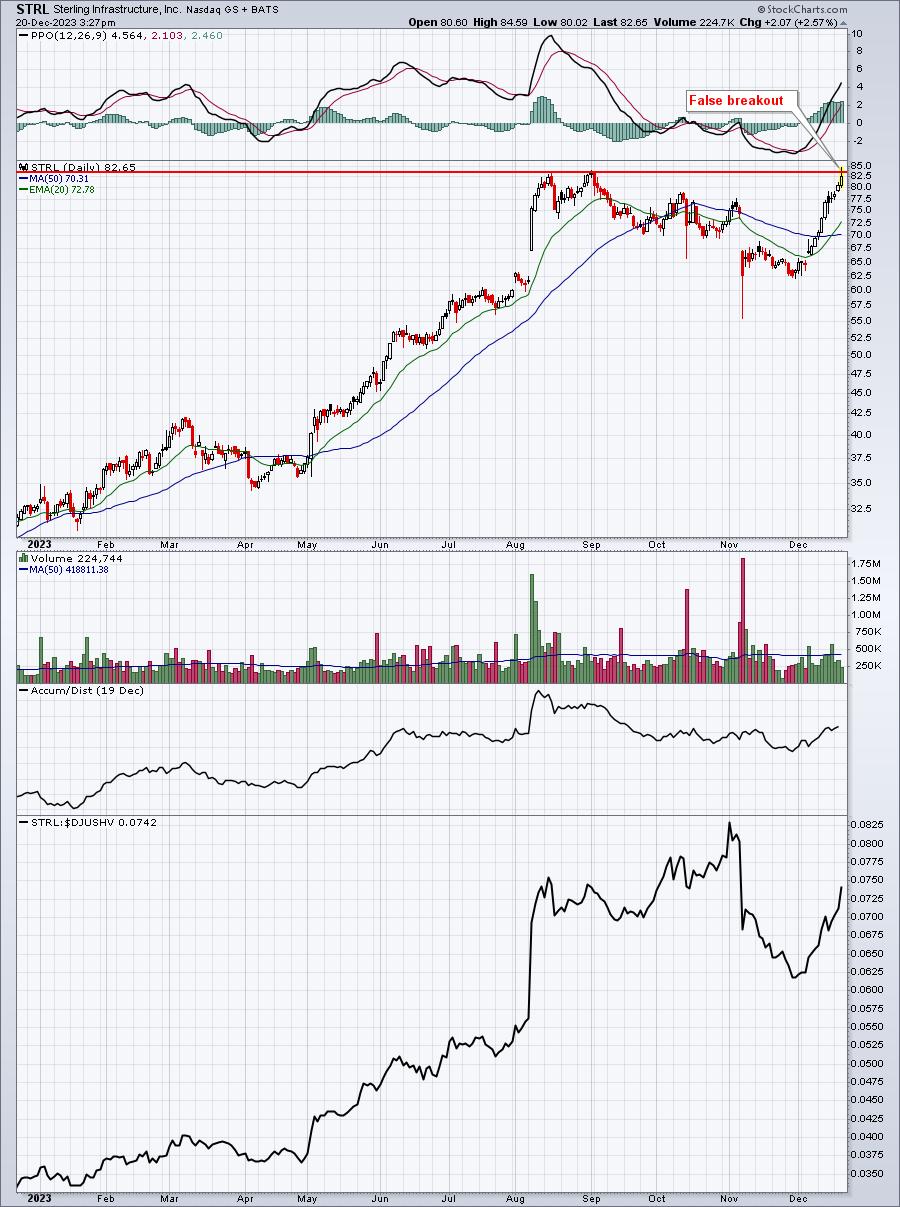
These charts guarantee us NOTHING tomorrow or next week or even next month. What these short-term candles signal, however, is HIGHER RISK short-term. So, if your goal is to mitigate short-term risk, then I'd sell. Of these, I'd rank GOOGL as the one with the least amount of risk as its PPO is just beginning to turn higher, there's no negative divergence and it's part of an industry group - internet ($DJUSNS) - that I like heading into 2024.
The one with the most risk, in my opinion, would be CYBR. It's run up nearly 50% in 2 months, it has a negative divergence, and it's ridiculously overbought. The shooting star/inverted hammer candle is a short-term bearish candle when it appears after an extended uptrended. All of these factors suggest this is the one that carries to most risk by holding.
Earnings Reports
Here are the key earnings reports for the next two days, featuring stocks with market caps of more than $10 billion. I also include notable companies with market caps below $10 billion. Finally, any portfolio stocks that will be reporting results are highlighted in BOLD. If you decide to hold a stock into earnings, please understand the significant short-term risk that you are taking. Please be sure to check for earnings dates for any companies that you own or are considering owning.
Wednesday, December 20:
MU, GIS, TTC, BB, WGO
Thursday, December 21:
NKE, CTAS, PAYX, CCL, KMX, CUK, AIR
Economic Reports
December consumer confidence: 110.7 (actual) vs. 103.4 (estimate)
November existing home sales: 3,820.000 (actual) vs. 3,775,000 (estimate)
Happy trading!
Tom