
EB Daily Market Report - Thursday, December 21, 2023
Upcoming Schedule
As we head towards the end of the year, and on behalf of the entire EarningsBeats.com team, I want to thank all of you for supporting us throughout 2023 and to wish everyone happy holidays and a bright, healthy, and happy new year ahead!
The upcoming holidays are important to spend with family and friends. Accordingly, our schedule through January 1st will be limited. We will monitor our email throughout the holidays, but otherwise we'll work limited hours. The following is a summary of our key services and what you can expect over the next couple weeks:
- Trading Places LIVE on YouTube will return on Tuesday, January 2nd at 9:00am ET; there will be no shows next week
- There will be no LIVE trading room Wednesday, December 27th at 10:00am ET
- I will likely publish 1 or 2 Daily Market Reports, but it's doubtful that I'll publish a Weekly Market Report; I may consider doing a Weekly Market Report for Tuesday, January 2nd
- I will most likely publish a Weekly Portfolio Report the weekend before New Years Day, but doubtful that I can get one out the weekend before Christmas Day
- Most ChartLists will be updated over the holidays
- The January Seasonality Report should be published prior to New Years Day
MarketVision 2024
MarketVision 2024 has been announced and it's scheduled for Saturday, January 6th, 2024. I'll be providing my roadmap, or forecast, for the entirety of 2024 at this virtual conference. For more information, be sure to CLICK HERE.
All Annual Members will be invited at ZERO cost. If you're not currently an annual member, now would be a great time become one - to save up to $697.
Executive Market Summary
- Futures were strong overnight and we saw gap ups across our major indices
- After a period of weakness during the morning session, stocks are recovering and trying to recapture the opening gaps
- The 10-year treasury yield ($TNX), down earlier, is now up a basis point to 3.89%
- Crude oil ($WTIC, -0.57%) has pulled back slightly, but still remains close to $74 per barrel
- 10 of 11 sectors are higher today, with consumer discretionary (+1.33%) on top; health care (XLV, +1.05%) and technology (XLK, +1.00%) are the other two sectors up at least 1%
- Utilities (XLU, -0.16%) is the only sector in negative territory
- Recreational services ($DJUSRQ, +3.99%) and automobiles ($DJUSAU, +2.92%) are leading discretionary stocks higher
- Micron Technology (MU, +9.20%) and Cintas Corp (CTAS, +6.33%) are leading the S&P 500 today and also breaking out, following better-than-expected quarterly earnings reports
Market Outlook
Because we will not be providing a Weekly Market Report for Monday (Christmas Day - market closed), I want to provide this Big Picture chart, so everyone can step back and see the long-term stock market picture with perspective:
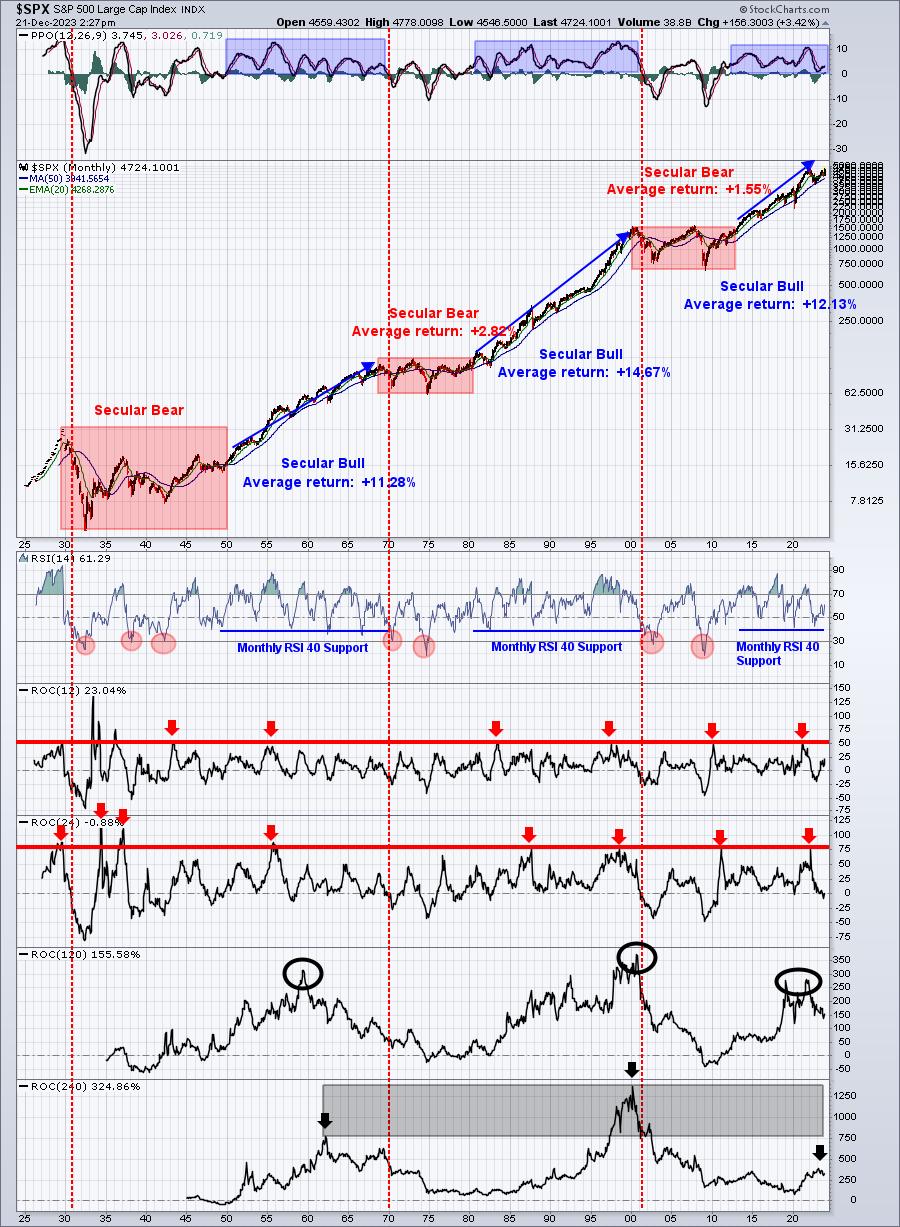
The bottom panel highlights the 240-month (20 years) rate of change (ROC). Because secular bull markets tend to last two decades, we'll see this 240-month ROC will usually peak during the second decade. During the 1950s and 1960s, that peak occurred at about 750%, while the 1980s and 1990s peaked at nearly 1400%. Bears that believe the market has run too far would suggest that our 240-month ROC at 324% is just too much. I beg to differ. I believe the US economy is the strongest in the world and when we consider where the 240-month ROC might ultimately reach during this secular bull market, my guess would be WAY above the current level, perhaps somewhere between the peaks of the two prior secular bull markets. This move to at least 750% will occur, because of two reasons - (1) higher S&P 500 prices ahead, and (2) the timing of the 20-year ROC calculation. Right now, the 324% calculation is based on our advance from December 2003 through December 2023. Remember the low of 666 came in 2009. When we get to 2029, this 240-month ROC will be based off of that historic low. 1000% would take us to about 7300. If we were to approach the 1999 high of 1400%, we could see an S&P 500 that approaches 10,000 - more than double where we are right now. Think about that.
Sector/Industry Focus
Let's take a quick look at sentiment and see where the 5-day SMA of the equity only put call ratio ($CPCE) stands:
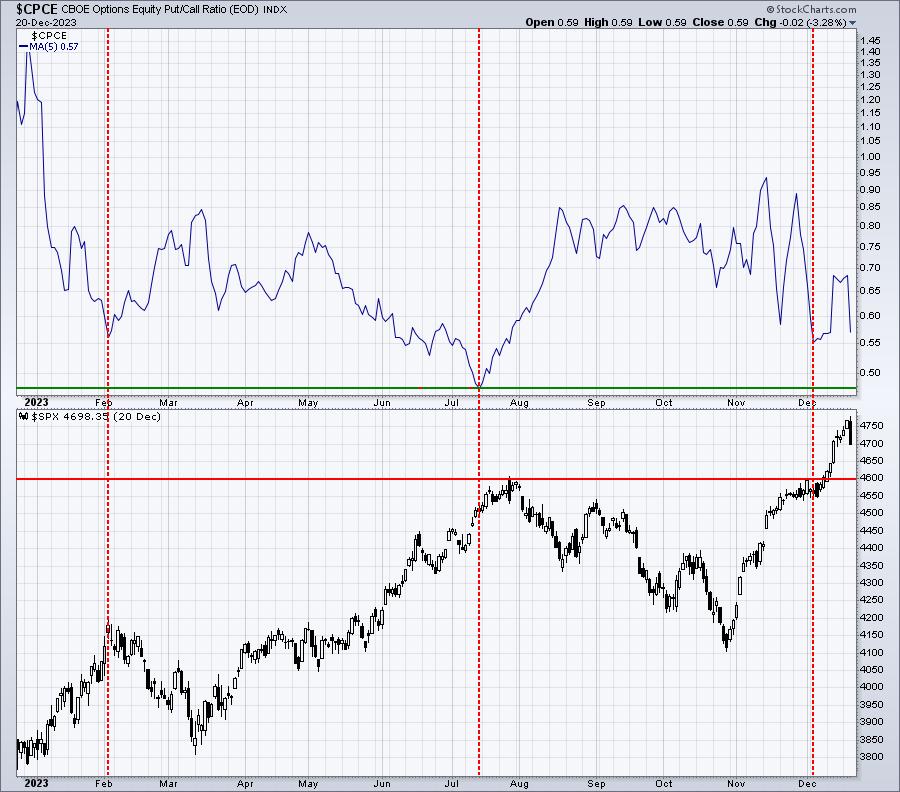
This simply shows the past year and we have to remember that Q4 readings have been skewed by the abnormally high CPCE readings on several Wednesdays. Similar to Q4 2022, hedge funds have initiated equity puts on many of the largest market cap stocks like AAPL, MSFT, GOOGL, AMZN, NVDA, TSLA, META, etc. These equity puts do not provide us a measure of greed or fear on the part of retail traders, so they should be ignored. The current 5-day SMA of .57 is not impacted by these hedge fund equity put purchases, because we didn't seen any of this activity yesterday. So the last 5 days have represented normal retail trading behavior. Historically, 5-day readings at or below .55 are worth watching as possible topping signals and certainly those under .50 are relatively rare.
We'll need to watch to see if this 5-day SMA declines further, but right now the .57 reading, while skewed a bit towards the bullish side, isn't providing us any kind of crazy reading - at least not when we compare it to history. Also, these CPCE readings are a bit like oversold indicators. They can remain overbought for awhile before selling kicks in. Panicked CPCE readings that approach .80-.85 tend to be much more reliable in calling bottoms than readings near .50 are in calling tops. That's based on my opinion from following this CPCE reading for years.
ChartLists/Strategies
In our LIVE Trading Room yesterday, I mentioned that energy (XLE) hasn't really participated in the huge advance off the October low. It's been strengthening and could have further upside here into year end. PARR is a relative leader, so it stands to reason that it could make the breakout below if energy strengthens:
PARR:
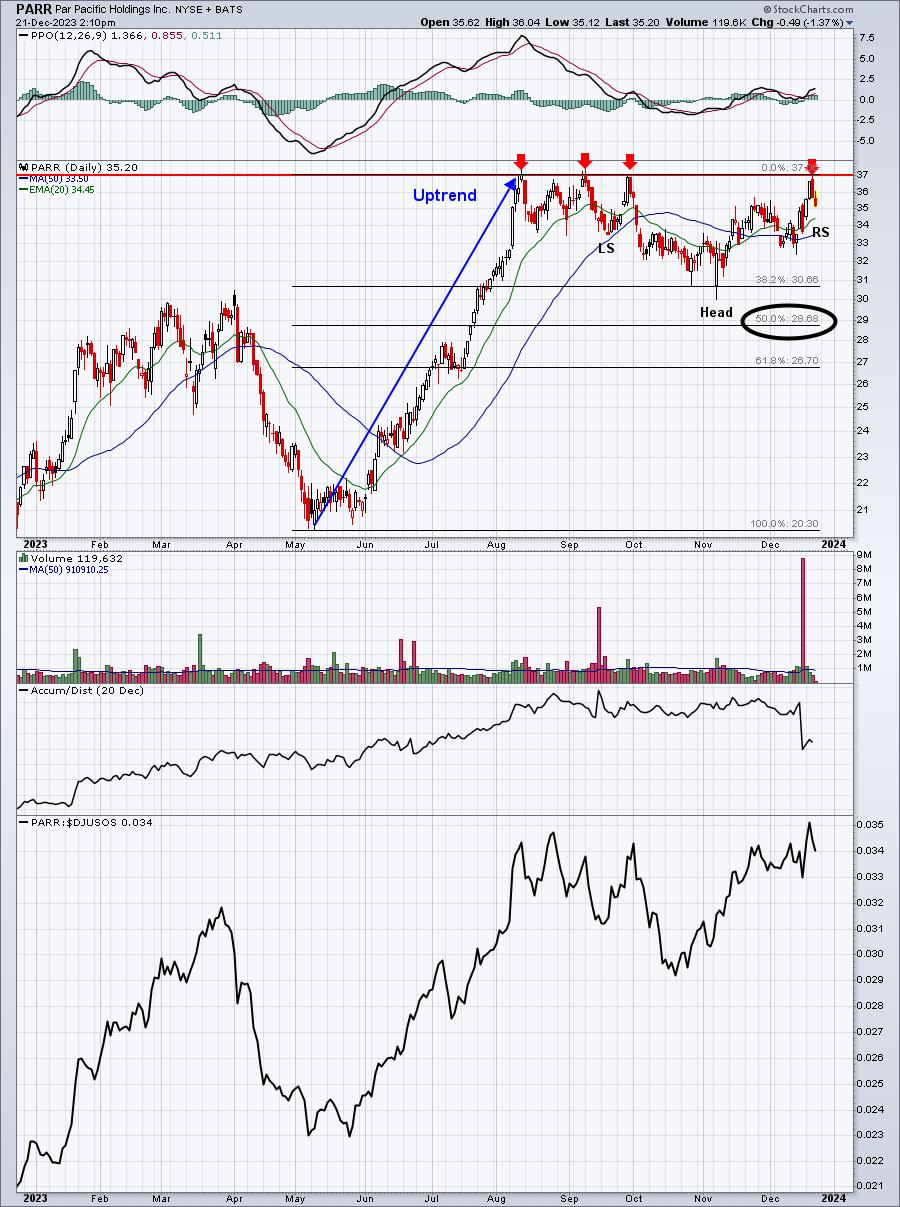
PARR appears to be consolidating in an inverse head & shoulders pattern, with the required ingredients present. First, we have a clear uptrend. You can't really have a continuation pattern if you don't have a prior trend in place. No problem here. Also, when a continuation pattern prints, you don't want to see the bottom of that pattern eclipse the 50% pullback. The Fibonacci retracement tool shows that 50% level to be 28.68. The inverse head, in this case, bottomed at 30. Check. Finally, this latest pullback could be establishing an inverse right shoulder. The best time, in my opinion, to get into a pattern like this is when it appears the inverse right shoulder is complete. Note that the inverse left shoulder printed near 33.50. So a symmetrical pattern would see an inverse right shoulder at approximately the same level. Note that this level would also be very close to the 50-day SMA, also at 33.50 currently. A stop could be considered near the 32.50 level, the recent price low. That low cannot be the inverse right shoulder, because you have to print the right side of a neckline before an inverse right shoulder can print.
This pattern would measure to 43-44 upon confirmation of a neckline breakout.
One other stock that I've mentioned recently is NeoGenomics (NEO). It appears to be making a breakout today above key resistance. A strong finish would be welcome:
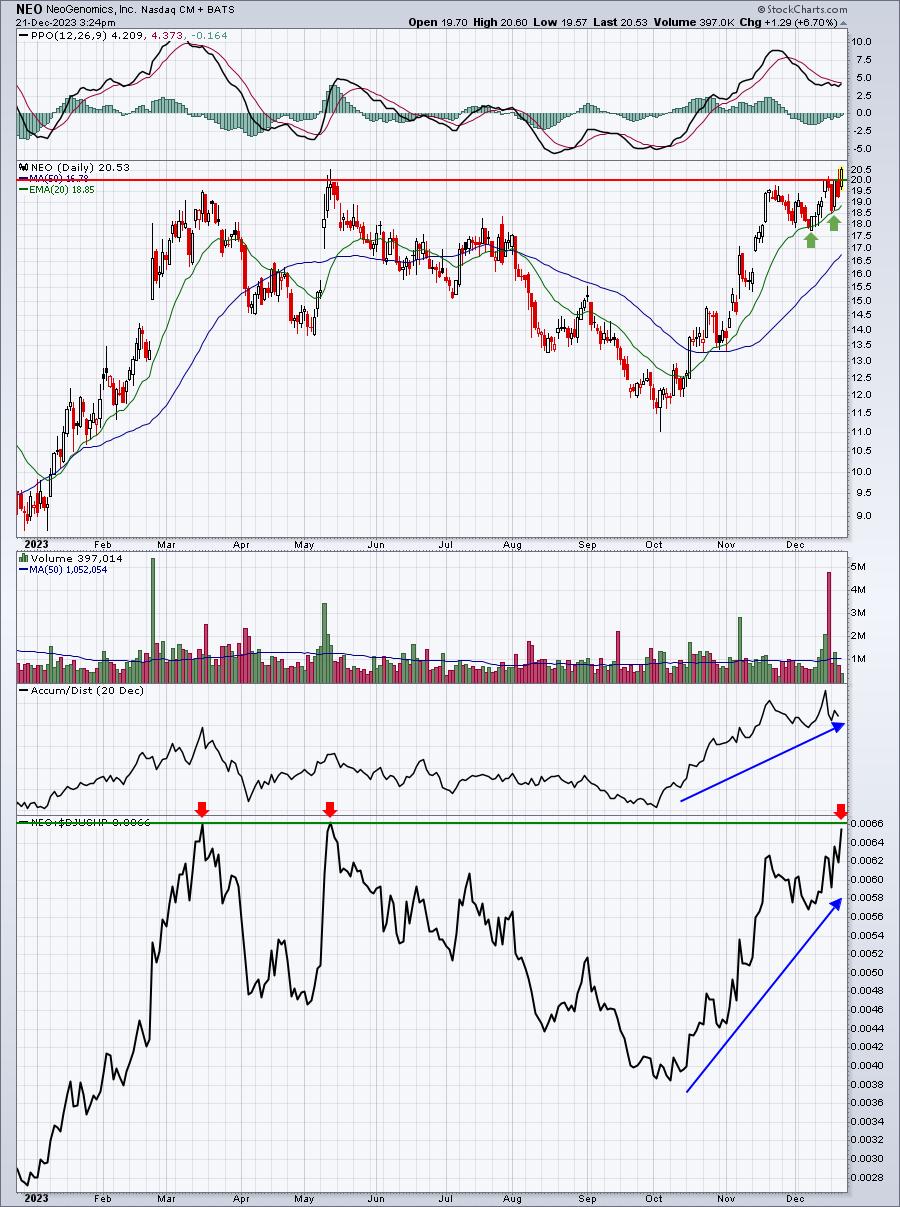
In a perfect world, the volume would be stronger, so increasing volume into the close, while holding onto the breakout level, would be bullish. NEO is a strong stock among its health care provider peers ($DJUSHP). NEO is also in our Aggressive Portfolio. I like to trade portfolio stocks as they're typically excellent relative performers.
(Full Disclosure: I own shares in NEO)
Earnings Reports
Here are the key earnings reports for the next two days, featuring stocks with market caps of more than $10 billion. I also include notable companies with market caps below $10 billion. Finally, any portfolio stocks that will be reporting results are highlighted in BOLD. If you decide to hold a stock into earnings, please understand the significant short-term risk that you are taking. Please be sure to check for earnings dates for any companies that you own or are considering owning.
Thursday, December 21:
NKE, CTAS, PAYX, CCL, KMX, CUK, AIR
Friday, December 22:
None
Economic Reports
Q3 GDP (final): 4.9% (actual) vs. 5.2% (estimate)
Initial jobless claims: 205,000 (actual) vs. 210,000 (estimate)
November Philadelphia Fed manufacturing index: -10.5 (actual) vs. -3.0 (estimate)
November leading indicators: -0.5% (actual) vs. -0.5% (estimate)
Happy trading!
Tom