
EB Daily Market Report - Special Pre-Holiday Report - Friday, December 22, 2023
Upcoming Schedule
As we head towards the end of the year, and on behalf of the entire EarningsBeats.com team, I want to thank all of you for supporting us throughout 2023 and to wish everyone happy holidays and a bright, healthy, and happy new year ahead!
The upcoming holidays are important to spend with family and friends. Accordingly, our schedule through January 1st will be limited as we spend more time with our family and friends. We will monitor our email throughout the holidays, but otherwise we'll work limited hours. The following is a summary of our key services and what you can expect through New Year's Day:
- Trading Places LIVE on YouTube will return on Tuesday, January 2nd at 9:00am ET; there will be no shows next week
- There will be no LIVE trading room Wednesday, December 27th at 10:00am ET
- I will likely publish 1 or 2 Daily Market Reports, but it's very unlikely that I'll publish a Weekly Market Report; I may consider doing a Weekly Market Report for Tuesday, January 2nd
- I will most likely publish a Weekly Portfolio Report the weekend before New Year's Day, but doubtful that I can get one out this weekend before Christmas Day
- Most ChartLists will be updated over the holidays
- The January Seasonality Report should be published prior to New Year's Day
- There will be no EB Digests on Christmas Day or on New Year's Day, but I'll likely publish one on Wednesday and Friday next week
MarketVision 2024
MarketVision 2024 has been announced and it's scheduled for Saturday, January 6th, 2024. I'll be providing my roadmap, or forecast, for the entirety of 2024 at this virtual conference. For more information, be sure to CLICK HERE.
All Annual Members will be invited at ZERO cost. If you're not currently an annual member, now would be a great time become one - to save up to $697.
Special Update
Since Monday is a holiday and I will not be providing a Weekly Market Report (WMR) for this week, I wanted to provide you a few charts that I usually include in the WMR.
Sentiment
One thing that history teaches us is that once the 253-day SMA of the equity only put call ratio ($CPCE) turns lower from extremely high readings, the ensuing decline in that moving average typically accompanies a big more higher in the S&P 500. Here's a chart to illustrate:
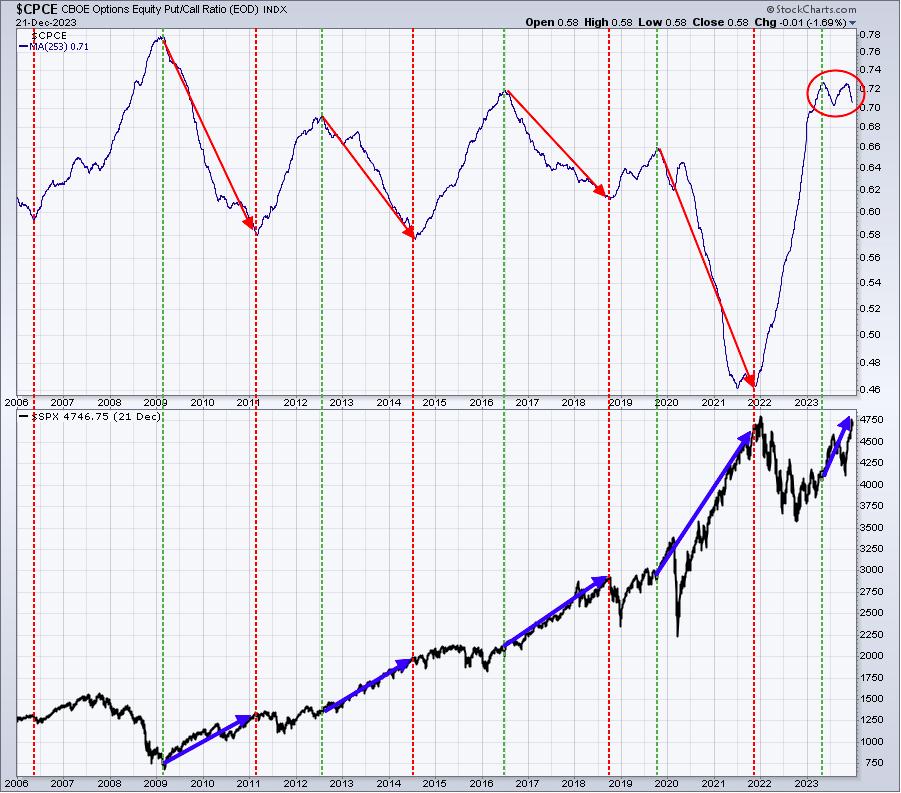
It looks to me like we're finally seeing this 253-day SMA roll over, which is a very good sign for U.S. equities as we approach 2024. I will point out that this is the UNADJUSTED 253-day SMA. I also use the User-Defined Index (UDI) to keep my own ADJUSTED 253-day SMA. This UDI adjusts the dozen or so high readings in Q4 2022 and Q4 2023 for unusually high Wednesday readings related to large equity put purchases on large cap stocks. Articles were published in 2022 that indicated hedge funds were buying unusually heavy equity puts for protection. These protective put purchases are much different than equity puts being purchased by retail traders. The latter type provide us the sentiment of retail traders in order to help us assess potential tops and bottoms in the S&P 500. Here's what this ADJUSTED view looks like through yesterday's close:
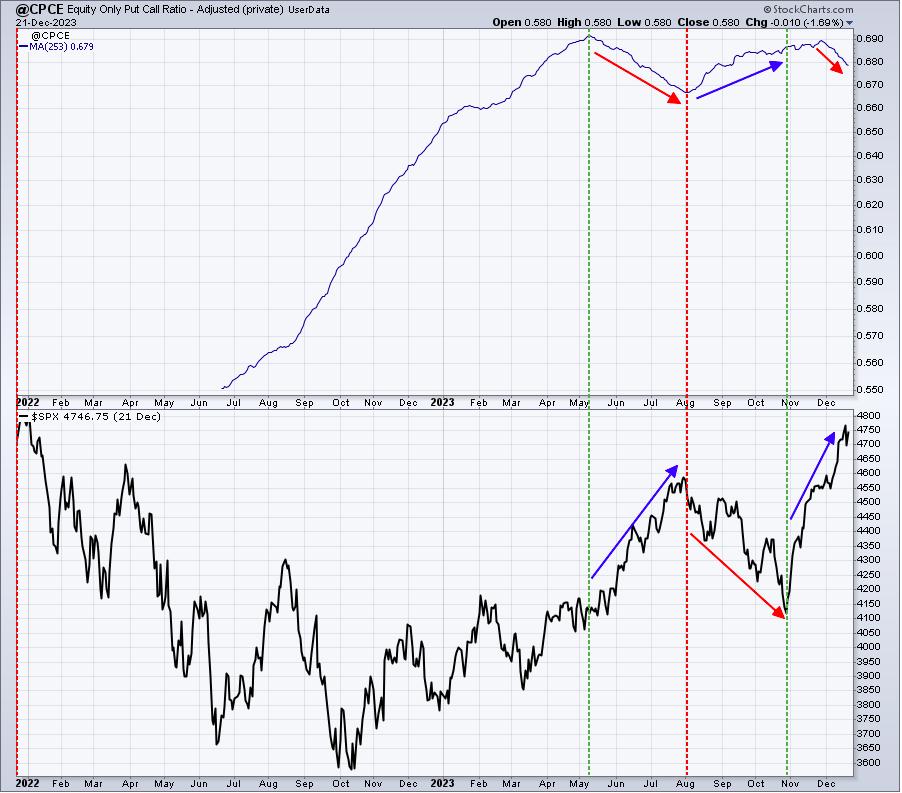
The UNADJUSTED chart is accurate until Q4 2022. So for this ADJUSTED chart, the UDI begins in the summer of 2022. I tend to follow this ADJUSTED chart much more closely over the past 15 months or so, because those huge hedge-fund-related equity purchases are eliminated. Prior to the last 15 months, the UNADJUSTED chart is fine to use. Anyhow, when you look at the ADJUSTED chart, the current downtrend is much more obvious. In my opinion, this chart provides significant support for the bulls' argument that the S&P 500 is heading higher.
Intermarket Analysis
My favorite intermarket ratio is the XLY:XLP. I like to see this ratio moving up while the S&P 500 moves up, because it tells us that the big Wall Street firms, and the overall market, is in a "risk on" environment, which is important to drive prices higher. Here's this XLY:XLP ratio as of Thursday's close:
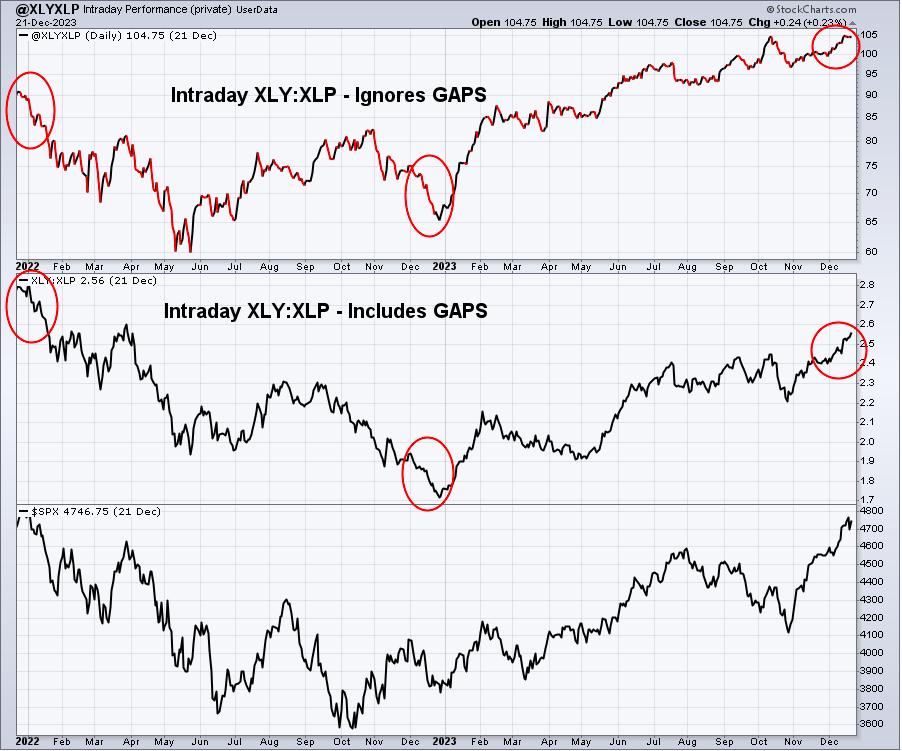
I can't find any bearishness in this chart. The current ratio between discretionary (XLY) and staples (XLP) supports the current action and further gains ahead.
Another chart that I follow closely is QQQ:SPY. The QQQ represents the more growth-oriented NASDAQ 100. While there are plenty of growth stocks in the S&P 500, this index does have many more value-oriented companies in it. As a result, any move higher in the QQQ:SPY also supports the idea that a move higher in U.S. equities is sustainable. While the NAME of this chart is "@SPYQQQ", it's just a name. The actual calculation is based on QQQ vs. SPY. In other words, when this ratio moves higher, it's because the QQQ is outperforming the SPY.
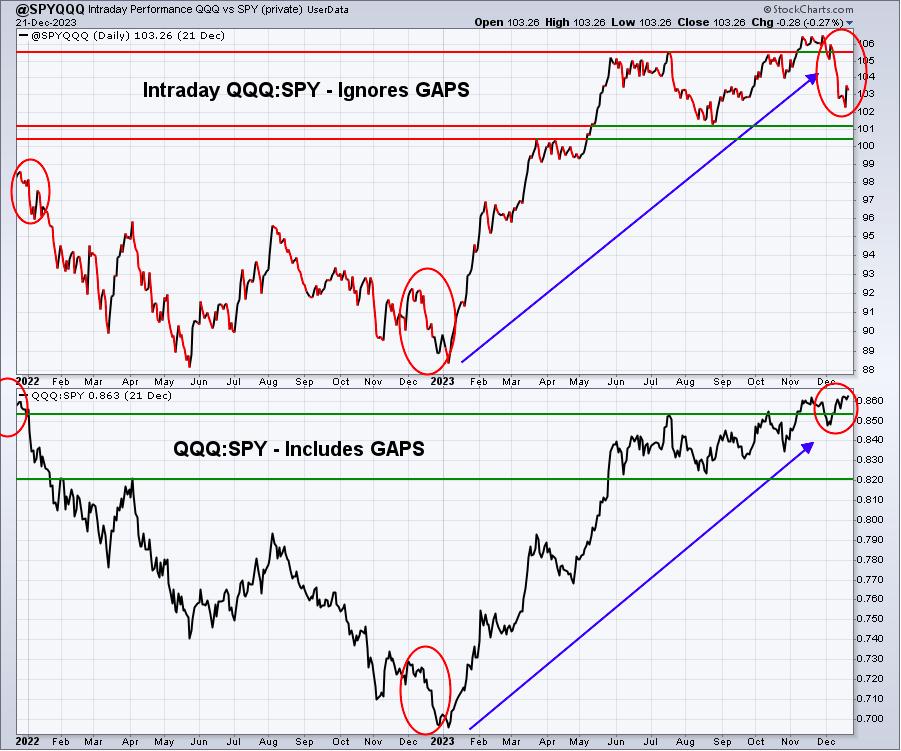
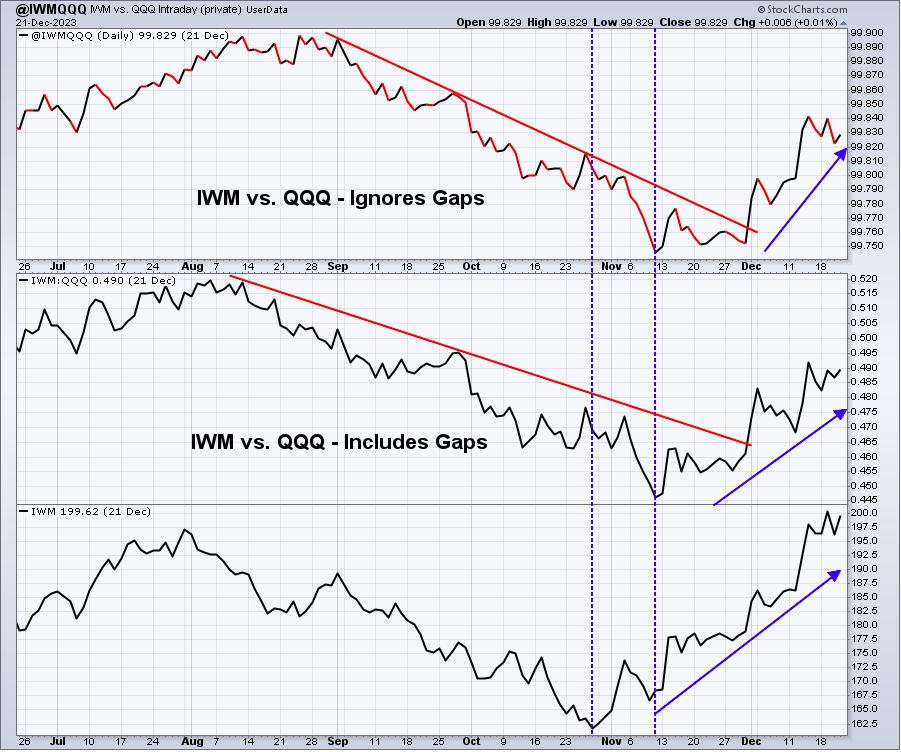
This chart is VERY interesting. If we include the opening gaps, the QQQ:SPY ratio continues pushing higher. But if we ignore the opening gaps and simply follow INTRADAY action, the QQQ vs. SPY is faltering. This tells me that the QQQ is fine at the opening bell, actually doing better at the opening bell than the SPY. But once that bell rings, we're seeing rotation into more value-oriented areas. Because the small cap Russell 2000 does better with value leading, the following IWM:QQQ rally makes very good sense:
Our major indices opened strong today and, after a bit of profit taking, they're rallying again this afternoon. 10 of 11 sectors are higher, but defensive and value-oriented stocks are leading, as evidenced by consumer staples (XLP, +0.92%) and utilities (XLU, +0.90%) leading. Energy (XLE, +0.87%) is also having a strong session as crude oil ($WTIC) nears $74 per barrel.
In economic news, durable goods, which tend to be quite volatile month-to-month, surged 5.4% and well ahead of consensus estimates. Last month, durable goods fell by 5.4%. Hence, the volatility. November personal income and spending came in roughly as expected, but the inflation gauge, Core PCE, rose just 0.1% - below the 0.2% rise expected. It's just one more inflation report heading in the right direction. The annual Core CPE was 3.2%, below the expected 3.4%. The falling inflation is certainly adding to the bullishness on Wall Street. November new home sales came in well below expectations, 590,000 vs. the 690,000 expected. The home construction group ($DJUSHB), however, is slightly higher, despite this news. Finally, consumer sentiment rose to 69.7, slightly ahead of the 69.4 that was forecast.
Have a great weekend and happy holidays everyone!
Tom