
EB Daily Market Report - Quick Update - Thursday, January 4, 2024
I just want to provide a very quick update as I'm preparing for this afternoon's "The January Effect" event, which begins at 4:30pm ET. All members are invited FREE of charge. Room instructions will be mailed out separately. For those unable to attend the event live, we'll record the event and make it available to everyone to listen at your own leisure.
A member wrote in and asked about the correlation between the S&P 500 and Volatility Index ($VIX). Usually, the VIX goes down when the S&P 500 moves up and the VIX goes up when the S&P 500 moves down. Periodically, however, these two will move towards positive correlation, usually indicating a possible reversal in the S&P 500.
Quite honestly, I hadn't looked at this chart over the past couple weeks or I'd have mentioned it. The member astutely pointed out the bounce in correlation into positive territory and this likely has had an impact as we've seen the market turn lower. Check this out:
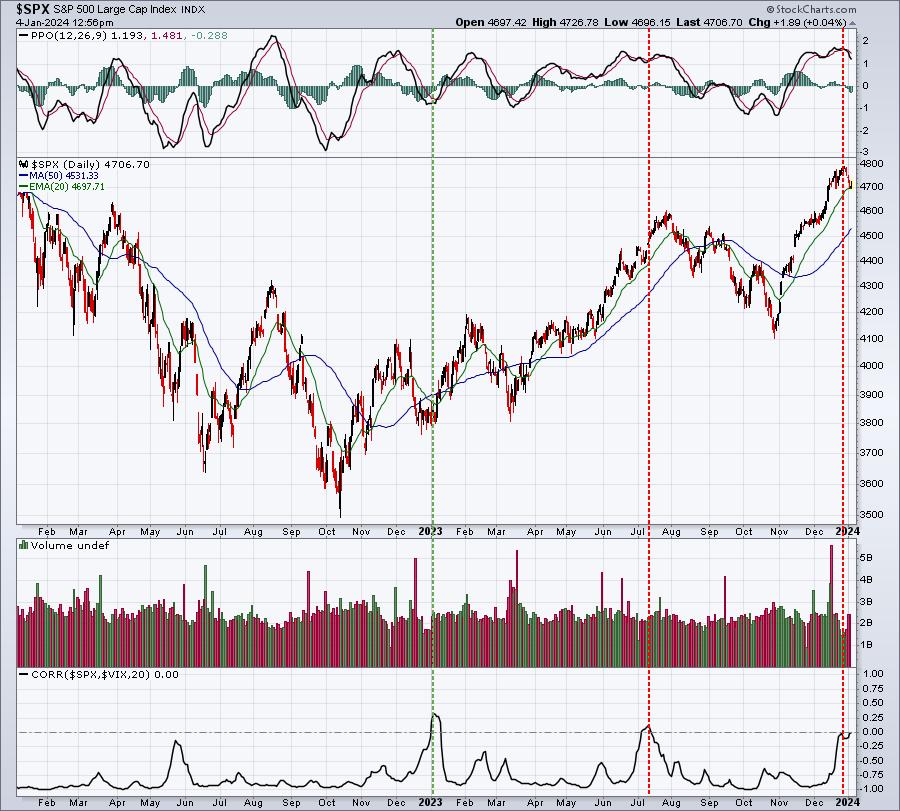
The green-dotted vertical line was a bullish signal because the correlation peaked at a time when the S&P 500 was trending lower. We saw an almost immediate reversal back to the upside. The other two red-dotted vertical lines were bearish signals as they occurred after market uptrends. There was a pause before this positive correlation began to have an effect later in July. I prefer to see the reversal very close to the signal. The December (initial) peak printed perfectly at the recent S&P 500 high. This isn't a signal that flashes often, but is always one to keep an eye on.
Thank you for your comment. I believe EarningsBeats.com is a community of like-minded traders and investors. I have loads of signals in the short-, intermediate-, and long-term. It's certainly possible that I'll miss something from time to time. Don't be shy about writing in and asking questions. This was an awesome question and, clearly, the member was watching this signal closer than I was.
Also, I wanted to provide an update of my IWM/TNA strategy. I continue to own the IWM, I simply sell a portion and move into the TNA when I believe the reward to risk calls for it. The 20-day EMA test yesterday was a solid reward to risk opportunity to increase risk a bit, so I bought into a fairly small TNA position at two levels - when the IWM hit 196 and again when it approached 195. In the Live Trading Room, yesterday, I suggested that second entry in the TNA would be in the 36.25-36.30 area, which is exactly where I added.
The IWM was unable to hold 195 price/20-day EMA support, however, and I ended up getting stopped out of 1/2 of my TNA position when IWM hit 194.25. I held the other 1/2, hoping to see a reversing candle today on the 20-day EMA. When today's rally above 195 on the IWM failed and we began rolling over again just before noon, I sold my other 1/2 of TNA. I took a small loss on the trade and I'm now waiting either for afternoon strength today OR the end of this downtrend - to me, the downtrend potentially could end when the IWM trades higher than its previous day high. Currently, we remain in a downtrend using that definition.
The market is much more unpredictable in the near-term than it is in the long-term. That's what makes short-term trading difficult. Sudden moves higher or lower can trigger emotional trades, so I'd simply suggest that if you're trading short-term, set your targets and stops BEFORE you place the trade. Understand your strategy and stick to it. There will be plenty of trades down the road, but we need to hang on to the majority of our capital.
I look forward the January Effect event this afternoon and am really getting pumped up for Saturday's MarketVision 2024. I hope to see you all at both!
Happy trading!
Tom