
EB Daily Market Report - Thursday, January 11, 2024
Executive Market Summary
- Futures were up overnight and prior to the December CPI report, which was released at 8:30am ET
- The December Core CPI jumped to +0.3%, slightly above the +0.2% expectation
- Futures immediately turned negative and that began an extremely volatile session today - at least relative to what we've been experiencing the past couple months
- The Russell 2000 has again lagged and it's also again gapped lower at the opening bell, the eighth time in nine days this has occurred
- Cryptocurrencies are having another solid day with etherium ($ETHUSD, +5.48%) surging
- Most commodities are higher, including crude oil ($WTIC, +1.32%), jumping back above $72 per barrel
- Somewhat surprising, the 10-year treasury yield ($TNX) is down 5 basis points and at its low of the day, despite the higher-than-expected Core CPI number this morning
- Technology (XLK, +0.38%) and energy (XLE, +0.16%) are the two sectors rising today, while defensive areas lag; utilities (XLU, -2.42%) are being hit the hardest
- Netflix (NFLX, +2.98%) leads the S&P 500 today, not too surprising as NFLX has a long history of rising in January into its earnings report; NFLX reports on January 23rd
Market Outlook
Here are my latest thoughts on the S&P 500, NASDAQ 100, and Russell 2000:
S&P 500
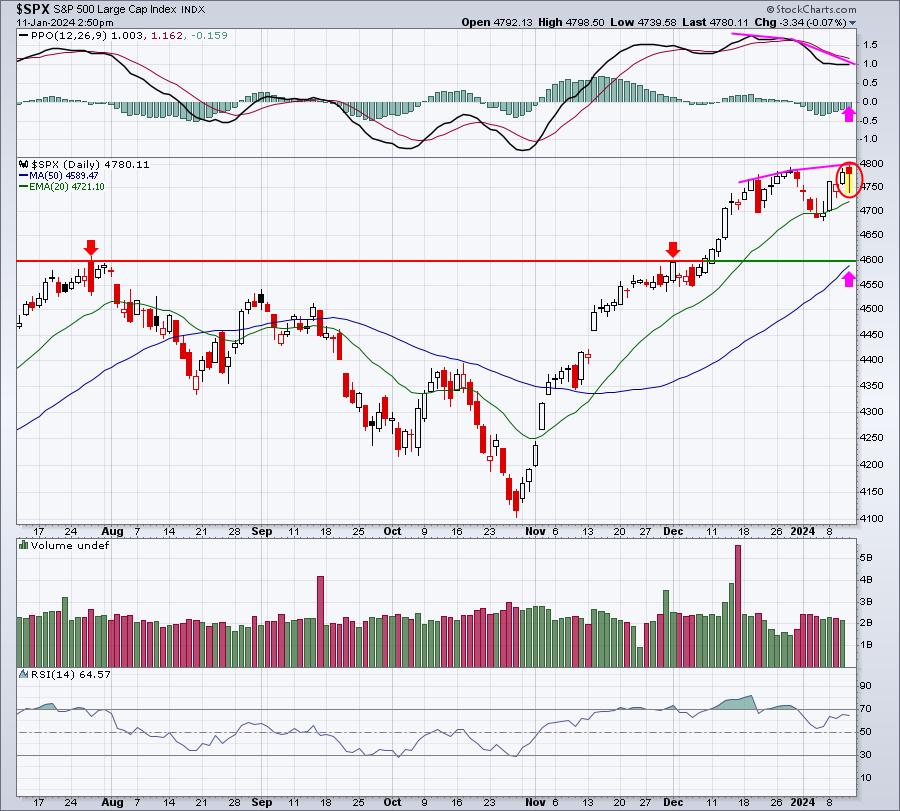
It's been a very nice recovery from earlier selling, but further price highs here on the S&P 500 are going to print a very nasty divergence as a result. While this never guarantees us that we'll see selling ahead, my experience and research suggests that the RISK of further selling ahead is growing. I do believe the downside is in the 4550-4600 range, if further selling does, in fact, kick in. Negative divergences tell me to look for the potential of selling down to test the 50-period SMA and a drop in the PPO back to or near centerline, or zero line, support.
NASDAQ 100:
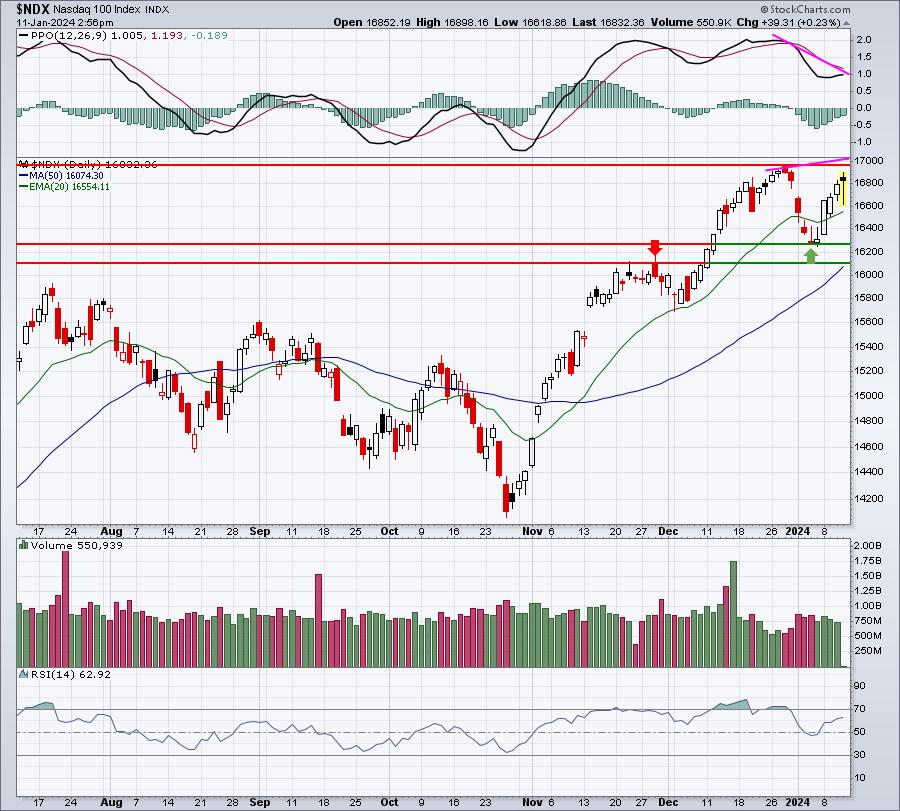
The NDX looks quite similar to the SPX. The biggest difference is that the NDX has not yet been able to test its recent high. However, if a new high is reached, the negative divergence here is quite ominous as well.
Russell 2000:
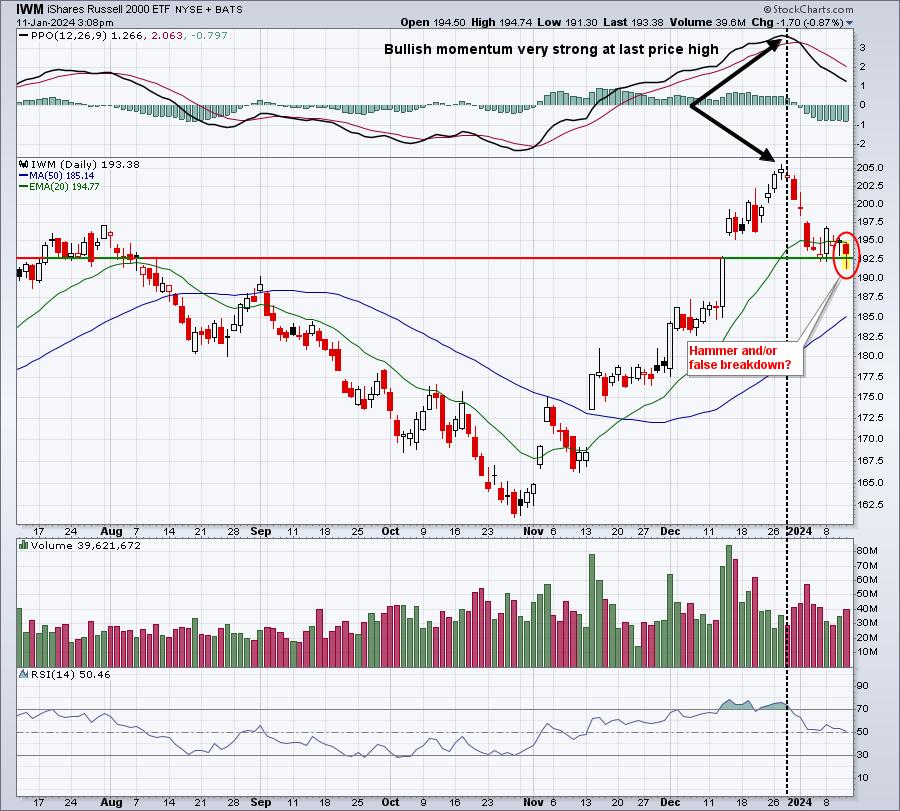
How do we finish on our major indices today? Right now (and things can change in next 50 minutes) I like the kick save after losing gap support at 192.67. A nice finish today would result in a false breakout and potential reversing hammer printing. Of course, if we see another selloff like we did after the opening bell today, then all bets are off.
Sector/Industry Focus
You know I follow sentiment closely, most notably tracking the Volatility Index ($VIX) and the equity only put call ratio ($CPCE). I want to point out that on Wednesdays (I have no idea why only Wednesdays), major hedge funds are buying TONS of equity puts in the middle of the trading day to hedge against potential drops in some of the key large cap stocks like AAPL, MSFT, AMZN, GOOGL, TSLA, META, NVDA, etc. This happened at the end of 2022 and 2023 and it's carrying over thus far into 2024. This does NOT measure the sentiment of the retail trader. It skews my analysis of the CPCE. As a result, I maintain a User-Defined Index at StockCharts.com, tracking the equity only put call ratio and reporting on it quite often in our Weekly Market Report. Therefore, I won't show my UDI chart now, but I will show you how these "institutional" equity puts are skewing our 5-day SMA of the CPCE - which we use to help us call short-term market tops and bottoms:
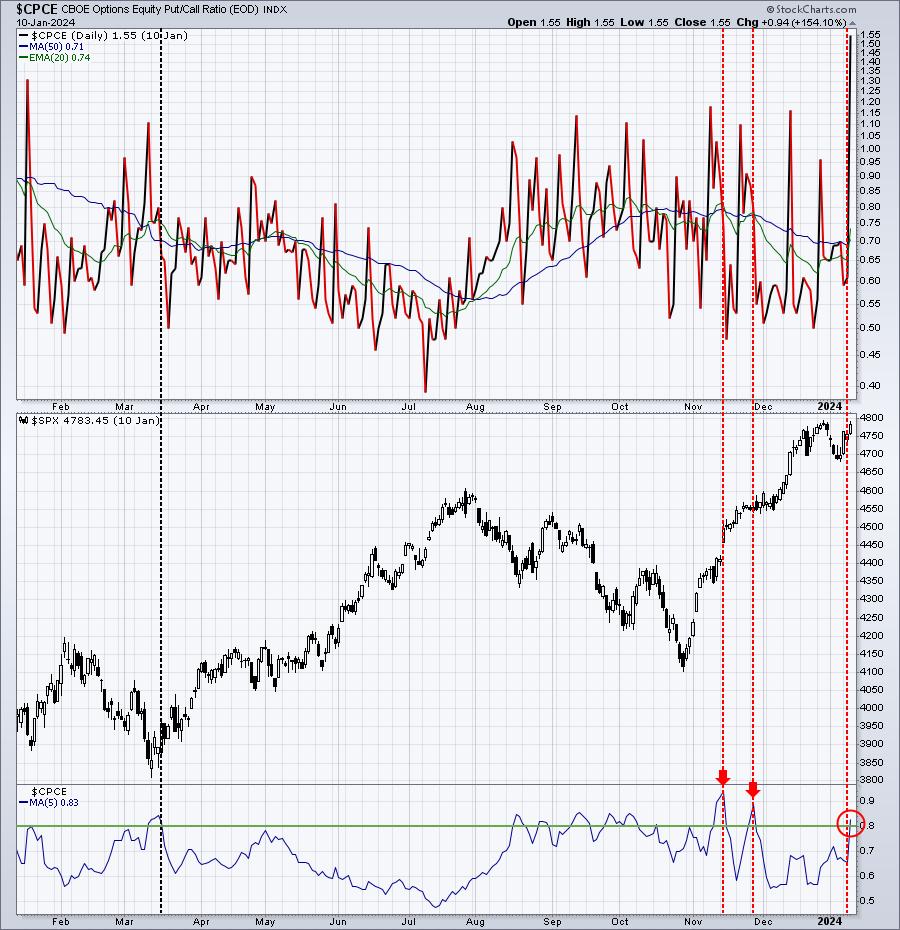
When the 5-day SMA of the CPCE hits .80, it's typically a sign of significant panic as put buyers are out in full force. At the top of the chart, you can see all the daily readings of the CPCE. Those crazy daily spikes represent the hedging of institutions. They do NOT represent retail traders buying puts in a state of panic. Who in the world would be "panic buying" puts when the S&P 500 is going STRAIGHT UP? This is why I keep a User-Defined Index - to track what retail traders are doing in the options world.
ChartLists/Strategies
It is growing riskier to place individual trades, so I'd likely sit that out. Given the increasing odds of short-term selling, I think I'd hold off for a bit. I definitely need to see how we finish today before even thinking about placing a trade. The downside risk is real.
Earnings Reports
Here are the key earnings reports for the next two days, featuring stocks with market caps of more than $10 billion. I also include notable companies with market caps below $10 billion. Finally, any portfolio stocks that will be reporting results are highlighted in BOLD. If you decide to hold a stock into earnings, please understand the significant short-term risk that you are taking. Please be sure to check for earnings dates for any companies that you own or are considering owning.
Thursday, January 11:
INFY
Friday, January 12:
UNH, JPM, BAC, WFC, BLK, C, BK, WIT, DAL
Economic Reports
Initial jobless claims: 202,000 (actual) vs. 209,000 (estimate)
December CPI: +0.3% (actual) vs. +0.2% (estimate)
December Core CPI: +0.3% (actual) vs. +0.2% (estimate)
Happy trading!
Tom