
EB Daily Market Report - Tuesday, January 16, 2024
ChartList Updated
I provided the January Seasonality stocks at the beginning of the year, but an astute member pointed out that the ChartList had not been posted to our website. That has been taken care of and you should now be able to download or view this Seasonality ChartList at your convenience
January Max Pain Event
Our monthly Max Pain event will be held today at 5:00pm ET. A separate email was sent out earlier with room instructions. If you have any questions, please email us at "[email protected]".
Executive Market Summary
- Futures were down overnight and we saw gap downs to open the week
- We've seen relative weakness in mid and small caps once again
- Options expire this Friday, so at least be prepared for possible downside action and increased volatility
- Speaking of volatility, the Volatility Index ($VIX, +10.19%) has spiked to near 14, threatening the 2-week high
- Earnings season is beginning to accelerate with a huge upside earnings surprise from Goldman Sachs (GS, +0.12%); a lot of good news was built in during the Q4 market advance and stocks like JPM and GS have struggled to move higher, despite impressive quarterly results
- Commodities are mostly lower, with crude oil ($WTIC, -0.62%), gold ($GOLD, -0.92%), and silver ($SILVER, -0.94%) all lower
- The 10-year treasury yield ($TNX) jumped 12 basis points to 4.07%; rising yields could certainly offer up headwinds for stocks, so keep an eye on the TNX
- Technology (XLK, +0.04%) is the only sector higher on the session; energy (XLE, -2.19%) lost any momentum it had built up last week
Market Outlook
We're a day closer to the end of the most bullish period of the year, which is the October 27th close through January 18th close (Thursday). This doesn't mean the stock market will just spiral lower from here, but simply be aware that historical tailwinds are no longer supporting our major indices.
I posted the annualized returns for the current week, so I won't post them again. However, will mention that January 19th through January 22nd typically produces historical headwinds for the S&P 500. Since 1950, these 4 days have gained ground 100 times and lost ground 98 times, so roughly a coin toss. The annualized return for these 4 days is -23.22%. In 2024, these four days happen to coincide with January options expiration (Friday is the 19th) and the Monday after options expiration (Monday is the 22nd). These two days typically can provide a bit of turbulence.
Sector/Industry Focus
Energy (XLE) showed a bit of strength to close out last week, but there's no such strength present today. If you're bullish this group, you really want to see a double bottom print in the 80-81 level.
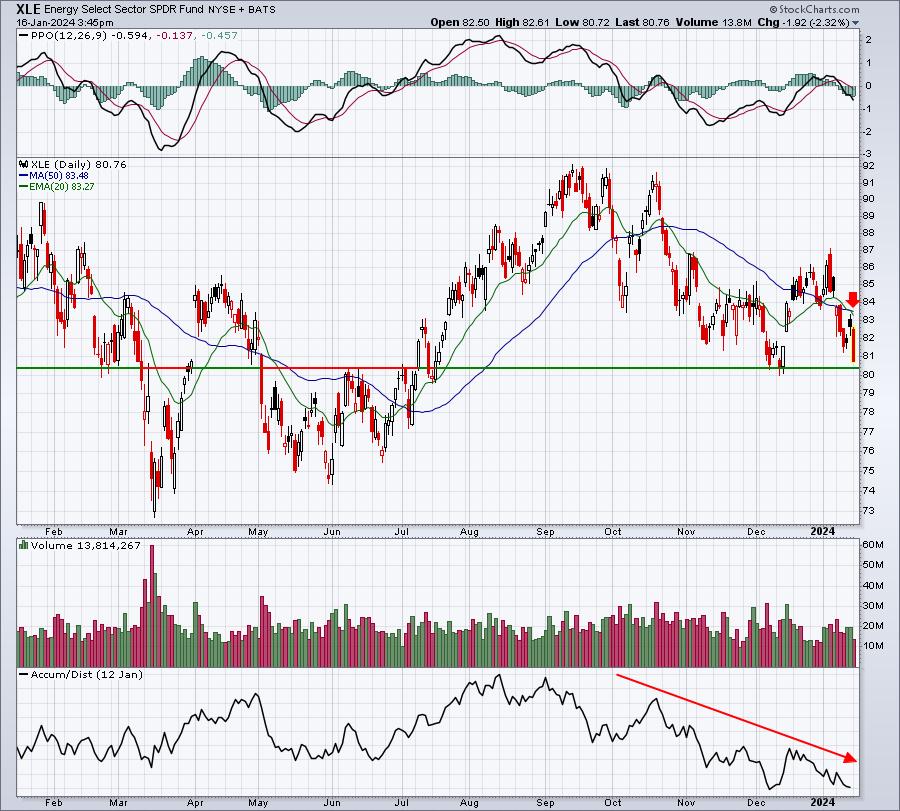
A hammer and a false breakout could trigger a short-term trade off of key support, but it's hard to ignore the ugly AD line and PPO. Also, the selling today accelerated after the XLE failed to clear its declining 20-day EMA. There's more work to be done here.
ChartLists/Strategies
Here is the type of chart that I like to trade. I am keeping in mind, however, that the overall market has issues. Still I did buy this one and banking on the top of gap support holding:
ACCD:
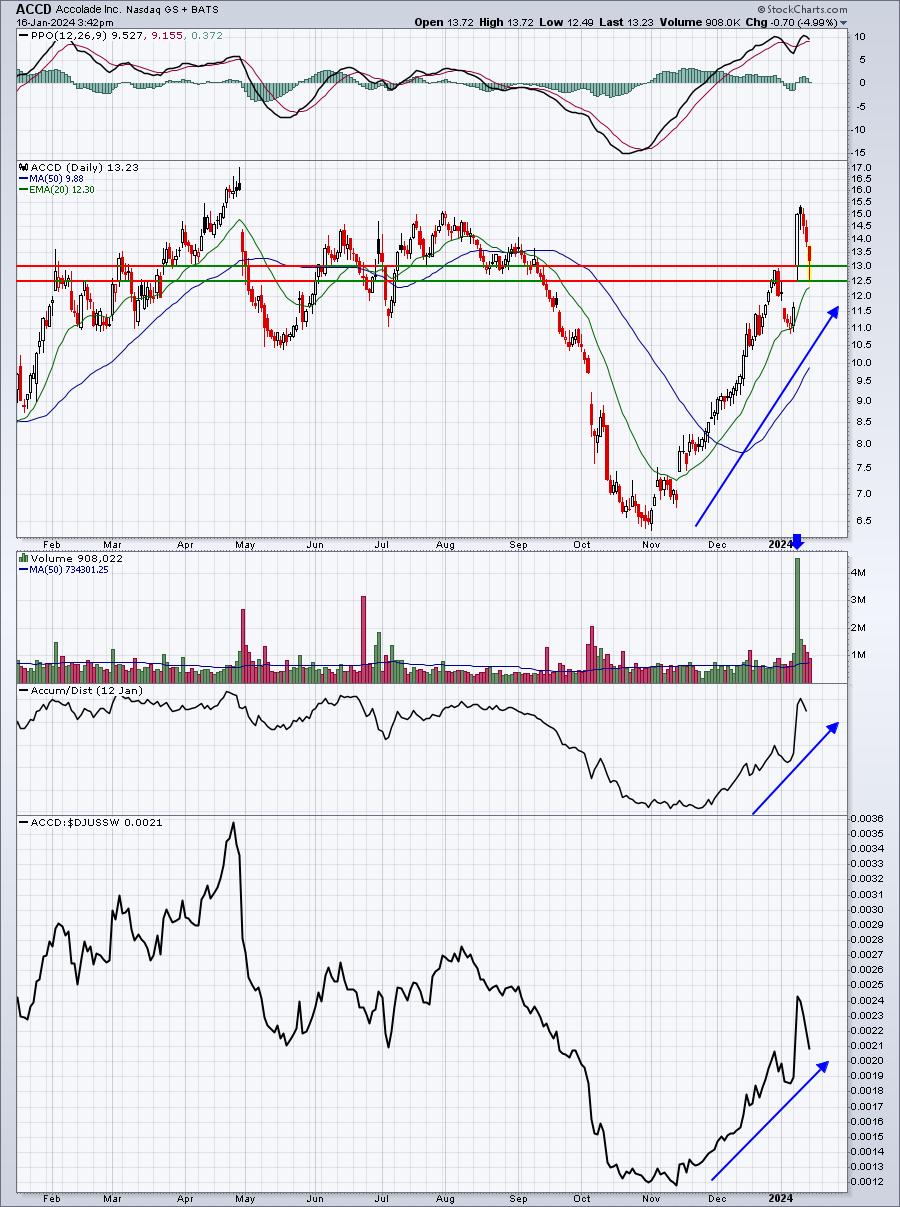
The 12.50-13.00 gap support area is what I'm watching. Very heavy volume accompanied the gap up and follow through, which occurred as the result of quarterly earnings and raised guidance.
Earnings Reports
Here are the key earnings reports for the next two days, featuring stocks with market caps of more than $10 billion. I also include notable companies with market caps below $10 billion. Finally, any portfolio stocks that will be reporting results are highlighted in BOLD. If you decide to hold a stock into earnings, please understand the significant short-term risk that you are taking. Please be sure to check for earnings dates for any companies that you own or are considering owning.
Tuesday, January 16:
MS, GS, PNC, IBKR, PNFP, HWC, FULT, PRGS, FBK
Wednesday, January 17:
PLD, SCHW, USB, KMI, DFS, CFG, WTFC, AA, SNV, FUL
Economic Reports
January empire state manufacturing survey: -43.7 (actual) vs. -4.7 (estimate)
Happy trading!
Tom