
EB Daily Market Report - Wednesday, January 17, 2024
Q4 Earnings - Sneak Preview
At 4:30pm ET today, we'll have our quarterly Sneak Preview Event, using relative strength to predict the early winners and losers of earnings season. A separate email detailing room instructions was sent earlier this morning.
ChartList Updated
We added an exclusive ChartList that highlights ALL of the holdings of CALF, an ETF comprised of small cap stocks that have high free cash flow yields. CALF has a history of outperforming the small cap Russell 2000 (IWM is the ETF that tracks this index), so I was interested in seeing how individual stocks within the ETF are performing and also to see which sectors/industry groups seem to be participating the most to the upside - more "below the surface" signals.
Also, upcoming earnings ChartLists were added to the bottom of the ChartLists page. If you're interested in following the companies that are reporting quarterly results this week, you'll want to check those out.
Executive Market Summary
- Futures were down overnight and we saw opening gaps to the downside across our major indices
- December retail sales came in above expectations - see below for numbers
- All 11 sectors are lower, led by real estate (XLRE, -2.44%) and utilities (XLU, -1.80%)
- The other 2 defensive sectors, consumer staples (XLP, -0.18%) and health care (XLV, -0.35%) were the top-performing sectors - weird
- Energy (XLE, -0.95%) is threatening to close below 80.00 for the first time since mid-July, despite slightly higher crude prices ($WTIC, +0.37%)
- Gold ($GOLD, -1.05%) is nearing $2000 per ounce, which would represent its first significant close beneath its 50-day SMA since breaking above that moving average in mid-October 2023
- Meanwhile, the U.S. Dollar Index ($USD, +0.33%) is closing ABOVE its 50-day SMA for the first time since early-November
- The Volatility Index ($VIX, +8.53%) has moved above 15 for the first time since the second week of November
Market Outlook
We're seeing some of the selling that we typically see during options expiration week. It also can last into the following week, which is why the 19th-25th calendar period has been the weakest for more than 7 decades. It always makes sense to be more cautious this time of EVERY calendar month, with December being the one exception. In December, the 19th and 20th have historically shown weakness, but that calendar period weakness usually ends early, as the stock market turns its attention to the holidays and bullish market action.
Here's a quick glance at the NASDAQ 100 ($NDX), which is testing and threatening to lose 20-day EMA support today:
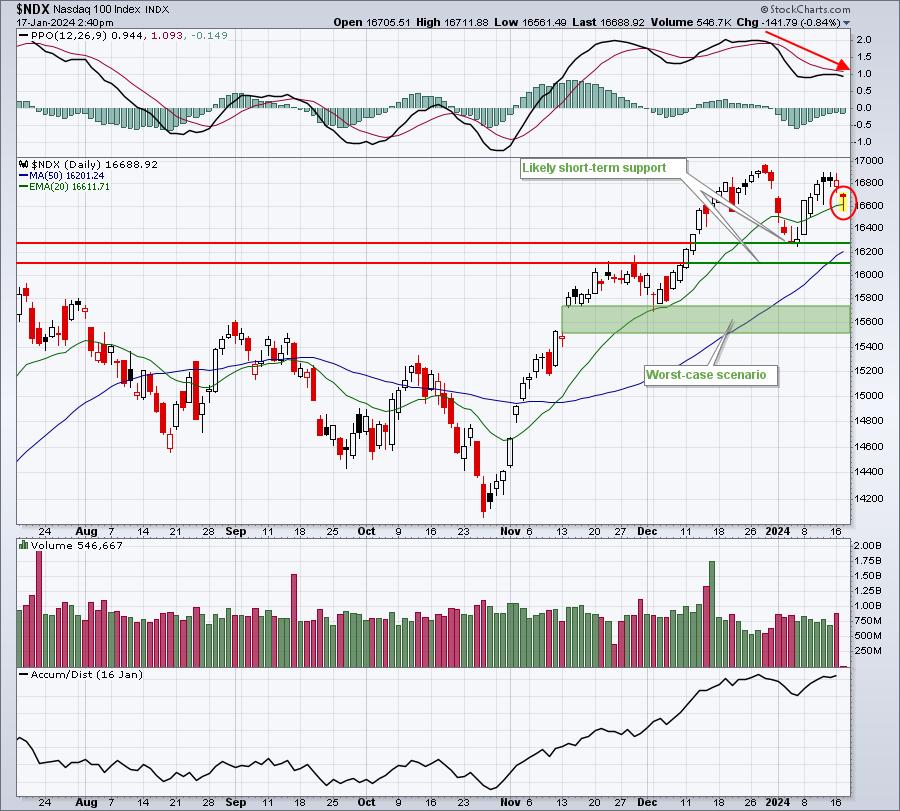
Currently, the NDX is holding onto 20-day EMA support and that's initial support, in my view. If we lose 20-day EMA support (whether it be today, tomorrow, or next week), I believe it increases the likelihood that we see my 3-5% downside scenario unfold. In what I view as the "worst-case scenario", further weakness could carry us down to the 15500-15700 gap support zone. That would be getting very close to "correction material", or a 10% decline. And when I say "worst-case scenario", obviously the actual worst-case scenario would be much, much lower than that gap support zone. So please keep this in context. I'm speaking from a continuing bull market perspective, in which we have only mild pullbacks. I'm not calling for a correction or cyclical bear market at this time. As we know, however, anything can happen. So given how I believe the stock market plays out in 2024, it's MY "worst-case scenario".
One level to the upside worth watching on the NDX is its 20-HOUR EMA. It broke near-term price support on its hourly chart, so a 20-hour EMA test is important for short-term traders:
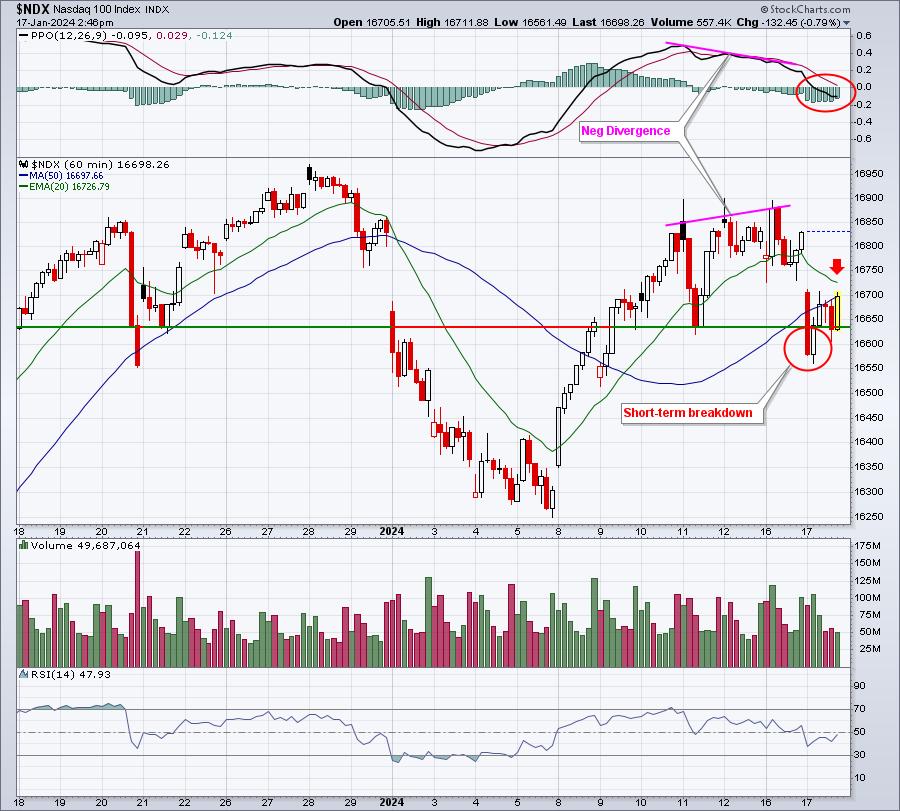
If we've started a downtrend, the 20-hour EMA should serve as key resistance. Let's see how the rest of the day unfolds. But the short-term price advantage stays with the bulls based on the kick save off the 20-day EMA.
Sector/Industry Focus
I've spoken a great deal about manipulation and one of the easiest forms to spot, in my opinion, relates to gap downs - as opposed to intraday selling. The latter suggests DISTRIBUTION. The former suggests MANIPULATION. I'm going to take my manipulation thoughts down to the individual stock level today and look at Tesla (TSLA). I'm paying very close attention to TSLA's trading routine right now as it's my favorite long-term stock. If I can gain any advantage in short-term trading of TSLA, then I'm absolutely going to do it. First, check out the recent price breakdown below prior price/gap support:
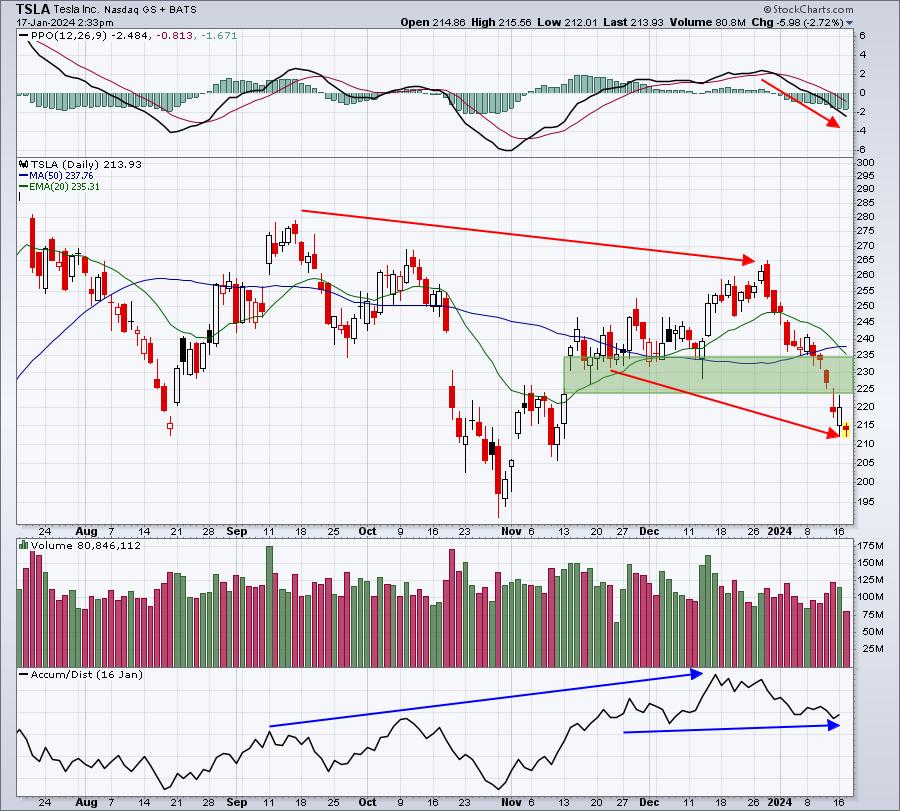
Since the January 8th close just above 240, TSLA has fallen roughly 26.50 bucks to 214. You may or may not realize it, but we've seen net gaps lower of 21.52 since January 8th, representing more than 80% of TSLA's decline. It hasn't been a mass selloff like the chart above would suggest. In fact, over the past 5+ days, TSLA has dropped just 2.19 after 11am ET on a net basis. Instead, what's happening is TSLA is being forced lower at the opening bell and unsuspecting retail traders are selling in the morning hours, influenced by the early gaps. But after 11am ET, things quiet down for TSLA and, in my opinion, it's being accumulated. The AD line would certainly support my view. The AD line is trending upwards, reeking of accumulation, while those looking at TSLA on the surface are seeing what appears to be a big selloff.
Here's another fact to consider: TSLA reports its quarterly results next Wednesday, January 24th after the market closes. Remember the Top 16 stocks Excel spreadsheet, where I tracked 16 of the largest stocks, analyzing their historical trading pattern throughout this secular bull market? Well, if we look ONLY at the first calendar month of each quarter - January, April, July, October - TSLA is the BEST performer of all 16 stock, producing an annualized return of 70.93% during its earnings months. January 2024 hasn't been kind thus far, but it's also not over. If we get a reversal, or if we reach key price support just below 200, I would not be surprised to see a significant advance. Let's keep our eyes wide open as we consider TSLA for a trade soon.
ChartLists/Strategies
And this is why I've been trading individual stocks sparingly over the past couple years. Yesterday was a nice setup, in my opinion, on ACCD. It's done nothing but drop today. I'm holding for now, mostly because my position size is smaller than normal. I might even add to a full position if ACCD were to reach the bottom of gap support. But any close beneath that gap support and I'll take the loss. The 20-day EMA support should offer up closing support and could be used as a stop as well. But I'd make sure the close was below. For me, I've decided to give it a bit more room to the downside. It could be a mistae, but a late-afternoon rally and close above the 20-day EMA could mark a bottom. Either way, ACCD has been very disappointing thus far:
ACCD:
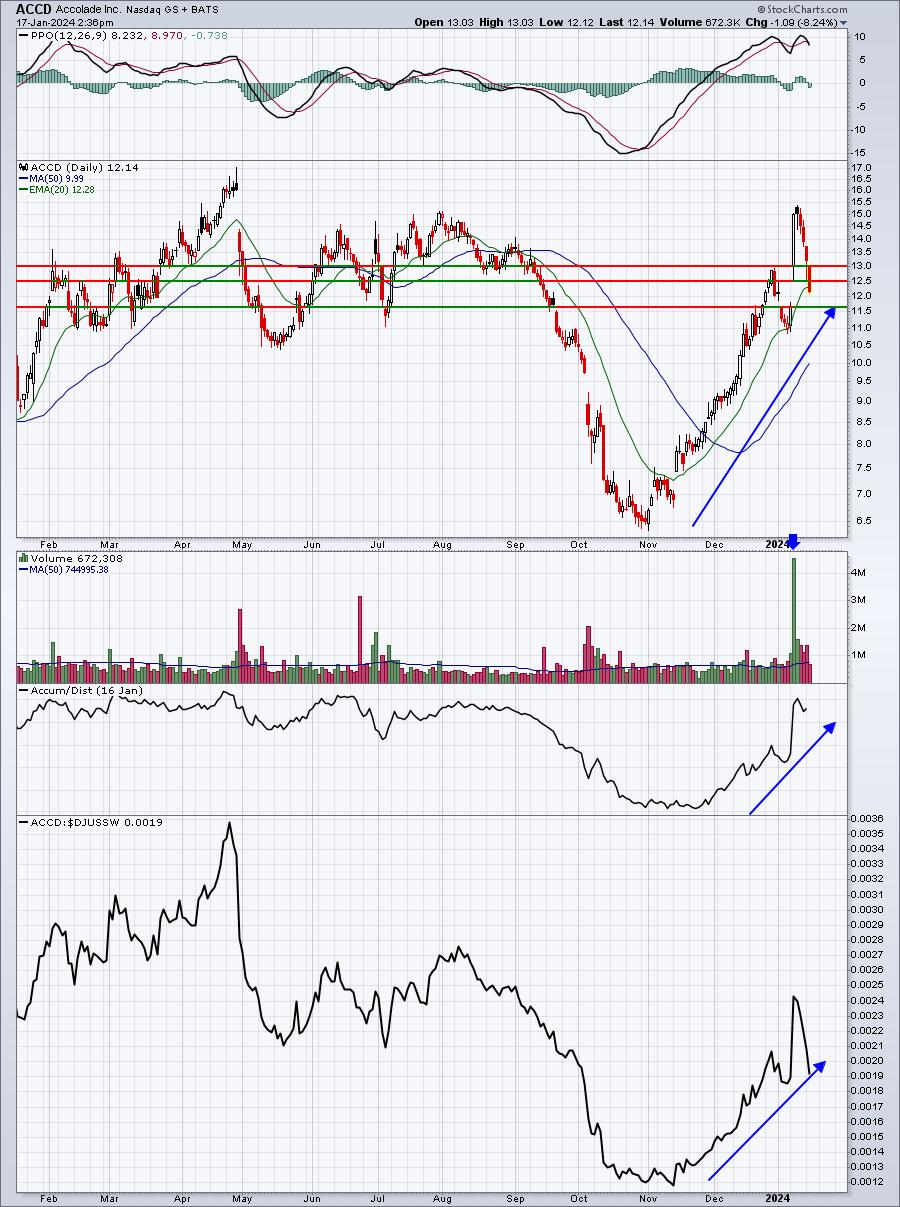
This is the same chart I showed yesterday, with one exception. I added the bottom of gap support line to highlight that support level. It's at 11.62. I'd really like to avoid reaching that level, but the reality is we're currently trying to hold the 20-day EMA and the bottom of gap support is now only 4-5% away.
Earnings Reports
Here are the key earnings reports for the next two days, featuring stocks with market caps of more than $10 billion. I also include notable companies with market caps below $10 billion. Finally, any portfolio stocks that will be reporting results are highlighted in BOLD. If you decide to hold a stock into earnings, please understand the significant short-term risk that you are taking. Please be sure to check for earnings dates for any companies that you own or are considering owning.
Wednesday, January 17:
PLD, SCHW, USB, KMI, DFS, CFG, WTFC, AA, SNV, FUL
Thursday, January 18:
TFC, FAST, PPG, MTB, JBHT, NTRS, KEY, CBSH, OZK, TCBI
Economic Reports
December retail sales: +0.6% (actual) vs. +0.4% (estimate)
December retail sales less autos: +0.4% (actual) vs. +0.2% (estimate)
December industrial production: +0.1% (actual) vs. -0.1% (estimate)
December capacity utilization: 78.6% (actual) vs. 78.7% (estimate)
November business inventories: -0.1% (actual) vs. -0.1% (estimate)
January housing market index: 44 (actual) vs. 38 (estimate)
January beige book released at 2:00pm ET
Happy trading!
Tom