
EB Daily Market Report - Wednesday, January 24, 2024
Q4 Earnings Event Today
I'll be hosting our Q4 Earnings event at 5:00pm ET today. We look ahead at key upcoming earnings reports and those companies that appear poised to report strong or poor earnings based upon their relative strength. It's an educational session and one that will likely provide a different perspective into how the stock market performs as earnings approach.
If you can't make the event live, we do record all of our events and you'll be able to view the recording at your leisure. Room instructions have been sent out in a separate email.
Executive Market Summary
- Futures were higher overnight, mostly in response to strong earnings reports by key companies, including Netflix (NFLX, +12.44%); NFLX did miss its earnings estimate, but stormed past new subscriber estimates
- Bitcoin ($BTCUSD, +0.98%) is rebounding, along with most cryptocurrencies
- Commodities are mostly higher as crude oil ($WTIC, +0.89%) moves back above $75 per barrel
- The 10-year treasury yield ($TNX) is up 2 basis points to 4.17%, nearing key yield resistance at 4.20%
- Technology (XLK, +1.24%) remains strong and is leading all sectors today; it's a mixed bag as 6 sectors are down today, including the primary laggard, utilities (XLU, -1.41%)
- Semiconductors ($DJUSSC, +2.77%) are having a strong session, as is software ($DJUSSW, +1.11%), helping to lead technology higher
- Meanwhile, internet stocks ($DJUSNS, +1.66%) are performing well on the heels of the strong market reaction to the NFLX earnings report
- Texas Instruments (TXN, -2.11%), despite posting better-than-expected EPS (1.49 vs. 1.46); revenue did come in below expectations, however, and TXN is not keeping up with its semiconductor peers
Market Outlook
I believe banks ($DJUSBK) could be a driver for the stock market in 2024 and I haven't said that often over the past decade. This group is improving technically, and the economic backdrop supports the group as well. In my opinion, a rapidly-declining fed funds rate will reverse the inverted yield curve that we experienced in 2022 and 2023. Check out the DJUSBK:
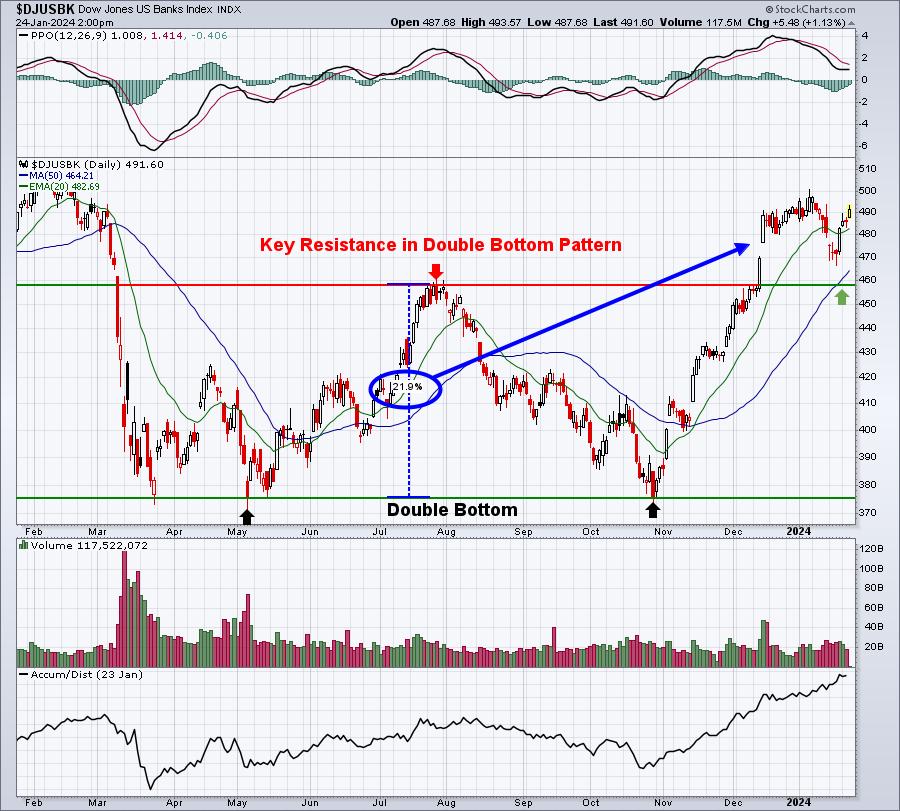
Look at that AD line at the bottom. It certainly appears the group is being accumulated, based on this indicator. The 2023 double bottom pattern executed when the reaction high between these two lows was cleared. The initial measurement on this pattern is the percentage from the double bottom low (375) to this reaction high (460). That percentage is 21.9%. If we calculate the measurement (21.9% x 460), we get an additional 100 points higher from 460, or 560. Given that the DJUSBK is currently trading at 491, the measurement of 560 would indicate a remaining gain of roughly 14% to meet this initial measurement. I'm looking for a bigger gain in banks in 2024, but this would be the initial pattern to consider.
Sector/Industry Focus
Let's take a look at the inverted yield curve in chart form. The two most widely used calculations are the 10-year treasury yield minus the 2-year treasury yield ($UST10Y-$UST2Y) and the 10-year treasury yield minus either the 3-month treasury yield or 1-month treasury yield ($UST10Y-$UST3M or $UST10Y-$UST1M). Here's where we stand relative to that 2-year treasury yield:
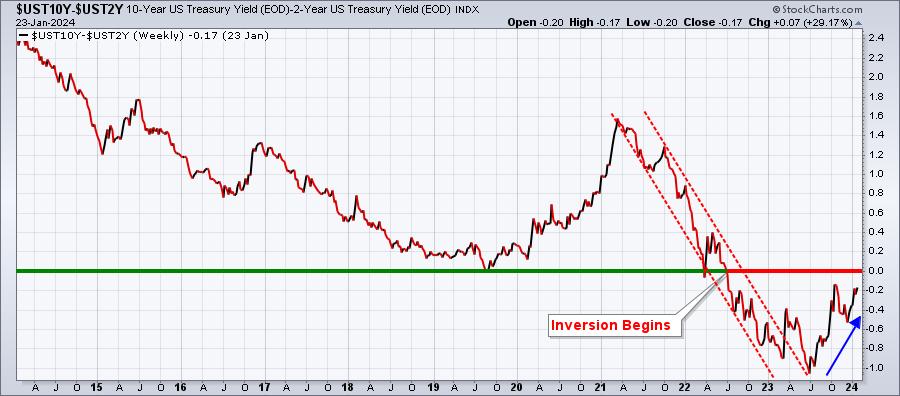
You've probably heard MANY analysts talk about the inverted yield curve and how it means a recession is likely to occur. I don't believe that. I believe it increases the odds of a recession, because it pressures the net interest margin of banks, which is their primary profit driver. If banks are pressured to too great of a degree, it can impact their ability and willingness to lend. If economic conditions weaken and loan loss reserves move significantly higher and banks curb lending, then yes a recession can materialize. But in the case of 2023, we saw economic conditions expand - even in light of a tightening Fed. This tightening did NOT happen, because of where we stood in the economic cycle. It happened because the Fed wanted to make sure it stayed ahead of inflation and stopped it in its tracks. These are two completely different reasons for raising rates. Since economic conditions have remained relatively strong (soft landing), banks have not reduced its lending capacity to the point of triggering a recession. Personally, I don't see it happening. And, if we look at most price charts and intermarket relationships, Wall Street completely agrees with me.
Let those media outlets talk about recession. In the meantime, let's stick with the long side of this secular bull market advance. We'll definitely have pullbacks along the way, but I just don't see signals that suggest we'd see a pullback on the S&P 500 much past the 4600 level to the downside.
ChartLists/Strategies
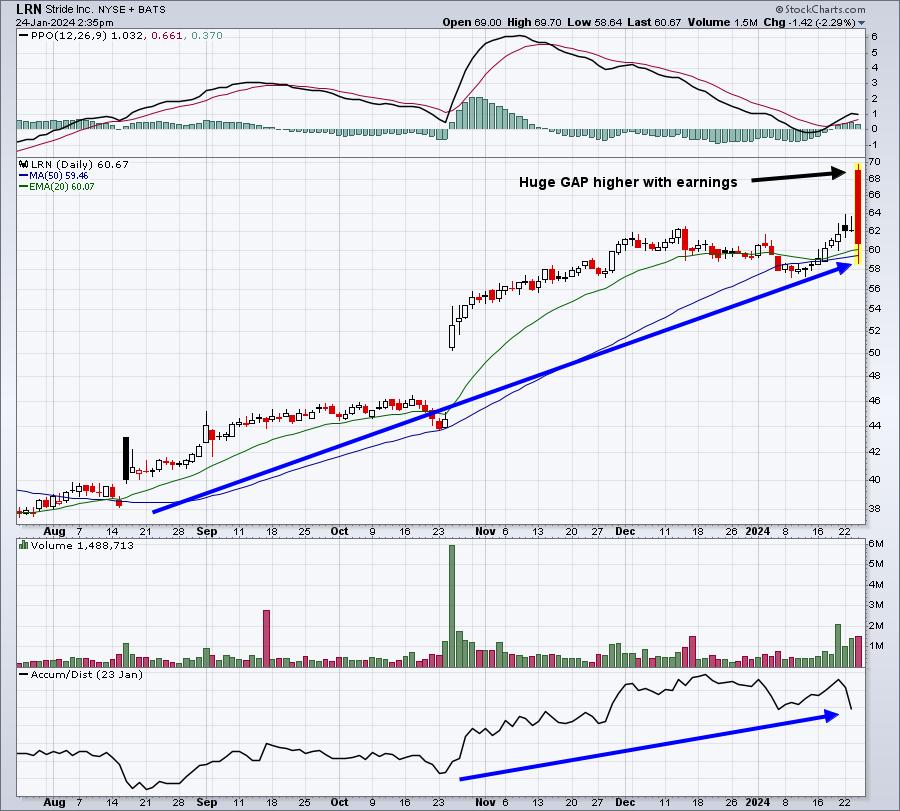
In this morning's trading room, I offered up a VERY risky trading strategy that I sometimes employ during earnings season. I like to find excellent relative strength leaders that report better-than-expected revenues and EPS that trade lower in the morning hours (think buy on rumor, sell on news) and look for a quick reversal. Stride, Inc. (LRN) was one such company today. Initially, it gapped up MUCH higher, but the sellers immediately drove LRN lower by 12 bucks, or nearly 20% of its market cap. I entered at 60.11 just after 10am ET (time the trading room opened). I explained that the trade was very risky and also very likely to last HOURS, not DAYS or WEEKS. I just wanted a quick pop. At the end of the LIVE trading room session, I looked and LRN was up nearly 2% (it had gained over 3% just a tad earlier). I took the profit. Made 2% in perhaps an hour. I'd take a trade like that every day. I explained it was only a small position, because the risk of the trade was high. Here's how it shaped up on the daily and 10-minute charts:
LRN (daily):
LRN (10-minute):
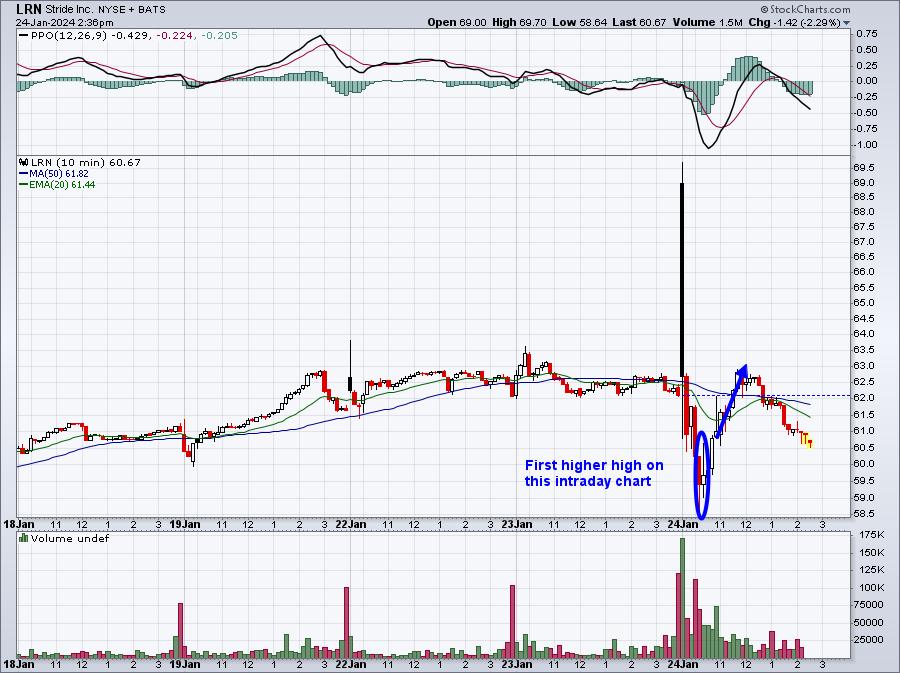
From the daily chart, you can see that LRN had been a very solid performer throughout the past several months. The excellent quarterly earnings report triggered the higher open, but the "sell on the news" mentality kicked in and LOGI fell 11-12 bucks in 30 minutes! In my opinion, that created a short-term opportunity. There was no telling where LRN might end the session, but I did say that a quick trip back to 64 or so was a real possibility. Ultimately, the high was 63, although the day isn't over. Bottom line is I pulled the trigger, made 2% (in at 60.11, out at 61.26) in an hour or so, and then returned to cash.
Personally, I like to swing trade and hold positions for much longer - days to weeks. But earnings season is a different animal and, to the extent I can, I try to take advantage of the very short-term intraday opportunities.
Earnings Reports
Here are the key earnings reports for the next two days, featuring stocks with market caps of more than $10 billion. I also include notable companies with market caps below $10 billion. Finally, any portfolio stocks that will be reporting results are highlighted in BOLD. If you decide to hold a stock into earnings, please understand the significant short-term risk that you are taking. Please be sure to check for earnings dates for any companies that you own or are considering owning.
Wednesday, January 24:
TSLA, ASML, ABT, SAP, IBM, NOW, T, ELV, LRCX, CSX, GD, APH, FCX, CCI, KMB, TEL, URI, AMP, LVS, RMD, RJF, TDY, WRB, STX, TXT, PKG, EDU, KNX, CACI, HXL, SLG
Thursday, January 25:
V, INTC, TMUS, CMCSA, UNP, NEE, MMC, BX, KLAC, SHW, NOC, AJG, HUM, COF, VLO, LHX, DOW, XEL, FICO, WY, MBLY, NOK, WDC, LUV, MKC, AAL, ORI, EXP, CFR, OLN, MUR, ALK, CNX, XRX, NTCT
Economic Reports
January composite (manufacturing): 50.3 (actual) vs. 47.7 (estimate)
January composite (services): 52.9 (actual) vs. 51.0 (estimate)
Happy trading!
Tom